

Summary
Atypical Protein Kinase iota (PKCι) is a key organizer of the apical domain in epithelial cells. Ezrin is a cytosolic protein that, upon activation by phosphorylation in T567, is localized under the apical membrane where it connects actin filaments to membrane proteins and recruits protein kinase A (PKA). To identify the kinase that phosphorylates ezrin T567 in simple epithelia, we analyzed the expression of active PKC and the appearance of pT567 during enterocyte differentiation in vivo. PKCι phosphorylated ezrin in T567 in vitro, and in Sf9 cells that do not activate h-ezrin. In CACO-2 human intestinal cells in culture, PKCι co-immunoprecipitated with ezrin and was knocked-down by shRNA expression. The resulting phenotype showed a modest decrease in total ezrin, but a steep decrease in T567 phosphorylation. The PKCι-depleted cells showed fewer and shorter microvilli and redistribution of PKA regulatory subunit. Expression of a dominant negative form of PKCι also decreased pT567 signal, and expression of a constitutively active PKCι mutant showed depolarized distribution of pT567. We conclude that, although other molecular mechanisms contribute to ezrin activation, apically localized phosphorylation by PKCι is essential for the activation and normal distribution of ezrin at the early stages of intestinal epithelial cell differentiation.
Introduction
The sorting mechanisms responsible for the polarization of membrane proteins in epithelial cells, which result in the segregation of apical and basolateral domains, have been extensively studied (Nelson, 2003; Zegers et al., 2003). On the other hand, our understanding of how cytosolic proteins interface the cytoskeleton with the membrane in the form of submembrane scaffolds is still incomplete. Ezrin is one important example among this category of polarized extrinsic membrane proteins. Although expressed in other tissues as well, ezrin is apical in simple epithelial cells (Bretscher et al., 2002). It connects actin filaments either directly to membrane proteins such as CD44 (Martin et al 2003), or indirectly via NHERF (EBP50) proteins, which in turn bind membrane proteins by means of two PDZ domains (Bretscher et al. 2000). Among others, Cystic Fibrosis Transmembrane Regulator and NHE-3 are apical transmembrane proteins that interact with those PDZ domains. More importantly, ezrin recruits PKA and thus enables cAMP-mediated regulation of those membrane proteins (Dransfield et al., 1997; Kurashima et al., 1999; Sun et al., 2000), a key pathophysiological event in secretory diarrheas such as in cholera (Kunzelman and Moll, 2002).
Ezrin is synthesized in a “dormant” (inactive) configuration in which the N-terminal domain (N-ERMAND) binds the C-terminal domain (C-ERMAND) mutually blocking their binding capacities to other molecules (Brescher, 1999). Phosphorylation of the T567 as well as interactions with phosphatidylinositol-4,5-bisphosphate (PIP2) open the dormant form, freeing the C-ERMAND to bind actin and the N-ERMAND to bind either NHERF or certain membrane proteins. That configuration is known as the “active” form of ezrin (Fievet et al., 2004). In normal intestinal epithelial cells, ribosomes are concentrated in the perinuclear region, away from the subapical cytoplasm (Kasai et al. 2003). More importantly, available in situ hybridization data on the distribution of ezrin mRNA in enterocytes suggests a diffuse, perhaps supranuclear distribution rather than apical localization of ezrin mRNA (Barilá et al., 1995). In tall, slender cells such as enterocytes, it means that newly synthesized ezrin must travel several microns to reach its final destination under the apical membrane. It has been generally assumed that apical localization of ezrin is due to binding of the active form to its cognate partners. However, many of those partners exist in the basolateral domain: CD44, for example is basolateral in intestinal cells (Gouyer et al., 2001). Actin is extensively present in the basolateral submembrane region as well (Shigeta et al., 2003; Oriolo et al., 2007). Therefore, it is reasonable to speculate that ezrin must be translocated from the point of synthesis to the subapical region in the dormant configuration, and become activated locally, in the immediate vicinity of its normal apical partners. We presented evidence that the dormant form can be recruited by apical intermediate filaments (Wald et al., 2005), but yet in that model, a second step of local apical activation is necessary, because activation of dormant ezrin before reaching the apical cytoskeleton would prevent the recruitment step. Therefore, we wanted to know what kinase, if any, might specifically activate ezrin under the apical domain of epithelial intestinal cells.
Several kinases have been shown to phosphorylate ezrin T567, including Rho kinase (Matsui et al. 1998; Haas et al. 2007), PKCθ (theta) in vitro (Simons et al, 1998), and Akt2 (Shiue et al., 2005). In human skin squamous carcinoma cells (A431), PKCθ has been shown to phosphorylate and participate in the localization of ezrin to microvilli (Stapleton et al., 2002). In addition, phosphoinositides are considered also essential to activate ezrin (Yonemura et al., 2002). Rho and ROCK are active at the basolateral domain in epithelial cells (Van Aelst et al., 2002; Walsh et al. 2001; Takaishi et al., 1997). If Rho activated ezrin in simple epithelia, one would predict a basolateral activation. In fact, Yonemura and coworkers (2002) demonstrated that ezrin activation is independent of Rho in these cells. Likewise, only small amounts of PKCθ may be localized to the tight junctions (Banan et al., 2004). Finally, Akt2 is enriched in the apical membrane of intestinal cells in vivo and in CACO-2 cells (human colon carcinoma) in culture. However, its expression in the intestine is circumscribed to the distal part of the villi, where cells are terminally differentiated (Li et al., 2004). In the intestine, stem cells are localized at the bottom of the crypts, where cell divisions occur, and cells rapidly move toward the villi, where they desquamate. The crypt-villus axis, thus, shows the life cycle and differentiation processes (Ahuja et al., 2006), that is, the deeper in the crypt, the earliest the expression of a protein. Ezrin is expressed and activated in the crypts, albeit at a lower rate than the villus. Expression of Akt2 near the tip of the villus rules out its possible involvement activating ezrin, at least in the earliest stages of enterocyte differentiation. Thus, we looked at other possible kinases as candidates for ezrin activation. It is of notice that T567 is localized within a highly conserved PKC consensus phosphorylation site: RDKYKT*LRQIRQ that contains two of the most common PKC phosphorylation motifs together: (S/T*)X(K/R) and (K/R)XX(S/T*) (Pearson and Kemp, 1991). In addition, at least two PKC isoforms are known to phosphorylate ezrin T567 under different circumstances. PKCα (alpha) in migrating cells (Ng et al., 2001) and, as mentioned above, PKCθ. PKC also is known to phosphorylate NHERF, one of the apical partners of ezrin (Fouassier et al. 2005).
Among other PKC isoforms, atypical PKC (PKC ι/λ, iota/lambda, hereafter referred to as PKCι) has been extensively shown to be a key determinant of apical polarity, conserved in worms, arthropods and mammalians. It is known to be localized to the apical domain of simple epithelial cells (reviewed by Suzuki and Ohno, 2006). However, little is known about its targets. Therefore, this work was undertaken to test the hypothesis that PKCι locally (i.e. apically) phosphorylates ezrin in T567 and that this activation is essential for the apical localization of ezrin in intestinal epithelial cells.
Results
The expression of active PKCι and phosphorylation of T567 in ezrin appear together during the differentiation of intestinal epithelial cells in vivo
In the intestine, cells replicate at the bottom of the crypts and move toward the tip of villus. Therefore, the crypt-to-villus axis can be equated to time of differentiation (Ahuja et al., 2006). To assess the timing of ezrin phosphorylation, we analyzed correlation in the expression of active (pT555) PKCι and the phosphorylation of ezrin in T567 in 36 longitudinal sections of crypts extending to the bottom of the gland. In all cases PKCι was apical (Fig. 1A) and pT555 PKCι signal codistributed with p-T567 ezrin signal within the crypt. In some cases, though, PKCι expression extended slightly deeper (~ 2 – 3 rows of cells) in the crypt than the pT567 ezrin signal (Fig. 1C). In other words, the expression of active PKCι is synchronous (or shortly precedes) with the onset of ezrin phosphorylation (Fig. 1E, E′, arrowhead). Conversely, Akt2, another possible candidate to phosphorylate ezrin T567 (Shiue et al., 2005), was found expressed in the villus, especially around the tips, but the signal was undetectable in the crypts in the same sections (Supplementary Fig. S1). This result does not demonstrate that PKCι is the kinase involved in the phosphorylation of ezrin T567, but it indicates that is expressed at the right time and place in vivo to fulfill that function under physiological conditions in the early stages of differentiation of intestinal cells.
Figure 1. Expression of active (pT555) PKCι in the crypt-villus axis of the small intestine is synchronous with ezrin T567 phosphorylation.

Frozen sections of mouse jejunum were stained with anti-pT555 (active) PKCι antibody (A, green) and anti-pT567 ezrin antibody (C, red), or with the corresponding non-immune IgGs (control, B,D,). DNA was counterstained with DAPI (blue). Panels G, H show phase contrast images of the same sections over imposed to DAPI fluorescence. E, E′ and F show merged signals. E′ is the field boxed in E showed at higher magnification. The images are shown with the bottom of the crypts to the left. Arrow in C, single isolated positive apical domain within a region of negative pT567 signal. Arrowheads show the lowest limit (earliest) of pT567 expression in the crypt. E′ inset: higher magnification of the area blocked in E. Bar, 20:m, E′, 10 μm.
Atypical PKCι can phosphorylate ezrin in T567 in vitro and in cells that lack endogenous ezrin phosphorylation
For in vitro studies, 6xHis-tagged human ezrin was expressed in Sf9 insect cells by means of baculovirus infection. It has been shown that Sf9 lack the machinery to phosphorylate ezrin in T567, and that h-ezrin expressed in these cells is in the dormant configuration (Martin et al., 1997; Wald et al., 2005). H-ezrin was then purified in Ni2+ columns and challenged with recombinant PKCι and 32P-γ-ATP (Fig. 2A) or cold ATP (Fig. 2B). In both cases ezrin was found to be a target of PKCι in vitro. More importantly, anti-p-T567 antibody immunoblot indicated that specifically the T567 site is phosphorylated by PKCι in vitro (Fig. 2B). A similar experiment was performed, but the phosphorylated ezrin and the corresponding non-phosphorylated control were pulled-down with phalloidin-stabilized F-actin. PKCι-mediated phosphorylation increased the ezrin pulled-down by actin (Fig. 2C), indicating that this phosphorylation resulted in the exposure of at least a fraction of the C-ERMAND domains.
Figure 2. PKCι phosphorylates purified ezrin in T567 in vitro and in Sf9 insect cells.
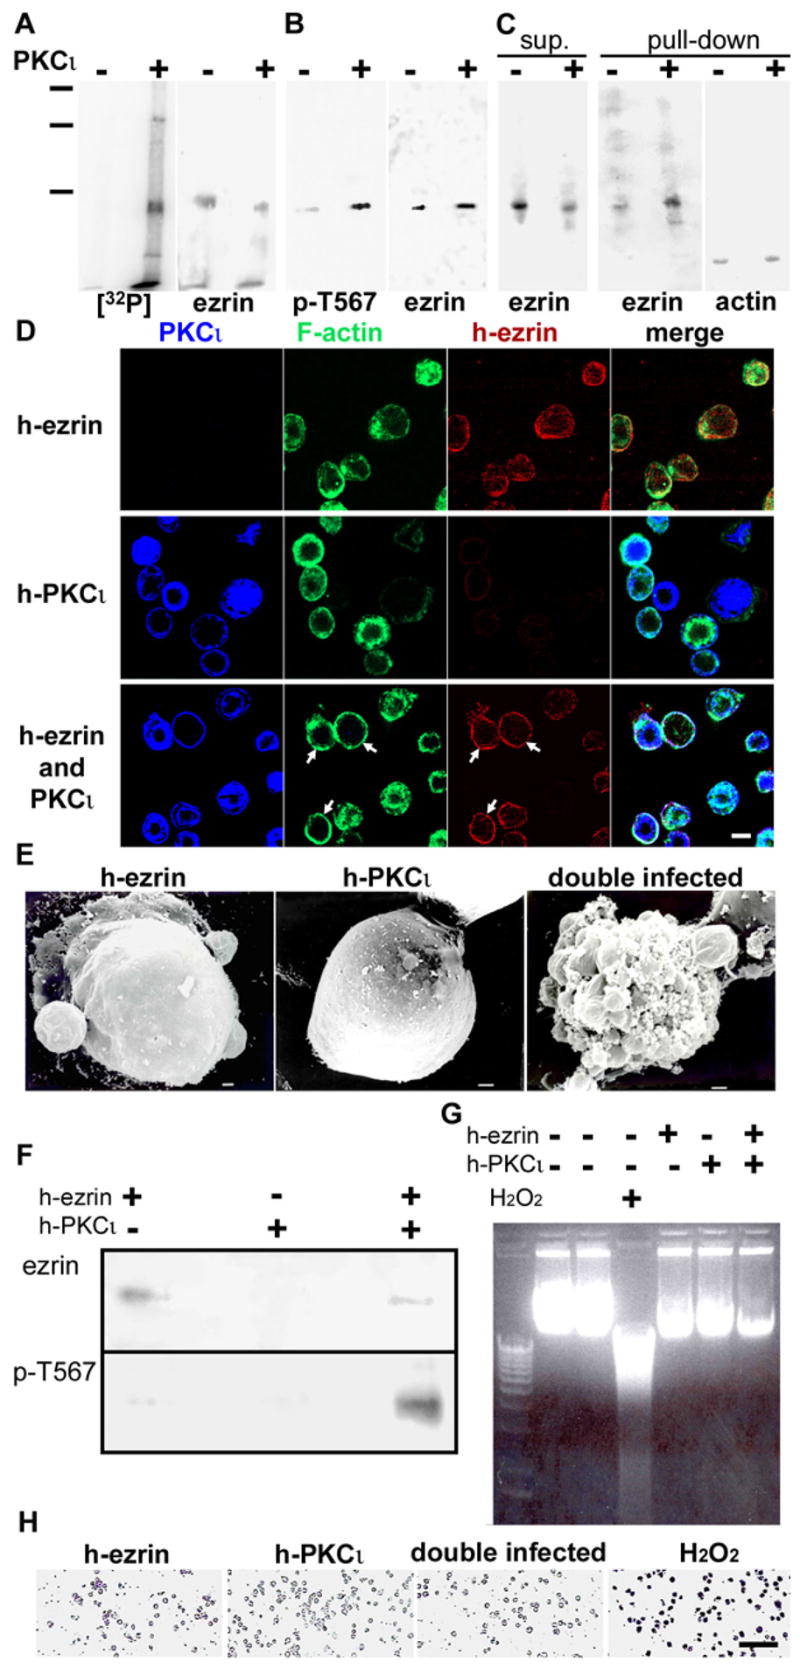
A. 6x-His tagged h-ezrin expressed in Sf9 cells and purified by Ni2+ columns was incubated in the absence (−) or presence of recombinant active PKCι (+) (2:g/ml) and 32P-γ-ATP (5 mCi/ml, 3000 Ci/mmol). After SDS-PAGE and blotting, the membrane was exposed to X-ray film [32P] for 4 hours. After autoradiography, the same membrane was subsequently probed with anti-ezrin antibody and chemiluminiscence (ezrin, 5 sec exposure). B. An identical experiment was performed in the presence of 1 mM cold ATP. The immunoblot was performed sequentially on the same membranes using anti-p-T567 ezrin Ab, then stripped, and reprobed with monoclonal anti-ezrin Ab. C. As in B, identical amounts of purified 6xHis-tagged ezrin purified on Ni2+ columns were phosphorylated (+) or not (−) with PKCι and cold ATP for 30 min at 30°C. The reaction was stopped by dilution and the ezrin solutions were then incubated with Sepharose beads covalently bound to phalloidin-stabilized F-actin for 4 hours. After centrifugation, the supernatants were acetone precipitated and analyzed by immunoblot with anti-ezrin antibody (sup.). The beads were extensively washed, eluted in sample buffer and the eluates analyzed by immunoblot sequentially with anti-ezrin antibody and then with anti-actin antibody on the same membranes. Mol. mass standards: 201, 133, and 85 kDa. D. Sf9 cells were infected with baculovirus expressing h-ezrin, h-PKCι, or double infected with both as indicated at the left. The efficiency of infection was approximately 90% for both viruses. After 48 hours the cells were fixed and labeled for PKCι (blue channel), F-actin (phalloidin, green channel), and h-ezrin (red channel). The images are XY confocal sections at the transnuclear level. Arrows show cells with ezrin and F-actin recruited to the cell surface. E. Scanning electron microscopy of Sf9 cells transduced with ezrin, or PKCι expressing baculovirus, or both. F. Extracts from parallel Sf9 cultures of cells transduced with ezrin, or PKCι-expressing baculovirus, or both were purified through a Ni2+ column, the eluates were separated in SDS-PAGE, blotted and probed sequentially with antibodies against ezrin or phospho-T567 ezrin. G. Genomic DNA from non-infected, single infection or double infected Sf9 was separated in an agarose gel and compared to a ladder of 1.6kbp to 12kbp DNA standards (left lane). A positive control for DNA laddering typical of apoptosis was performed by incubating the cells in10 mM H2O2 overnight. H. Single and double infected Sf9 cultures and a H2O2 positive control done as mentioned above were stained with Apopercentage kit to detect apoptosis. Bars, D, 10:m; E, 1:m; H, 100:m.
To study ezrin phosphorylation by PKCι within an eukaryotic cell, we expressed these proteins in Sf9 cells by means of baculovirus infections. When expressed separately, h-ezrin or h-PKCι showed a diffuse distribution in the cytoplasm, along with the endogenous F-actin (Fig 2D, top two rows). This broad cytoplasmic F-actin distribution was observed even in cells infected with a wild-type baculovirus. Also, empty virus infections showed that under the current infection protocol the overall size and shape of the cells are not substantially changed (Supplementary Fig. S2). When Sf9 cells were co-infected with h-ezrin and h-PKCι, F-actin and h-ezrin redistributed to the cortex (Fig. 2D, arrows). Moreover the free surface of Sf9 cells was relatively smooth under SEM when separately infected with virus expressing either protein separately, but 40% of the cells double infected with both viruses showed abundant protrusions and blebs (Fig. 2E), consistent with the F-actin cortical redistribution (Fig. 2D). Those protrusions resemble the membrane ruffles induced by expression of T567D (“active”) ezrin (Gautreau et al., 2000). In similar experiments, cell extracts were purified in Ni2+ columns, and analyzed by immunoblot. Co-expression of PKCι and ezrin resulted in a substantial increase of pT567 signal (Fig. 2F). A faint band observed with the p-T567 antibody in the absence of PKCι expression is consistent with a low affinity recognition of the non-phosphorylated epitope by this antibody as demonstrated by de-phosphorylation of active ezrin with λ-phosphatase (not shown). It was also noted that the morphology of the cell surface in double infected Sf9 cells was also remarkably reminiscent of the image of apoptotic cells. To rule out this possibility we analyzed the genomic DNA of Sf9 cells non-infected, or infected with viruses expressing separately PKCι or ezrin, or double infected. A positive control for apoptosis was performed by a long incubation in hydrogen peroxide, which caused the well known DNA smearing typical of apoptosis. Evidence of apoptotic degradation of DNA, however, was not found in infected cells (Fig. 2G). Likewise, staining for apoptotic cells was positive for cells incubated in hydrogen peroxide, but not for cells infected with baculovirus expressing the proteins under study (Fig. 2H). Therefore, we concluded that the redistribution of F-actin and ezrin in double infected Sf9 cells and the remodeling of the surface are likely the consequence of PKCι-mediated phosphorylation of ezrin in T567.
Atypical PKCι knock-down abrogates phosphorylation of endogenous ezrin T567 in intestinal CACO-2 cells
The normal endogenous expression of PKC isoforms in CACO-2 (human colon carcinoma) cells was studied in a specialized facility by immunoblot using a standardized panel of anti-phosphoepitope antibodies that recognize the active form of each kinase. The advantage of this study is that the normalized results (Table 1) enable semiquantitative comparisons of the relative amounts of different kinases. Because CACO-2 cells start differentiating and polarizing around day 5 after seeding (Pinto et al., 1983), the study was performed in CACO-2 cell extracts from confluent monolayers 4 and 8 days after seeding. PKCι was found to be the most abundant of all PKC isoforms in these cells, both in the undifferentiated and the early differentiation (8 days) stage. It was nearly 10 fold more abundant than any of the other two PKC isoforms known to be localized to the apical domain (α and ζ). Furthermore, its level of expression increased from the non-differentiated stage to early differentiation, albeit the rate of increase was much more pronounced for PKCα (Table 1). To analyze if PKCι binds to ezrin in vivo we first analyzed if they coimmunoprecipitate (co-ip). Most of endogenous ezrin is incorporated in insoluble scaffolds, and, therefore, not amenable for co-ip. To increase the available soluble ezrin we transfected CACO-2 cells with the full-length ezrin ORF in a pcDNA vector. Non-transfected monolayers were used as controls (Fig. 3A, ezrin transfection -), and the ip was controlled with non-immune mouse IgG (Fig. 3A, ip -). The cells were extracted in 0.5% Triton X-100, and sample of the extracts were analyzed by immunoblot with anti-PKCι antibody (Fig. 3A, input). The eluates of the ezrin ip were analyzed by immunoblot with anti-PKCι antibody, and then, the same membrane was reprobed with anti-ezrin antibody. In cells overexpressing ezrin, PKCι co-immunoprecipitated with ezrin (Fig. 3A, *). Considering the relative abundance and direct interaction with ezrin, PKCι was a good candidate for knockdown studies.
Table 1.
Active PKC isoforms detected in undifferentiated (4 days) and differentiated (8 days) CACO-2 cultures by immunoblot.
| Protein | p-site tested | Cell 4 days | stage 8 days | % increase | % decrease | Polarity |
|---|---|---|---|---|---|---|
| PKC iota (ι) | T555 | 4985 | 6613 | 33 | Apical (a) | |
| PKC alpha (α) | S657 | 156 | 482 | 309 | Apical (b) | |
| PKC beta (β) | T641 | 340 | 190 | 45 | Basolateral (c) | |
| PKC delta (δ) | S645 | 683 | 402 | 42 | Basolateral (d) | |
| PKC epsilon (ε) | S729 | 31 | 30 | Basolateral (e) | ||
| PKC eta (η) | T655 | Not detected | Not detected | |||
| PKC gamma (γ) | T514 | 135 | 419 | 310 | (g) | |
| PKC theta (θ) | S676 | Not detected | Not detected | Tight junction (h) | ||
| PKC theta (θ) | S695 | Not detected | Not detected | |||
| PKC theta (θ) | T538 | Not detected | Not detected | |||
| PKC zeta (ζ) | T410/403 | 534 | 545 | Apical (i) |
Identical amounts of protein from confluent CACO-2 cells at 4 or 8 days after seeding were analyzed by immunoblot using a pre-established panel of specific anti-phospho-epitope antibodies that recognize the active form of each kinase. The facility performing the analysis (Kinexus, Vancouver, Canada) has normalized the arbitrary units, so that the results are comparable, not only for each kinase, but also among different kinases. (a) Suzuki and Ohno, 2006. (b) Song et al. 2001. (c) Padanilam, 2001. (d,e) Song et al. 2001. (g) PKC gamma is normally negative in the intestine and characteristic of neural tissue (Jiang et al.,1995), although present in some colon cancers in low levels which explains its presence in CACO-2 cells (Doi et al., 1994). (h) Although we did not detect it with three different antibodies, Keshavarzian and coworkers (Banan et al., 2004) recently reported a small amount of PKCθ in CACO-2 cells, but colocalizing with claudins at the tight junctions. (i) Padanilam, 2001.
Figure 3. PKCι interacts with ezrin in vivo. Knockdown of PKCι with shRNA.

A. CACO-2 cells were transfected with full-length ezrin cDNA (+) or mock transfected (−), and extracted in 0.5% Triton X-100 after 48 hours. Some extracts were immunoprecipitated (ip) with anti-ezrin MAb (+) or with non-immune IgG (−) as ip control. Samples of the extracts (input) and the eluates of the ip were probed with anti-PKCι antibody (raised in rabbit). The membrane in the middle panel was later reprobed with anti-ezrin antibody (right hand side panel). Mol. mass standards: 85 and 31 kDa. B-K. CACO-2 C2BBe cells were transduced with non-replicating lentivirus particles carrying only a gene for puromycin resistance (empty) or an anti-hPKCι shRNA sequence under a pol III promoter and the same puromycin resistance gene (shRNA). B-C. Confluent monolayers selected in puromycin were extracted in SDS sample buffer at 3, 4, 5, 7 and 10 days of culture. Samples of 30:g protein were loaded in each lane, run in SDS-PAGE, and blotted. The blots were sequentially probed with anti-PKCι (B) and then re-probed with anti-tubulin (C) antibodies. Mol. mass standards: 200, 117, 85, 40, and 31 kDa. D-K. The cells were transduced with empty lentivirus vector (D–G) or with the same vector carrying an anti-PKCι shRNA sequence under a pol III promoter (H–K), and selected in puromycin. The cells were fixed and processed with anti-PKCι (total protein) antibody (D,F,H,J, green), and with anti-pT555 PKCι (active) antibody (E,G, I, K, red), and counterstained with DAPI (blue). D, E, H, I are XY projections of the 5 apical-most confocal sections (~ 2:m thick) comprising the entire apical region. F, G, J, K are 7-voxel thick XZ sections of the entire confocal stack corresponding to the image above, shown with the apical side up. Bars, 10:m.
To knockdown PKCι, five sequences expressing shRNA against human PKCι were obtained from a commercial source in lentivirus vectors that also confer puromycin resistance when transduced into mammalian cells. In preliminary experiments, only one of them was found to be highly effective to knock down PKCι in CACO-2 cells, although all the lentiviruses displayed very high levels of infection (typically >85% of the cells). A subclone of CACO-2 cells, CACO-2 C2BBe was used because of its homogeneity, early and robust polarization and differentiation (Peterson and Mooseker, 1992). The cells were transduced with lentivirus carrying a control empty vector or the same vector with the shRNA sequence under a pol III promoter. All the experiments were performed within the first three passages after transduction and puromycin selection, as the knockdown effect of shRNA was found to fade thereafter, even when the cells were kept in puromycin selection. The knockdown was > 95% effective from days 3 - 7 after plating the cells, and typically ~80% effective at day 10 (Fig. 3B; load controls, 3C). Transduced cells had only negligible rates of apoptosis (<0.1 %, Supplementary Fig. S3), although knock-down cells grew at a slower pace that cells transduced with empty virus (approximately half the doubling time, not shown). For that reason they were routinely passed at twice the seeding density to match the confluence time of the cells transduced with empty virus.
When observed by immunofluorescence in cells transduced with empty vector virus and cultured for 8 days, PKCι (total protein) was found in a continuous apical layer, slightly more concentrated in the region of the tight junctions (Fig. 3D,F). Using an antibody against pT555-PKCι (active form), a similar pattern was observed, but the difference between the signal in the vicinity of tight-junctions and the rest of the apical domain was more evident (Fig. 3E,G), suggesting that active PKCι is more concentrated near cell-cell contacts. Expression of anti-PKCι shRNA resulted in a drastic reduction of the fluorescence signal, compatible with the immunoblot results. The signal away of the tight junctions fell to background levels for both total PKCι protein and pT555 epitope. The small amount of remnant PKCι after the knock down was observed in the vicinity of the tight junction region (Fig. 3 H–K).
In parallel monolayers, we also analyzed the expression of ezrin (total protein) and its phosphorylation in T567 upon knock-down of PKCι. The extent of the reduction in pT567 signal was similar to the extent of decrease in PKCι (Fig. 4A). Interestingly, there was also a decrease in the steady-state level of total ezrin, although not as great as the decrease in pT567 signal (ranging 35 – 55%) (Fig. 4B). The ratios of p-T567 signal/total ezrin signal were used to compare the samples from both sets of cells. In all cases the ratios were lower in the samples from knockdown cells, although they slowly increased with time (Supplementary Fig. S4, A). Ezrin mRNA levels were assessed semiquantitatively by RT- quantitative PCR, and did not show significant differences among cultures transduced with empty virus and cultures expressing anti- PKCι shRNA, (Supplementary Fig. S4, B), suggesting that the differences at the protein level are not transcriptional. The same results were observed at the immunofluorescence level under the same conditions described in Fig. 3. The remnant ezrin protein and the pT567 signals were found localized around the tight junction region (Fig. 4D,F, G–I), precisely where remnant PKCι is found (Fig. 3). Indeed, in XZ confocal reconstructions of PKCι knockdown cells, the apical layer of pT567 was found discontinuous and the remnant signal often clustered in the vicinity of ZO-1 (tight junction) signal (Fig. 4G–I).
Figure 4. Remnant active ezrin after PKCι knock-down localizes near the tight-junction region.
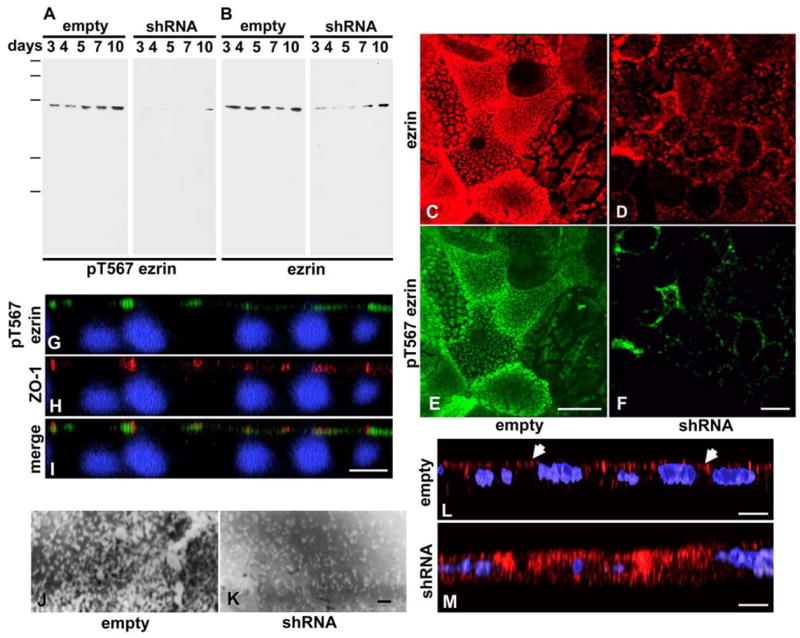
CACO-2 C2BBe cells were transduced with non-replicating lentivirus particles as described in Fig. 3. A–B, confluent monolayers were extracted as described in Fig. 3B,C, and the blots were sequentially processed with anti-pT567 ezrin (A) and the reprobed with anti-ezrin (total protein) (B) antibodies. Molecular mass standards: 200, 117, 85, 40, and 31 kDa. C-M. The cells were transduced with empty lentivirus vector (C,E,J) or with the same vector carrying an anti-PKCι shRNA sequence under a pol III promoter (D,F,G–I, K–M). The cells were fixed and processed with anti-ezrin (total protein) antibody (C,D, red), and anti-pT567 (active) ezrin antibody (E,F, green). C-F are XY projections of the apical domain as described in Fig. 3. G-I. CACO-2 C2Bbe cells expressing anti-PKCι shRNA were grown on filters for 8 days, fixed, and processed with anti-pT567 ezrin (green, G, I) and anti-ZO-1 (red, H, I) antibodies. Also, parallel monolayers grown on glass coverslips were processed for scanning electron microscopy of the apical surface (SEM) (J,K). The images are shown as XZ 3D reconstructions of a confocal stack with the apical side up. L,M. CACO-2 C2BBe cells were transduced with non-replicating lentivirus particles (L) or lentiviral particles expressing anti-PKCι shRNA (M). The cells were selected in puromycin and seeded on Transwell filters. After 6 days, the cells were fixed and processed for immunofluorescence with anti-PKA regulatory subunit IIβ (red) and counterstained with DAPI (blue). The arrows point at cells with apical distribution of PKA regulatory subunit. Bars, C-I, L-M 10:m; J-K, 1:m.
Functional effects of the decrease of active ezrin upon knockdown of PKCι
Ezrin is a scaffolding protein and few functions can be directly associated with its knock down. From the phenotype of ezrin knockout mice, we know that intestinal cells lacking ezrin display shorter and fewer microvilli (Saotome et al., 2004). Also, ezrin is known to recruit the regulatory subunit of PKA to the apical domain (Sun et al., 2000). We tested both functions. When the surface of the cells was analyzed by SEM, CACO-2 C2BBe cells expressing anti-PKCι shRNA showed a decrease in number and size of microvilli (Fig. 4K, shRNA) as compared with control cells under identical culture conditions and infected with mock lentiviral particles (Fig. 4J) consistent with the microvillus phenotype of ezrin-null enterocytes. This result was also confirmed by phalloidin fluorescence that showed disorganization of the apical actin cytoskeleton (Supplementary Fig. S5, A, B and E, F) with little or no effect on the basal actin organization in stress fibers (Supplementary Fig. S5, C, D). In addition, the regulatory subunit II of PKA was localized in 6–day CACO-2 BBE cultures infected with “empty” lentiviral particles. It was found concentrated under the apical domain in most cells (Fig. 4L, arrows). In contrast, in cells depleted in PKCι, it was depolarized in all the cells (Fig. 4M, shRNA), confirming the need for active ezrin to recruit PKA.
Expression of a dominant-negative PKCι mutant (K274W) inhibits phosphorylation of ezrin T567 and a constitutively active PKCι mutant (A120E) results in depolarized phosphorylation of ezrin T567
Dominant negative K274W PKCι and constitutively active A120E PKCι have been described before (Spitaler et al., 2000; Lim et al. 1999). Both mutants were 6xHis and V5-tagged and expressed by transient transfection in cells before day 5 of culture, because the cells become resistant to transfection when they polarize. In transfected cells, V5 signal for both mutants filled the cytoplasm and did not show the peculiar apical localization of the endogenous protein (Figs. 5 and 6, red). In immunoblot experiments (not shown) we assessed the stability of the transfected protein by purifying through Ni2+ columns the protein extracted from monolayers transfected for 1, 2 and 3 days. Immunoblots using the V5 tag antibody showed that the K274W mutant was present for 3 days after transfection, while the A120E mutant was only present for 2 days after transfection. When reprobing the same blots with anti-T555 PKCι antibody, we found that both mutants were phosphorylated in T555, and, therefore, likely to have the appropriate conformation, at 1 day after transfection. Later the ratio of phosphorylated to total protein decreased, and, thus, the kinase was unlikely to display the correct active loop conformation (Newton, 2003). Accordingly, all the transient transfection experiments were designed for readouts 24 hours after transfection.
Figure 5. Transfection with a dominant-negative PKCι mutant abrogates ezrin phosphorylation in T567 in CACO-2 C2BBe cells.
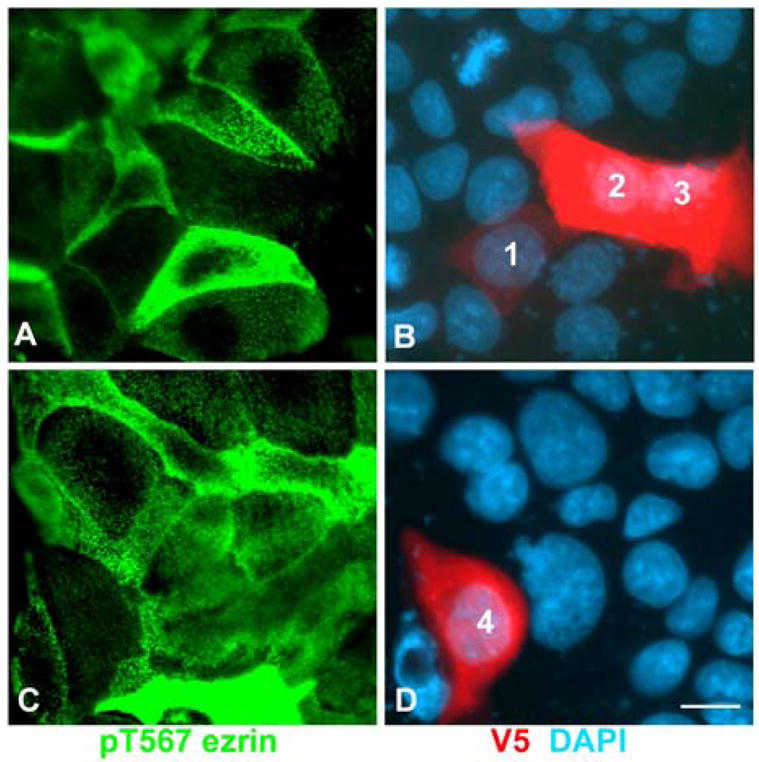
The cells were transfected with a V5-tagged K274W PKCι mutant 4 days after seeding and fixed one day later. The monolayers were processed with anti-pT567 ezrin antibody (green, A, C), and anti-V5 tag antibody (red, B, D), and counterstained with DAPI. Numbers 1–4 label the nuclei of V5-positive cells with various levels of V5 expression. Bar, 10:m.
Figure 6. Transfection with a constitutively active PKCι mutant increases T567-ezrin phosphorylation in CACO-2 cells.

CACO-2 cells (A-H) were transfected under the same conditions described in Fig. 5 with a V5-tagged A120E PKCι mutant, on day 4 and fixed on day 5 (A-D), or transfected on day 2 and fixed on day 3 (E–H) of culture. CACO-2 C2Bbe cells transduced with a lentivirus expressing the shRNA anti-PKCι and selected in puromycin, were transfected with the same mutant on day 4 and fixed on day 5 after plating (I–M).The cells were processed with anti-pT567 ezrin antibody (green), and anti-V5 tag antibody (red), and counterstained with DAPI (blue). The images shown in a XY confocal plane at the apical level (A,B,E), at the basal level (F), or in XZ 3D reconstructions (C,D,G, H,L,M). I-K are projections of the entire confocal stack separated in the individual channels. The red channel was omitted in A, C,H,J, M to show pT567 signal alone. Arrows indicate transfected cells. Arrowheads point at the basal surface in XZ reconstructions. Bars, 10:m.
CACO-2 C2BBe cells at day 5 of culture showed variable levels of pT567-ezrin signal (Fig. 5A,C). Cells transfected with V5- K274W PKCι showed also variable levels of V5 expression. Examples of low (cell 1, Fig. 5B), medium (cell 4, Fig. 5D), or high levels of expression (cells 2 and 3, Fig. 5B) are shown in Fig. 5. In all cases, transfected cells showed levels of pT567-ezrin signal comparable with those of the lowest pT567 signal in non-transfected cells (Fig. 5A,C). Because of the variability in the pT567-ezrin signal in non-transfected cells, a qualitative scoring of 121 transfected cells was conducted. In 81% of transfected cells, pT567 signal was scored as lower than the non-transfected neighbors, while the rest displayed similar levels of signal, because non-transfected cells also had low levels of expression. Not a single case was observed of a transfected cell expressing more pT567 than a neighbor non-transfected cell (Table 2). The difference between the score distribution in control and transfected cells was highly significant (p<0.01, Table 2), reflecting the fact that all the transfected cells had the lowest levels of pT567 signal in the sample. Therefore, expression of K274W PKCι effectively abrogated phosphorylation of ezrin T567.
Table 2.
Cell counts of relative pT567 signal in CACO-2 BBE cells transfected with K274W PKCι
| pT567 signal relative to neighboring cells: | less | similar | more | n |
|---|---|---|---|---|
| Non-transfected cells | 24 | 99 | 34 | 157 |
| % | 15±8 | 63±14 | 22±11 | |
| K274W PKCι-transfected cells | 99 | 22 | 0 | 121 |
| % | 81±19 | 19±19 | 0±0 |
Cells were counted in four independent samples. Untransfected cells were randomly selected by their DAPI fluorescence. Transfected cells were randomly selected by V5-tag fluorescence. For scoring, the majority of neighboring cells was used (e.g. one cell displaying less and two displaying more, was scored “more”). When no majority was observed (e.g. equal numbers of neighboring cells with less and more fluorescence), the cell was not counted. The percentages are given as average ± standard deviations to provide a measure of the variability. The probability of a random difference between both distributions was not calculated from standard deviations, but estimated by ordinal analysis, and was p<0.01 (χ2 = 120.9).
Wild-type CACO-2 cells express less ezrin at day 5 than the C2BBe clone, yet most cells displayed some apical pT567-ezrin signal (Fig. 6A). Therefore, they were used to test the effect of the constitutively active A120E PKCι mutant. Nearly all the cells transfected at day 4 displayed a similar phenotype. The cells appeared as flat disks, disconnected from the filter, and forming a second layer on top of non-transfected cells (Fig. 6C,D). These transfected cells were negative for Apopercentage staining (Supplementary Fig. S6, A–C) and excluded an aldehyde-fixable extracellular marker (Lucifer yellow CH, Supplementary Fig. S6, D–G). More importantly, when falling off the monolayer in the supernatant, they were viable for re-seeding (Supplementary Figure S6, H–I), indicating that they are neither apoptotic nor necrotic, but viable cells that possibly display different adhesive or motility properties than their non-transfected neighbors. Surprisingly, confocal images at the apical surface did not show an increase in pT567 signal (Fig. 6A,C, arrows), although in non-confocal microscopy the cells showed clearly more pT567 signal than their neighbors (not shown, see example in Fig. 6I,J). The pT567 signal was disperse in the cytoplasm and only excluded from the nucleus (Fig. 6C). The effect was milder in the same cells transfected at day 2 and fixed on day 3, presumably because the total expression of ezrin is lower. In fact, many cells did not show any pT567-ezrin signal at all (Fig. 6E). At this early stage, A120E PKCι-transfected cells did not detach from the filter, but approximately 30 % of them showed pT567 signal in the basal sections (Fig. 6F, arrows). In these cells, XZ sections showed also a non-polarized distribution of the mutant PKCι and pT567 signal (Fig. 6G, H, arrowheads) contrasting with the faint but well polarized p-T567 signal in some of their neighbors. As described before (Fig. 4), CACO-2 C2BBe cells expressing anti-PKCι shRNA showed little pT567 signal, mostly localized near the tight junction region (Fig. 6J, non-transfected cells). Transfection with A120E PKCι (Fig. 6I, red) for 24 hours rescued pT567 signal (Fig. 6J, transfected cells). However, as in previous examples of CACO-2 cells, the distribution of this signal was not polarized, largely localized below the nucleus (Fig. 6M, arrowhead) in transfected cells, once again in steep contrast with the highly polarized signal in their non-transfected neighbors. The phenotype of cells detaching from the filter and forming a second layer as described in Fig. 6C–D, was also very frequent in these cells (60–70%) (not shown). In brief, expression of the constitutively active PKCι mutant increased the phosphorylation of pT567 ezrin, but in non-polarized fashion, consistent with the non-polarized distribution of the overexpressed PKCι.
Discussion
Various kinases can phosphorylate ezrin at T567, a site important in ezrin activation, in different cells and even under different stages of differentiation. The results in this work indicate that atypical PKCι is essential to phosphorylate T567 in the early stages of intestinal cell differentiation. Not only it is expressed in crypts in vivo immediately before the onset of ezrin T567 phosphorylation, but it also phosphorylates this site in vitro, in cells that normally do not activate ezrin, and by overexpression of a PKCι constitutively active form. Furthermore, knock-down of endogenous PKCι abrogated most ezrin phosphorylation in T567. More importantly, the apical localization of the kinase is essential for the apical localization of pT567 ezrin, as overexpressed, delocalized kinase, results in diffuse, unpolarized phosphorylation of T567-ezrin.
Work from other groups indicate that the conformational switch of ezrin from the dormant to the active form is a complex phenomenon, in which phosphorylation in T567 is necessary, although not sufficient (Chambers and Brestcher, 2005). The interaction of ezrin with PIP2 has been shown to be also important for ezrin activation (Yonemura et al., 2002). An apical gradient of PIP2 versus basolateral PIP3 seems to play an essential role in epithelial polarization (Martin-Belmonte et al., 2007). Therefore, apical PIP2 is likely to play a synergistic role with T567 phosphorylation for the apical localization of ezrin. On the other hand, the PKCι knock-down data presented here suggests that phosphorylation of T567 is still necessary, because in the absence of the kinase there is an overall decrease in total ezrin apical localization. Moreover, most of the remnant ezrin distributes in the same region where the remnant PKCι is still active (Fig.4). An alternative possibility that cannot be ruled out at this time is that PKCι knockdown might affect the apical PIP2 gradient itself. Although, to our knowledge, there is no published data supporting this possibility, it is worth noticing that the phosphatase and tensin homolog (PTEN), that maintains the apical PIP2 gradient (Martin-Belmonte et al., 2007) is physically associated with the Bazooka (PAR-3) complex, at least in arthropods (von Stein et al., 2005). Such a possibility will certainly deserve further investigation. Finally, it is also important to consider that while the PIP2 gradient seems to be important in general in epithelial cells, it is uncertain that it is active in CACO-2 cells in particular, since these cells show very small amounts of PTEN associated to the membrane (Li et al., 2004).
While the apical localization of ezrin seems to obey to a combination of synergistic mechanisms during the assembly of newly-synthesized ezrin molecules, the final apical concentration may also respond to the stability of active ezrin. In fact, the results in this work must be also understood from the perspective of how stable forms of ezrin accumulate. Little is known about the relative stability of ezrin in its various possible stages (e.g. dormant vs. active). However, published data indicates that once assembled in its normal scaffold, active ezrin is very stable (half life ≫ 1 day) while conditions that destabilize the apical scaffold, such as oxidative stress, cause a steep increase in ezrin degradation mediated by proteasomes (Grune et al., 2002). Therefore, it is likely that the fully activated, membrane and actin-bound ezrin can accumulate, while the intermediaries cannot. Such a scenario would explain the lack of ezrin in the EBP50-null mouse (Morales et al., 2004). In the absence of a conditional PKCι knock-out mouse, we can only speculate that activation at the apical domain possibly stabilizes ezrin and enables the apical ezrin accumulation characteristic of the differentiated brush border. In fact, it is possible that further phosphorylation and accumulation may be mediated by Akt2 in the villi (Shiue et al., 2005). Similar considerations may apply when attempting to explain the distribution of the remnant PKCι after knockdown (Fig. 3H,K). Although no data is available about turnover of PKCι pools in the apical domain, it is known that the Par-3 Par-6 PKCι complex interacts with the Crumbs-PatJ-Pals –ZO-3 complex at the tight junction (reviewed by Suzuki and Ohno, 2006). Whether a different scaffold is used away from the tight junction is unknown, but it is conceivable that the turnover of PKCι is different when the kinase is associated with the tight-junctional complexes.
The phenotype of CACO-2 cells overexpressing A120E (constitutively active) PKCι is fully consistent with previous reports showing “apicalization” of the basolateral domain by overexpressed PKCι. This effect is most likely due to the phosphorylation of other targets such as PAR-1b (Suzuki et al., 2004) and not to the phosphorylation of ezrin. This interpretation is also consistent with our observation that the effect of A120E-PKCι expression changed dramatically with the differentiation of CACO-2 cells. Key to the understanding of these experiments was the fact that overexpressed PKCι appeared homogeneously distributed in the cytoplasm, rather than accumulated under the apical domain. Many otherwise well-localized proteins become delocalized upon overexpression possibly because the compartmentalization mechanisms become overwhelmed, as we have shown before for ezrin overexpression (Wald et al., 2005). For the purpose of this study there are two features of the constitutively active PKCι overexpression phenotype that must be highlighted: (1) That transfected cells did not show an increase in apical pT567-ezrin signal; and (2) that such an increase was observed in the cytoplasm, or at the basal domain. Because of the considerations mentioned above, we cannot assert that the cytoplasmic pT567 signal that characterized A120E-PKCι expressing cells represents fully active ezrin. Yet, our interpretation is that molecules phosphorylated in T567 outside the apical microenvironment cannot become incorporated into the apical scaffold. Conversely, it could be argued that other mechanisms (e.g. apical PIP2) may be the rate-limiting step for apical localization of ezrin. However, neighboring non-transfected cells, which should be at the same stage of differentiation, were capable of exquisitely polarizing their endogenous ezrin (Fig. 6). The fact that transfected cells showed equal or less pT567 at the apical domain than the non-transfected neighbors is more reminiscent of situations where ezrin is sequestered before reaching the apical scaffold, such as keratin overexpression (Wald et al., 2005). Moreover, localization of ezrin at the basal domain, especially in non-differentiated cells (day 3), highlights the possibility of mistargeting of ezrin if the phosphorylation does not occur in the appropriate apical environment. In this regard, Poullet et al. (2001), for example, demonstrated that ezrin N-ERMAND in the open (active) configuration can interact with the focal adhesion kinase, typically a basal protein. These results are also consistent with published data on the distribution of T567D-ezrin-GFP. The ezrin phosphomimetic mutant showed a relatively modest incorporation into the apical domain (as compared with wild type ezrin) and a very robust association with the basolateral domain (i.e. mistargeting) (see Fig. 2 b,b′,f,f′ in Coscoy et al., 2002). The difference between the results from Coscoy et al. and ours is that their data were obtained in the context of overexpression of ezrin or its mutants, while ours show the behavior of endogenous ezrin in early stages of differentiation, when the overall levels of ezrin expression are low. Yet, the distribution of the phosphomimetic ezrin mutant also suggests that phosphorylation of ezrin T567 before it arrives to the apical domain results in heavy mistargeting. In summary, while it is likely that other PKC isoforms (e.g. alpha) or other kinases (e.g. Akt2 at the tip of intestinal villi) may also play a role in ezrin activation, apically localized PKCι is a major player in that mechanism during the early stages of intestinal cell differentiation and polarization. In addition, it seems safe to conclude that any mechanism phosphorylating ezrin T567 must operate exclusively at the apical domain to achieve full apical localization of ezrin.
Materials and methods
Vectors and reagents
Human ezrin and PKCι complete coding sequences were obtained from Open Biosystems, AL and Origene, MD, respectively, and cloned in the pAcHLT-C Baculovirus Transfer Vector (BD Pharmingen, USA). For expression in CACO-2 cells, the same coding sequences and the PKCi mutants (see below) were cloned in the pcDNA3.1/V5-His© TOPO® vector (Invitrogen).The anti-PKCι shRNA (CCGGGCCTGG ATACAATTAA CCATTCTCGA GAATGGTTA ATTGTATCCA GGCTTTTT), in the pLKO.1 lentivirus vector was obtained from Open Biosystems (cat. # TRCN0000006037). Purified active PKCι was obtained from Upstate USA Inc. λ-phosphatase was purchased from New England Biolabs. Actin filaments polymerization was carried out using a non-muscle actin Biochem Kit (Cytoskeleton Inc., USA) according to the manufacturer’s instruction. The resultant F-actin was stabilized by adding 70nM phalloidin to the filament suspension. CNBr-activated Sepharose beads for pull-down were obtained from American Biosciences. 32P-γ-ATP was obtained from Perkin Elmer Life Sciences, Inc (Boston, MA). Lucifer yellow CH was from Molecular Probes. The antibodies used in this study were as follows: mouse monoclonal anti-ezrin (clone 3C12, Abcam); mouse monoclonal anti-phospho-T567 (pT567) ezrin (Becton Dickinson), rabbit monoclonal anti-pT567 ezrin and rabbit monoclonal type-specific anti-Akt2 (Cell Signaling); mouse monoclonal anti-PKCι(Becton Dickinson); rabbit anti-PKCι (Santa Cruz Biotechnology); rabbit anti-phospho-T555 (pT555) PKCι (Biosource Invitrogen); mouse monoclonal anti-baculovirus gp64 (Novagen); rabbit polyclonal antibody anti-PKA IIβ regulatory subunit (Santa Cruz Biotechnology); and mouse monoclonal anti-ZO-1 antibody (Zymed). Secondary antibodies were obtained from Jackson Immunoresearch Laboratories and were all affinity-purified and with no cross-reactivity with IgG of other species.
Cells and baculovirus
CACO-2 cells, and the CACO-2 C2BBe clone were obtained from American Type Culture Collection. The cells were cultured as described before (Salas et al., 1997) in the absence of antibiotics. Sf9 cells were obtained from Becton and Dickinson as part of the Baculogold kit used for baculovirus production.
Lentivirus production and infection
Lentivirus production was done by co-transfecting the shRNA pLKO.1 vector and packaging DNAs plasmids, pMDLg/pRRE#54′, pRSV-Rev and pMDLgVSVG, using calcium phosphate co-precipitation into HEK293T cells. All DNAs were isolated using Qiagen endotoxin free kits. Virus-containing medium was collected every 24 hours for 3 days, centrifuged at 2500 × g for 5 minutes and passed through a 0.45-μm filter. The filtrate was used directly for infection, or virus was concentrated by ultracentrifugation at 50,000 × g for 90 min. The virus titers were estimated by p24 ELISA (PerkinElmer, Wellesley, MA). CACO-2 cells were infected in the presence of polybrene. Transduced cells were selected for at least 2 passages in 10 μg/ml puromycin and used for experiments during the first 3 passages after transduction. The effect of shRNA expression vanished thereafter, although the cells remained puromycin resistant.
Cell extracts and ezrin purification and phosphorylation in vitro
To obtain genomic DNA extract from Sf9 cells, 4-day old cells were harvested in 50mM Tris-HCl, pH 8, 10mM EDTA, 0.5% SDS and 0.5mg/ml proteinase K, and incubated at 55°C for 1 hour. After a 10-minute centrifugation, the supernatant was incubated at 55°C for 1 hour in the presence of 25:g RNase A. After another round of centrifugation, the supernatant containing the genomic DNA was incubated at 70°C for 5 minutes and analyzed by 1% agarose gel in Tris-acetate buffer.
Ezrin extracts and Ni2+ column purifications were as follows: Sf9 cells were seeded at 70% confluency and infected at ~10 MOI with h-ezrin-producing baculovirus. After 3 days, the cells were harvested in RIPA buffer (150 mM NaCl, 50 mM Tris-HCl, 1% NP-40, 0.5% DOC, 0.1% SDS, pH 8.0) supplemented with an antiprotease cocktail (Sigma, cat. # P-8340) and two antiphosphatase cocktails (Calbiochem, cat. # 524624 and 52625). The ezrin protein was purified on Ni2+ columns (ProBond resin; Invitrogen) using the nondenaturing protocol as described before (Wald et al., 2005), with washes in 50 mM imidazole and elution in 350 mM imidazole. The eluates were desalted and concentrated by ultrafiltration in Centricon YM-10 (Millipore). A single band was detected by Western blot using anti-ezrin and anti-His tag antibodies.
For in vitro phosphorylation assay 6xHis- tagged ezrin purified from the Ni+2 column was resuspended in 20mM HEPES, pH 7.4, 0.03% Triton X-100, 5:l PKC lipid activator (#20-133, Upstate, USA), 14mM MgCl2 and, either 250:Ci [(-32P]ATP (DuPont-NEN, USA) or 1mM cold ATP.
It was then incubated for 30 minutes at 30°C with 100 ng active PKCι (Upstate, USA). The samples containing the [γ-32P]ATP were precipitated with 10:l of StrataClean resin beads (Stratagene, USA) and analyzed by SDS-PAGE and PhosphorImager. The samples containing the cold ATP were blotted and analyzed by Western blot using anti-ezrin and anti-T567 antibodies. For immunoblot, CACO-2 cells were extracted in 75 mM Tris buffer, pH 7, supplemented with 1% SDS. The extract was boiled for 2 min, sonicated and protein was measured by Micro Lowry, Peterson’s modification assay (Sigma) to seed equal amounts for PAGE and immunoblot.
Immunoprecipitation of ezrin was performed as described before (Wald et al., 2005), except that an affinity-purified goat anti-mouse IgG (Jackson Immunoresearch Laboratories) was coupled to the Sepharose beads, instead of the primary antibody. A mouse monoclonal anti-ezrin antibody was used to immunoprecipitate.
Site-directed mutagenesis and transient transfection
Mutations of alanine to glutamate, A120E, and lysine to tryptophan, K274W, in PKCι were carried out using the QuickChange mutagenesis kit (Stratagene, USA) according to the manufacturer’s specifications. Both of the mutated full-length cDNAs were cloned in pcDNA™3.1/V5-His TOPO vector (Invitrogen, USA) and confirmed to be correct by PCR sequencing of the full length open reading frame. Transient transfection was performed with ExGene (Fermentas) according to manufacturer’s specifications.
Reverse-transcriptase quantitative PCR
Total RNA was extracted and purified from 2.8 × 10⁶ cells/culture using the RNAqueous kit (Ambion) in triplicates. Reverse-transcription and quantitative PCR were done using the TaqMan® EZ RT-PCR Kit (Applied Biosystems). Ezrin-specific primers spanning more than one exon were used from the Taqman Gene Expression Assay Villin 2/Ezrin (Applied Biosystems). The reactions were run in a Roche LightCycler ® 480 at the Oncogenomics Core Facility, Sylvester Cancer Center, University of Miami, and relative quantification was performed using the calibrator-normalized method taking a sixth culture as calibrator.
Apoptosis assay
Staining for apoptotic cells was done with Apopercentage kit (Biocolor, UK) according to manufacturer’s specifications.
Mice, frozen sections
FVB/n mice were kept according to a protocol approved by the Internal Animal Care Committee and the guidelines of the Public Health Service Policy on Humane Care and Use of Laboratory Animals. Small intestine (jejunum) was removed under deep anesthesia, immediately rinsed with ice-cold phosphate-buffered saline (PBS) containing a cocktail of anti-proteases described above. The intestinal segments were then fixed (Hayashi et al., 1999; see below) perfusing the fixative through the lumen with the yellow tip of a pipette, and kept in fixative for 20 minutes. The intestinal segments were cut in 3 mm-long pieces, embedded in OCT (Sakura Finetek Inc.) and frozen in isopentane at melting point. Frozen sections from mouse small intestine were sectioned at −24°C, mounted on glass slides and kept at the same temperature until the immunofluorescence procedure was performed, usually within 24 h of sectioning.
Immunofluorescence on filters and frozen sections, scanning electron microscopy (SEM), and confocal microscopy
For immunofluorescence, Sf9 cells were seeded directly on glass coverslips, while CACO-2 cells were grown on Transwell filters or glass engraved coverslips (EM Biosciences). Immunofluorescence was performed as described before (Wald et al. 2005), with the following exception: When phospho-epitopes were to be localized, especially phospho-T567 ezrin, tissues and tissue culture cells were fixed in 10% tricholoroacetic acid (TCA), as described by Hayashi et al., 1999. For immunolocalization of antigens in mouse tissues using an antibody raised in mice or obtained from mouse hybridomas, the following technique was used: (1) the tissues were preincubated with Fab fragments of an anti-mouse IgG antibody raised in goats, to quench endogenous mouse IgGs, before all other antibody incubations; (2) the primary monoclonal antibody was preincubated with an approximately equal molar amount of CY3-conjugated Fab fragments of an anti-mouse IgG antibody raised in goats for 30 minutes; (3) this mixture was immunoadsorved onto non-immune mouse IgG covalently bound to Sepharose, and the supernatant was taken; (4) the adsorbed Fab-CY3 anti-mouse bound to the primary antibody was incubated with the tissue along with any other secondary antibody. For this procedure, negative controls were done with CY3-conjugated Fab fragments of the anti-mouse antibody pre-incubated with an excess of non-immune mouse IgG. Finally, all tissue culture cells and tissues were routinely counter-stained for DNA with DAPI. Frozen sections were thawed in PBS and processed as described above for tissue culture cells. Images were obtained in a Leica DMRB microscope (40X, 0.75 NA objective), through a Hamamtsu Orca camera using SlideBook 4.2 software (Intelligent Imaging Innovations Inc.), or in a Leica TCP SP5 spectral confocal microscope (63X water immersion, 1.2 NA objective) from preparations in 30% glycerol, 8.3% polyvynil alcohol under #1.5 coverslips. Confocal images were further analyzed and 3-dimensional (3D) reconstructions performed using SlideBook high-quality 3D rendering on 7-voxel thick cropped image stacks (unless indicated otherwise). Statistics of the effects of K274W PKCι transfection on the distribution of pT567 expression were done by ordinal analysis (retrieved May 30, 2007, from the World Wide Web: http://home.clara.net/sisa/binomial.htm) and the significance analyzed by χ2 distribution.
For scanning electron microscopy, the cells were grown on glass coverslips, fixed in 3 % glutaraldehyde in 0.1 M sodium phosphate buffer, pH 7.8, and counterstained in 2 % OsO4. The cells were then dehydrated in ethanol of increasing graduation, critical-point dried and coated with gold. The samples were photographed with a Jeol 35 CF scanning electron microscope at 15 kV.
Supplementary Material
Acknowledgments
We are grateful to Ms. Yolanda Figueroa for providing excellent technical support. Supported by NIDDK grants RO1DK057805 and R01DK076652. Andrea S. Oriolo was a recipient of a scholarship from DOD training grant 4-49497-LS-HSI, and Flavia A. Wald was a recipient of a Crohn’s and Colitis Foundation of America post-doctoral award.
Abbreviations
- C-ERMAND
C-terminal domain of ezrin binds actin
- Ip
immunoprecipitation
- N-ERMAND
N-terminal domain of ezrin binds NHERF
- PIP2
phosphatidylinositol-4,5-bisphosphate
- PKA
protein kinase A
- PKC
protein kinase C
- PTEN
phosphatase and tensin homolog
References
- Ahuja V, Dieckgraefe BK, Anant S. Molecular biology of the small intestine. Curr Opin Gastroenterol. 2006;22(2):90–94. doi: 10.1097/01.mog.0000203865.25384.65. [DOI] [PubMed] [Google Scholar]
- Banan A, Zhang LJ, Shaikh M, Fields JZ, Farhadi A, Keshavarzian A. Theta-isoform of PKC is required for alterations in cytoskeletal dynamics and barrier permeability in intestinal epithelium: a novel function for PKC-theta. Am J Physiol - Cell Physiol. 2004;287(1):C218–C234. doi: 10.1152/ajpcell.00575.2003. [DOI] [PubMed] [Google Scholar]
- Barilá D, Murgia C, Nobili F, Perozzi G. Transcriptional regulation of the ezrin gene during rat intestinal development and epithelial differentiation. Biochim Biophys Acta. 1995;1263:133–140. doi: 10.1016/0167-4781(95)00090-4. [DOI] [PubMed] [Google Scholar]
- Bretscher A. Regulation of cortical structure by the ezrin-radixin-moesin protein family. Curr Op Cell Biology. 1999;11:109–116. doi: 10.1016/s0955-0674(99)80013-1. [DOI] [PubMed] [Google Scholar]
- Bretscher A, Chambers D, Nguyen R, Reczek D. ERM-Merlin and EBP50 protein families in plasma membrane organization and function. Annu Rev Cell Dev Biol. 2000;16:113–143. doi: 10.1146/annurev.cellbio.16.1.113. [DOI] [PubMed] [Google Scholar]
- Bretscher A, Edwards K, Fehon RG. ERM proteins and merlin: integrators at the cell cortex. Nat Rev Mol Cell Biol. 2002;3(8):586–599. doi: 10.1038/nrm882. [DOI] [PubMed] [Google Scholar]
- Chambers DN, Bretscher A. Ezrin mutants affecting dimerization and activation. Biochemistry. 2005;44(10):3926–3932. doi: 10.1021/bi0480382. [DOI] [PubMed] [Google Scholar]
- Coscoy S, Waharte F, Gautreau A, Martin M, Louvard D, Mangeat P, Arpin M, Amblard F. Molecular analysis of microscopic ezrin dynamics by two-photon FRAP. Proc Natl Acad Sci U S A. 2002;99(20):12813–12818. doi: 10.1073/pnas.192084599. [DOI] [PMC free article] [PubMed] [Google Scholar]
- Doi S, Goldstein D, Hug H, Weinstein IB. Expression of multiple isoforms of protein kinase C in normal human colon mucosa and colon tumors and decreased levels of protein kinase C beta and eta mRNA s in the tumors. Mol Carcinog. 1994;11(4):197–203. doi: 10.1002/mc.2940110405. [DOI] [PubMed] [Google Scholar]
- Dransfield DT, Bradford AJ, Smith J, Martin M, Roy C, Mangeat PH, Goldenring JR. Ezrin is a cyclic AMP-dependent protein kinase anchoring protein. EMBO J. 1997;16(1):35–43. doi: 10.1093/emboj/16.1.35. [DOI] [PMC free article] [PubMed] [Google Scholar]
- Fievet BT, Gautreau A, Roy C, Del Maestro L, Mangeat P, Louvard D, Arpin M. Phosphoinositide binding and phosphorylation act sequentially in the activation mechanism of ezrin. J Cell Biol. 2004;164(5):653–659. doi: 10.1083/jcb.200307032. [DOI] [PMC free article] [PubMed] [Google Scholar]
- Fouassier L, Nichols MT, Gidey E, McWilliams RR, Robin H, Finnigan C, Howell KE, Housset C, Doctor RB. Protein kinase C regulates the phosphorylation and oligomerization of ERM binding phosphoprotein 50. Exp Cell Res. 2005;306:264–273. doi: 10.1016/j.yexcr.2005.02.011. [DOI] [PubMed] [Google Scholar]
- Gautreau A, Louvard D, Arpin M. Morphogenic effects of ezrin require a phosphorylation-induced transition from oligomers to monomers at the plasma membrane. J Cell Biol. 2000;150(1):193–203. doi: 10.1083/jcb.150.1.193. [DOI] [PMC free article] [PubMed] [Google Scholar]
- Gouyer V, Leteurtre E, Delmotte P, Steelant WF, Krzewinski-Recchi MA, Zanetta JP, Lesuffleur T, Trugnan G, Delannoy P, Huet G. Differential effect of GalNAc alpha-O-bn on intracellular trafficking in enterocytic HT-29 and Caco-2 cells: correlation with the glycosyltransferase expression pattern. J Cell Sci. 2001;114(Pt 8):1455–1471. doi: 10.1242/jcs.114.8.1455. [DOI] [PubMed] [Google Scholar]
- Grune T, Reinheckel T, North JA, Li R, Bescos PB, Shringarpure R, Davies KJ. Ezrin turnover and cell shape changes catalyzed by proteasome in oxidatively stressed cells. FASEB Journal. 2002;16(12):1602–1610. doi: 10.1096/fj.02-0015com. [DOI] [PubMed] [Google Scholar]
- Haas MA, Vickers JC, Dickson TC. Rho kinase activates ezrin-radixin-moesin (ERM) proteins and mediates their function in cortical neuron growth, morphology and motility in vitro. J Neurosci Res. 2007;85(1):34–46. doi: 10.1002/jnr.21102. [DOI] [PubMed] [Google Scholar]
- Hayashi K, Yonemura S, Matsui T, Tsukita S. Immunofluorescence detection of ezrin/radixin/moesin (ERM) proteins with their carboxyl-terminal threonine phosphorylated in cultured cells and tissues. J Cell Sci. 1999;112(Pt 8):1149–1158. doi: 10.1242/jcs.112.8.1149. [DOI] [PubMed] [Google Scholar]
- Jiang YH, Aukema HM, Davidson LA, Lupton JR, Chapkin RS. Localization of protein kinase C isozymes in rat colon. Cell Growth Differ. 1995;6(11):1381–1386. [PubMed] [Google Scholar]
- Kasai H, Nadano D, Hidaka E, Higuchi K, Kawakubo M, Sato TA, Nakayama J. Differential expression of ribosomal proteins in human normal and neoplastic colorectum. J Histochem Cytochem. 2003;51(5):567–574. doi: 10.1177/002215540305100502. [DOI] [PubMed] [Google Scholar]
- Kunzelmann K, Mall M. Electrolyte transport in the mammalian colon: mechanisms and implications for disease. Physiological Reviews. 2002;82(1):245–289. doi: 10.1152/physrev.00026.2001. [DOI] [PubMed] [Google Scholar]
- Kurashima K, D’Souza S, Szaszi K, Ramjeesingh R, Orlowski J, Grinstein S. The apical Na(+)/H(+) exchanger isoform NHE3 is regulated by the actin cytoskeleton. J Biol Chem. 1999;274(42):29843–298499. doi: 10.1074/jbc.274.42.29843. [DOI] [PubMed] [Google Scholar]
- Li X, Leu S, Cheong A, Zhang H, Baibakov B, Shih C, Birnbaum MJ, Donowitz M. Akt2, phosphatidylinositol 3-kinase, and PTEN are in lipid rafts of intestinal cells: role in absorption and differentiation. Gastroenterology. 2004;126(1):122–135. doi: 10.1053/j.gastro.2003.10.061. [DOI] [PubMed] [Google Scholar]
- Lim YP, Low BC, Lim J, Wong ES, Guy GR. Association of atypical protein kinase C isotypes with the docker protein FRS2 in fibroblast growth factor signaling. J Biol Chem. 1999;274(27):19025–19034. doi: 10.1074/jbc.274.27.19025. [DOI] [PubMed] [Google Scholar]
- Martin M, Roy C, Montcourrier P, Sahuquet A, Mangeat P. Three determinants in ezrin are responsible for cell extension activity. Mol Biol of the Cell. 1997;8(8):1543–1557. doi: 10.1091/mbc.8.8.1543. [DOI] [PMC free article] [PubMed] [Google Scholar]
- Martin TA, Harrison G, Mansel RE, Jiang WG. The role of the CD44/ezrin complex in cancer metastasis. Crit Rev Oncol Hematol. 2003;46(2):165–86. doi: 10.1016/s1040-8428(02)00172-5. [DOI] [PubMed] [Google Scholar]
- Martin-Belmonte F, Gassama A, Datta A, Yu W, Rescher U, Gerke V, Mostov K. PTEN-mediated apical segregation of phosphoinositides controls epithelial morphogenesis through Cdc42. Cell. 2007;128(2):383–397. doi: 10.1016/j.cell.2006.11.051. [DOI] [PMC free article] [PubMed] [Google Scholar]
- Matsui T, Maeda M, Doi Y, Yonemura S, Amano M, Kaibuchi K, Tsukita S, Tsukita S. Rho-kinase phosphorylates COOH-terminal threonines of ezrin/radixin/moesin (ERM) proteins and regulates their head-to-tail association. J Cell Biol. 1998;140(3):647–657. doi: 10.1083/jcb.140.3.647. [DOI] [PMC free article] [PubMed] [Google Scholar]
- Morales FC, Takahashi Y, Kreimann EL, Georgescu MM. Ezrin–radixin–moesin (ERM)-binding phosphoprotein 50 organizes ERM proteins at the apical membrane of polarized epithelia. Proc Natl Acad Sci USA. 2004;101(51):17705–17710. doi: 10.1073/pnas.0407974101. [DOI] [PMC free article] [PubMed] [Google Scholar]
- Nelson WJ. Adaptation of core mechanisms to generate cell polarity. Nature. 2003;422:766–774. doi: 10.1038/nature01602. [DOI] [PMC free article] [PubMed] [Google Scholar]
- Newton AC. Regulation of the ABC kinases by phosphorylation: protein kinase C as a paradigm. Biochem J. 2003;370:361–371. doi: 10.1042/BJ20021626. [DOI] [PMC free article] [PubMed] [Google Scholar]
- Ng T, Parsons M, Hughes WE, Monypenny J, Zicha D, Gautreau A, Arpin M, Gschmeissner S, Verveer PJ, Bastiaens PI, Parker PJ. Ezrin is a downstream effector of trafficking PKC-integrin complexes involved in the control of cell motility. EMBO J. 2001;20(11):2723–2741. doi: 10.1093/emboj/20.11.2723. [DOI] [PMC free article] [PubMed] [Google Scholar]
- Oriolo AS, Wald FA, Ramsauer VP, Salas PJ. Intermediate filaments: A role in epithelial polarity. Exp Cell Res. 2007;313:2255–2264. doi: 10.1016/j.yexcr.2007.02.030. [DOI] [PMC free article] [PubMed] [Google Scholar]
- Padanilam BJ. Induction and subcellular localization of protein kinase C isozymes following renal ischemia. Kidney Int. 2001;59:1789–1797. doi: 10.1046/j.1523-1755.2001.0590051789.x. [DOI] [PubMed] [Google Scholar]
- Pearson RB, Kemp BE. Protein kinase phosphorylation site sequences and consensus specificity motifs: tabulations. Meth Enzymol. 1991;200:62–81. doi: 10.1016/0076-6879(91)00127-i. [DOI] [PubMed] [Google Scholar]
- Peterson MD, Mooseker MS. Characterization of the enterocyte-like brush border cytoskeleton of the C2BBe clones of the human intestinal cell line, Caco-2. J Cell Sci. 1992;102(3):581–600. doi: 10.1242/jcs.102.3.581. [DOI] [PubMed] [Google Scholar]
- Pinto M, Robine-Leon S, Appay D, Kedinger M, Triadou N, Dussaulx E, Lacroix B, Simon-Assmann P, Haffen K, Fogh J, Zweibaum A. Enterocyte-like differentiation and polarization of the human colon carcinoma cell line Caco-2 in culture. Biol Cell. 1983;47:323–330. [Google Scholar]
- Poullet P, Gautreau A, Kadare G, Girault JA, Louvard D, Arpin M. Ezrin interacts with focal adhesion kinase and induces its activation independently of cell-matrix adhesion. J Biol Chem. 2001;276(40):37686–37691. doi: 10.1074/jbc.M106175200. [DOI] [PubMed] [Google Scholar]
- Salas PJI, Rodriguez ML, Viciana A, Vega-Salas DE, Hauri HP. The apical sub-membrane cytoskeleton participates in the organization of the apical pole in epithelial cells. J Cell Biology. 1997;137:359–375. doi: 10.1083/jcb.137.2.359. [DOI] [PMC free article] [PubMed] [Google Scholar]
- Saotome I, Curto M, McClatchey AI. Ezrin is essential for epithelial organization and villus morphogenesis in the developing intestine. Dev Cell. 2004;6:855–864. doi: 10.1016/j.devcel.2004.05.007. [DOI] [PubMed] [Google Scholar]
- Shigeta M, Sanzen N, Ozawa N, Gu J, Hasegawa H, Sekiguchi K. CD151 regulates epithelial cell-cell adhesion through PKC- and CDC42-dependent actin cytoskeletal organization. J Cell Biol. 2003;163(1):165–176. doi: 10.1083/jcb.200301075. [DOI] [PMC free article] [PubMed] [Google Scholar]
- Shiue H, Musch MW, Wang Y, Chang EB, Turner JR. Akt2 phosphorylates ezrin to trigger NHE3 translocation and activation. J Biol Chem. 2005;280:1688–1695. doi: 10.1074/jbc.M409471200. [DOI] [PMC free article] [PubMed] [Google Scholar]
- Simons PC, Pietromonaco SF, Reczek D, Bretscher A, Elias L. C-terminal threonine phosphorylation activates ERM proteins to link the cell’s cortical lipid bilayer to the cytoskeleton. Biochem Biophys Res Commun. 1998;253(3):561–565. doi: 10.1006/bbrc.1998.9823. [DOI] [PubMed] [Google Scholar]
- Song JC, Hanson CM, Tsai V, Farokhzad OC, Lotz M, Matthews JB. Regulation of epithelial transport and barrier function by distinct protein kinase C isoforms. Am J Physiol Cell Physiol. 2001;281(2):C649–C661. doi: 10.1152/ajpcell.2001.281.2.C649. [DOI] [PubMed] [Google Scholar]
- Spitaler M, Villunger A, Grunicke H, Uberall F. Unique structural and functional properties of the ATP-binding domain of atypical protein kinase C-iota. J Biol Chem. 2000;275(43):33289–33296. doi: 10.1074/jbc.M002742200. [DOI] [PubMed] [Google Scholar]
- Stapleton G, Malliri A, Ozanne BW. Downregulated AP-1 activity is associated with inhibition of Protein-Kinase-C-dependent CD44 and ezrin localisation and upregulation of PKC theta in A431 cells. J Cell Sci. 2002;115(Pt 13):2713–2724. doi: 10.1242/jcs.115.13.2713. [DOI] [PubMed] [Google Scholar]
- Sun F, Hug MJ, Bradbury NA, Frizzell RA. Protein kinase A associates with cystic fibrosis transmembrane conductance regulator via an interaction with ezrin. J Biol Chem. 2000;275(19):14360–14366. doi: 10.1074/jbc.275.19.14360. [DOI] [PubMed] [Google Scholar]
- Suzuki A, Ohno S. The PAR-aPKC system: lessons in polarity. J Cell Sci. 2006;119(6):979–987. doi: 10.1242/jcs.02898. [DOI] [PubMed] [Google Scholar]
- Suzuki A, Hirata M, Kamimura K, Maniwa R, Yamanaka T, Mizuno K, Kishikawa M, Hirose H, Amano Y, Izumi N, Miwa Y, Ohno S. aPKC acts upstream of PAR-1b in both the establishment and maintenance of mammalian epithelial polarity. Curr Biol. 2004;14(16):1425–1435. doi: 10.1016/j.cub.2004.08.021. [DOI] [PubMed] [Google Scholar]
- Takaishi K, Sasaki T, Kotani H, Nishioka H, Takai Y. Regulation of cell-cell adhesion by rac and Rho small G proteins in MDCK cells. J Cell Biol. 1997;139(4):1047–1059. doi: 10.1083/jcb.139.4.1047. [DOI] [PMC free article] [PubMed] [Google Scholar]
- Van Aelst L, Symons M. Role of Rho family GTPases in epithelial morphogenesis. Genes & Development. 2002;16(9):1032–1054. doi: 10.1101/gad.978802. [DOI] [PubMed] [Google Scholar]
- von Stein W, Ramrath A, Grimm A, Muller-Borg M, Wodarz A. Direct association of Bazooka/PAR-3 with the lipid phosphatase PTEN reveals a link between the PAR/aPKC complex and phosphoinositide signaling. Development. 2005;132(7):1675–1686. doi: 10.1242/dev.01720. [DOI] [PubMed] [Google Scholar]
- Wald FA, Oriolo AS, Casanova ML, Salas PJI. Intermediate filaments interact with dormant ezrin in intestinal epithelial cells. Mol Biol Cell. 2005;16:4096–4107. doi: 10.1091/mbc.E05-03-0242. [DOI] [PMC free article] [PubMed] [Google Scholar]
- Walsh SV, Hopkins AM, Chen J, Narumiya S, Parkos CA, Nusrat A. Rho kinase regulates tight junction function and is necessary for tight junction assembly in polarized intestinal epithelia. Gastroenterology. 2001;121(3):566–579. doi: 10.1053/gast.2001.27060. [DOI] [PubMed] [Google Scholar]
- Yonemura IS, Matsui T, Tsukita S, Tsukita S. Rho-dependent and -independent activation mechanisms of ezrin/radixin/moesin proteins: an essential role for polyphosphoinositides in vivo. J Cell Sci. 2002;115(12):2569–2580. doi: 10.1242/jcs.115.12.2569. [DOI] [PubMed] [Google Scholar]
- Zegers MM, O’Brien LE, Yu W, Datta A, Mostov KE. Epithelial polarity and tubulogenesis in vitro. Trends Cell Biol. 2003;13:169–176. doi: 10.1016/s0962-8924(03)00036-9. [DOI] [PubMed] [Google Scholar]
Associated Data
This section collects any data citations, data availability statements, or supplementary materials included in this article.