Abstract
Co-registered optical coherence tomography (OCT) and video microscopy of the rat somatosensory cortex were acquired simultaneously through a thinned skull during forepaw electrical stimulation. Fractional signal change measured by OCT revealed a functional signal time course corresponding to the hemodynamic signal measurement made with video microscopy. OCT can provide high-resolution, cross-sectional images of functional neurovascular activation and may offer a new tool for basic neuroscience research in the important rat cerebral cortex model.
Several technologies have been used to probe neuronal response to external stimuli noninvasively. Hemodynamic techniques, including positron emission tomography, single-photon emission computed tomography, and functional magnetic resonance imaging, are useful for visualizing spatial localization of neural activity, but they have limited temporal resolution. In contrast, electrophysiological techniques, such as electroencephalography, can measure millisecond time-scale neural responses, but these have limited spatial resolution. Optical methods offer both high spatial and temporal resolutions, and they are promising for full-field measurements of hemodynamic, metabolic, and neuronal activity in vivo. Optical methods provide highly sensitive measures of neuronal and vascular responses to brain activation, both invasively1 and noninvasively,2 and are used extensively for studying the neurovascular relationship.3,4
Most optical methods do not provide depth resolution of functional response. To overcome this, multi-photon fluorescence microscopy has been used for functional neuronal imaging.5 In addition, new methods such as laminar optical tomography are being developed.6 Optical coherence tomography (OCT) is promising for high-resolution, depth-resolved imaging in turbid tissues such as the cerebral cortex. OCT generates real-time, cross-sectional images of tissue architecture using scattered light, without the need for exogenous dyes to enhance contrast.7 Furthermore, OCT is very sensitive to small, scattered signals over several orders of magnitude in dynamic range and can have enhanced depth when compared with multiphoton microscopy. Maheswari et al. demonstrated depth-resolved stimulus-specific profiles of slow processes during functional activation in the cat visual cortex.8 Lazebnik et al. recorded scattering changes from action potential propagation in the sea slug abdominal ganglion.9 Other groups have explored low-coherence interferometry for measuring functional retinal activation10,11 and nerve axon displacement.12,13
The rat somatosensory cortex is an important model in neuroscience research and has been extensively studied using optical methods.4,5,8 This Letter demonstrates OCT for high-resolution, cross-sectional measurement of functional hemodynamic response to electrical stimulation in the rat cortex model. OCT is correlated with simultaneous video microscopy to compare OCT with the extensively studied intrinsic optical signal time course.
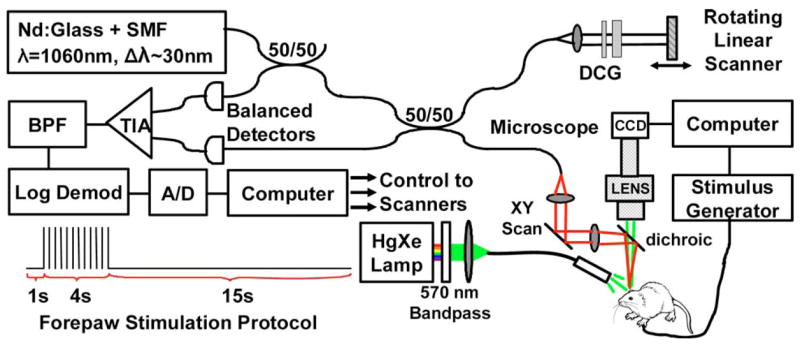
Figure 1 shows a schematic of the combined OCT and video microscopy system. The time-domain OCT engine consisted of a balanced interferometer; a rapid, 1140 Hz, linearly scanning reference delay line; and logarithmic demodulation. The image acquisition rate was 3 Hz, and each frame had 380 × 1000 pixels over 3 mm transverse by 2.8 mm depth. The light source was a Nd:glass femtosecond laser centered at 1060 nm wavelength that was spectrally broadened in a single-mode fiber (HI-1060) to a bandwidth of 30 nm. The bandwidth was deliberately reduced when compared with previous studies with this light source to provide a larger resolution voxel for enhanced integration of small signals.14 The measured axial resolution was ~18 μm in air, or ~13 μm in tissue. The OCT microscope included a collimating lens followed by a pair of galvanometer scanners. The scanned OCT beam was focused by a near-infrared achromat lens (f=60 mm) and directed onto the specimen by a dichroic hot mirror. The microscope spot size was ~36 μm (1/e2 waist diameter). The demodulated OCT signal was recorded with a 12 bit, 5 MHz A/D converter.
Fig. 1.

(Color online) Schematic of optical coherence tomography (OCT) and video microscopy system. DCG, dispersion-compensating glass; TIA, transimpedance amplifier; BPF, bandpass filter. Also shown is the forepaw stimulation protocol.
The video microscope system has been described previously.15 For these studies, the Hg:X lamp illumination was spectrally filtered to a narrow band at 570 nm; an isosbestic point for hemoglobin absorption. Therefore, cortical reflectivity at 570 nm measures total hemoglobin, which is proportional to total blood volume if hematocrit is assumed constant. Reflected visible light from the cortex was imaged with a high-sensitivity CCD, which was read by a second computer. The signals acquired included the stimulus drive itself, a separate trial initiation pulse that denotes the beginning of a stimulus sequence, the CCD camera exposure, the OCT image frame synchronization, and a blood pressure trace for animal monitoring.
Protocols were approved by the animal care committees at the Massachusetts Institute of Technology and the Massachusetts General Hospital. Rats were anesthetized with isoflurane and immobilized stereotactically before beginning the cranial preparation. An area of skull overlying the primary somatosensory cortex on the contralateral side of the stimulated forepaw was thinned with a dental burr until transparent. A barrier of petroleum jelly was built around the thinned skull and filled with mineral oil to reduce surface reflection. Forepaw stimulation was performed using 20 s stimulation blocks, as shown in Fig. 1 (inset). Each block consisted of a 1 s prestimulus period, followed by 4 s of stimulation with ~1.8 mA pulses at 3 Hz. The stimulus amplitude was chosen to be just below the animal’s twitch threshold, as determined by palpation. A 15 s poststimulus period was used to allow full recovery to baseline. The stimulus block was repeated 60 times during data acquisition over a 20 min period. Prior to data processing, digitized OCT images were converted from log to linear. Block average OCT signals were then computed to reduce the effects of physiological noise in the measurements. Each time point of the resulting 20 s experiment block consisted of an average of 60 independent samples.
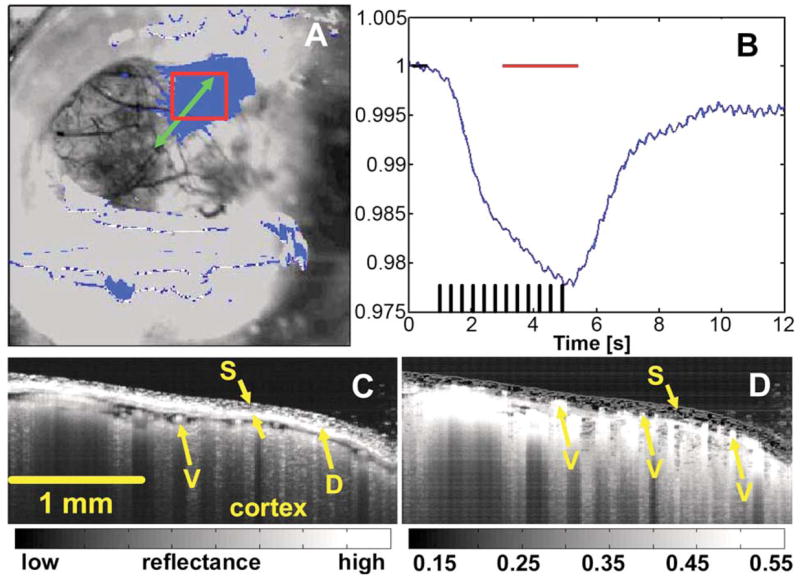
Figure 2 shows the co-localization of the OCT scan to the region of functional activation. The functional signal was computed as a ratio of the cortical reflectance at each time point to the mean reflectance in the prestimulus period and shows the percent signal change from baseline. Figure 2A shows an overlay of the functional signal taken at its peak amplitude over the structural image of the cortex. The precise OCT scan location is shown over the region of activation. The corresponding temporal trace for functional activation in the boxed region of Fig. 2A is shown in Fig. 2B. As expected, the cortical reflectance shows a decrease of ~2–3%, corresponding to increased absorption from blood volume and total hemoglobin increase in the region of activation. The mean OCT structural image during the prestimulus period is shown in Fig. 2C. OCT enables the precise measurement of skull thickness and identification of cortical surface vessels and meningeal layers separating the skull from the underlying cortex. Figure 2D shows an image of the standard deviation of the OCT signal divided by the mean across the total block averaged data set. This form of display highlights the very low signal variation in the immobilized skull when compared with the cortex and smaller vessels located above the dura.
Fig. 2.

(Color online) Precise registration of OCT imaging to the region of functional activation. The OCT scan is directed in the region of interest measured with video microscopy (A, B). Horizontal bars in B mark the activated and baseline time windows used to generate the functional map in A. Structural OCT imaging (C) visualizes the skull (S), surface vasculature (V), and meningeal layers, including the dura mater (D). Percent variation maps extracted from the multiple trial data set reveal smaller vessels above the dura, while highlighting the low signal fluctuation in the skull compared when with the cortex.
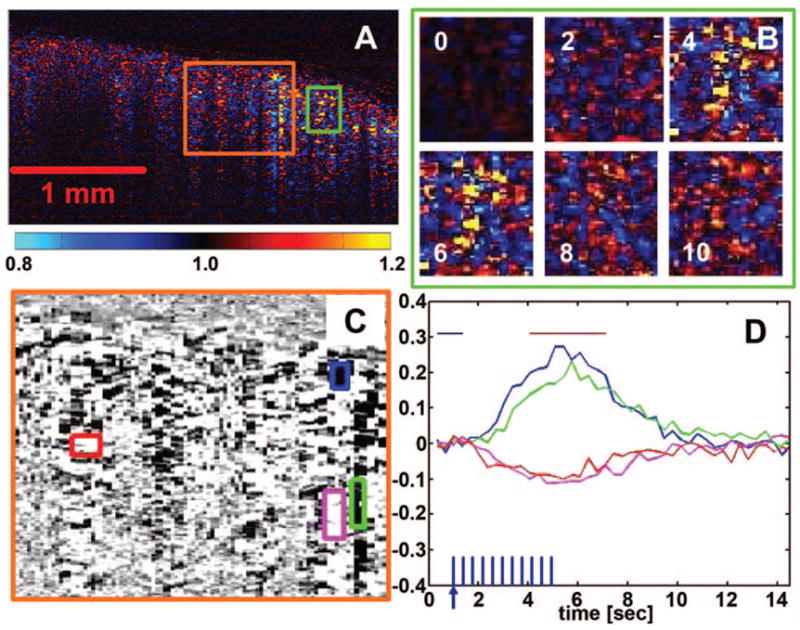
The OCT functional response measurements are shown in Fig. 3. As with the video microscopy, a fractional change map was computed by normalizing all time points to the baseline prestimulus period. The functional image from the time window around the peak of maximal activation is shown in Fig. 3A. Both positive and negative signal changes are present. Warm colors at the red-and-yellow end of the color map represent positive signal changes, while cool colors at the blue end represent negative changes. The temporal sequence of images during activation reveals the persistence of highly localized, distinct “hot spots” of cortical activation. Figure 3B shows a magnified view of the temporal sequence for the corresponding boxed region in Fig. 3A. Time point zero represents the baseline. At 4 and 6 s, bright areas of signal change emerge and subsequently return to baseline after 8 and 10 s. Note that there is some baseline drift due to physiological noise. Figure 3C shows a second magnified region of the functional OCT image. The color map has been switched to gray scale, with positive signal change in black, to allow color-coded delineations of regions of interest. The size and shape of the boxed areas for time-course analysis were selected based upon visual perception of the boundaries of the localized change. The corresponding temporal sequences of activation for the boxed regions in Fig. 3C are provided in Fig. 3D. The OCT functional signal time courses reveal clear increases and decreases that deviate from baseline, reach a peak near the cessation of the stimulus, and then gradually return to baseline. The functional image in Fig. 3A was computed from the block-averaged data stream by averaging a 3 s window around the peak, as shown by the horizontal bar in Fig. 3D.
Fig. 3.

Functional OCT in the rat cortex. A fractional change map (A) demonstrates positive (warm colors) and negative (cool colors) changes in OCT signals during stimulation. Temporal sequences (B) reveal the presence of highly localized regions of activation in the cortex that persist throughout stimulation. Further analysis of the localized regions of interest (C, D) shows a functional OCT time course that correlates well with that of the intrinsic hemodynamic optical signal but with both positive- and negative-going responses. The horizontal bars in D indicate the time windows used to generate the functional map (A, B, C).
Understanding the exact etiology and time course of the OCT functional signal will require additional investigation. The results here have been validated in more than 10 animals to date, and in each case, a robust and highly localized OCT response is seen corresponding with the hemodynamic response. Moreover, the time course and spatial localization of the OCT responses track those measured by video microscopy. The response is absent outside of the region of hemodynamic activation and when the ipsilateral forepaw is stimulated. Furthermore, blood pressure traces reveal no signs of vagal response, which could suggest shock-induced motion artifact. The presence of positive- and negative-going OCT signals and the relatively speckled appearance of the response implicate swelling mechanisms as an important contributor. Furthermore, the presence of highly localized regions of activation in the cortex suggests that localized swelling or vascular dilation, rather than simply bulk brain swelling, is contributing. Finally, the possibility exists for localized scattering increases and decreases that reflect local changes in linear red cell density, an observation supported in previous literature.5 additional work will focus on careful characterization of the response, including the use of techniques such as three-dimensional and Doppler OCT. With further study, OCT has potential to become a new tool for basic and applied neuroscience research in animal models.
Acknowledgments
The authors thank E. Hillman and S. Yuan for helpful discussions. This research was supported by the Air Force Office of Scientific Research MFEL Program FA9550-040-1-0046 and FA9550-040-1-0011 and the National Institutes of Health R01-EB00790, R01-EY011289-20, and R01-CA75289-09. A. D. Aguirre has support from the Whitaker Foundation and the National Institutes of Health F31-EB005978-01. Y. Chen has support from the Cancer Research and Prevention Foundation.
References
- 1.Orbach HS, Cohen LB, Grinvald A. Trends Neurosci. 1985;5:1886. doi: 10.1523/JNEUROSCI.05-07-01886.1985. [DOI] [PMC free article] [PubMed] [Google Scholar]
- 2.Villringer A, Chance B. Trends Neurosci. 1997;20:435. doi: 10.1016/s0166-2236(97)01132-6. [DOI] [PubMed] [Google Scholar]
- 3.Devor A, Dunn AK, Andermann ML, Ulbert I, Boas DA, Dale AM. Neuron. 2003;39:353. doi: 10.1016/s0896-6273(03)00403-3. [DOI] [PubMed] [Google Scholar]
- 4.Sheth SA, Nemoto M, Guiou M, Walker M, Pouratian N, Toga AW. Neuron. 2004;42:347. doi: 10.1016/s0896-6273(04)00221-1. [DOI] [PubMed] [Google Scholar]
- 5.Kleinfeld D, Mitra PP, Helmchen F, Denk W. Proc Natl Acad Sci USA. 1998;95:15741. doi: 10.1073/pnas.95.26.15741. [DOI] [PMC free article] [PubMed] [Google Scholar]
- 6.Hillman EM, Boas DA, Dale AM, Dunn AK. Opt Lett. 2004;29:1650. doi: 10.1364/ol.29.001650. [DOI] [PubMed] [Google Scholar]
- 7.Huang D, Swanson EA, Lin CP, Schuman JS, Stinson WG, Chang W, Hee MR, Flotte T, Gregory K, Puliafito CA, Fujimoto JG. Science. 1991;254:1178. doi: 10.1126/science.1957169. [DOI] [PMC free article] [PubMed] [Google Scholar]
- 8.Maheswari RU, Takaoka H, Kadono H, Homma R, Tanifuji M. J Neurosci Methods. 2003;124:83. doi: 10.1016/s0165-0270(02)00370-9. [DOI] [PubMed] [Google Scholar]
- 9.Lazebnik M, Marks DL, Potgieter K, Gillette R, Boppart SA. Opt Lett. 2003;28:1218. doi: 10.1364/ol.28.001218. [DOI] [PubMed] [Google Scholar]
- 10.Yao XC, Yamauchi A, Perry B, George JS. Appl Opt. 2005;44:2019. doi: 10.1364/ao.44.002019. [DOI] [PubMed] [Google Scholar]
- 11.Bizheva K, Pflug R, Hermann B, Povazay B, Sattmann H, Qiu P, Anger E, Reitsamer H, Popov S, Taylor JR, Unterhuber A, Ahnelt P, Drexler W. Proc Natl Acad Sci USA. 2006;103:5066. doi: 10.1073/pnas.0506997103. [DOI] [PMC free article] [PubMed] [Google Scholar]
- 12.Fang-Yen C, Chu MC, Seung HS, Dasari RR, Feld MS. Opt Lett. 2004;29:2028. doi: 10.1364/ol.29.002028. [DOI] [PubMed] [Google Scholar]
- 13.Akkin T, Davé D, Milner T, Rylander H., III Opt Express. 2004;12:2377. doi: 10.1364/opex.12.002377. [DOI] [PubMed] [Google Scholar]
- 14.Bourquin S, Aguirre A, Hartl I, Hsiung P, Ko T, Fujimoto J, Birks T, Wadsworth W, Bünting U, Kopf D. Opt Express. 2003;11:3290. doi: 10.1364/oe.11.003290. [DOI] [PubMed] [Google Scholar]
- 15.Dunn AK, Devor A, Bolay H, Andermann ML, Moskowitz MA, Dale AM, Boas DA. Opt Lett. 2003;28:28. doi: 10.1364/ol.28.000028. [DOI] [PubMed] [Google Scholar]


