

Abstract
Natural killer (NK) cells contribute to the initial nonspecific response to viral infection, and viruses exhibit a range of sensitivities to NK cells in vivo. We investigated the role of NK cells in infection of mice by mouse adenovirus type 1 (MAV-1) using antibody-mediated depletion and knockout mice. MAV-1 causes encephalomyelitis and replicates to highest levels in brains. NK cell-depleted mice infected with MAV-1 showed brain viral loads 8-20 days p.i. that were similar to wild-type control non-depleted mice. Mice genetically deficient for NK cells behaved similarly to wild-type control mice with respect to brain viral loads and survival. We conclude that NK cells are not required to control virus replication in the brains of MAV-1-infected mice.
Keywords: adenovirus, mouse adenovirus, natural killer cell, NK cell, immunodepletion, brain
INTRODUCTION
Mouse adenovirus type 1 (MAV-1) infects monocytes and endothelial cells throughout the animal (Charles et al., 1998; Kajon et al., 1998; Moore et al., 2003). In acute infection, the highest viral loads are found in the brain, spinal cord, and spleen, and the virus causes encephalomyelitis (Guida et al., 1995; Kajon et al., 1998; Kring et al., 1995; Smith et al., 1998). Adaptive immune responses to MAV-1 infection have been investigated using immunodeficient mice. T lymphocytes contribute to pathology during the acute phase of MAV-1 infection, since T cell-deficient mice display fewer signs of immunopathology than do control mice (Moore et al., 2003). Mice deficient in α/β T cells succumb to MAV-1 infection 9-12 weeks after infection with high viral loads, either because MAV-1 replication is not limited during the acute phase or because T cells are needed to suppress persistent MAV-1 replication, or both. Mice deficient in B cells or B cell functions succumb to low dose MAV-1 infection 6-9 days after infection (Moore et al., 2004). These mice have high viral loads and disseminated infections; early T cell-independent IgM and neutralizing antibody are critical for protection from disseminated MAV-1 infection.
The role of innate immune response components in MAV-1 infection has not been well studied. NK cells are a key effector of the innate response to viral infection, and two major functions of NK cells are cytotoxicity and secretion of interferon (IFN)-γ (reviewed in Biron and Sen, 2007). However, NK cells are not required for defense against all viruses. For example, in infections of mice, mouse cytomegalovirus is sensitive to NK cells (Bukowski et al., 1984) while lymphocytic choriomeningitis virus and murine gammaherpesvirus 68 are relatively resistant (Usherwood et al., 2005; Welsh, 1986; Welsh, 1978; Welsh and Kiessling, 1980). Little is known about the importance of NK cells in controlling adenovirus infections in their natural hosts. The adenoviruses are species-specific, and human adenoviruses do not complete the full virus replication cycle in mice (reviewed in Ginsberg, 1999). Nonetheless, mice infected with high doses of human adenovirus develop pneumonia and have been used to evaluate early immune responses. NK cells are activated in response to injection with adenovirus vectors with and without transgenes in C57BL/6 mice, showing increased IFN-γ expression and cytotoxic killing (Ruzek et al., 2002). This response is independent of viral gene expression but requires intact viral particles. Mice depleted of their NK cells express transgenes longer than nondepleted mice (Peng et al., 2001). There are mouse strain differences in NK cell responses to infection with human adenovirus vectors, with higher NK cell activation, cytotoxicity, and IFN-γ production in BALB/c mice compared to C57BL/6 mice (Peng et al., 2001). Mouse NK cell cytotoxicity for tumor cells expressing the human adenovirus gene early region 1A is higher than for cells not expressing the gene, indicating that there are also NK cell responses elicited by adenoviral gene expression (Cook and Routes, 2005).
There is one report of the role of NK cells in MAV-1 infection. MAV-1 infection of CB.17/scid and CB.17/scid/beige mice was compared (Charles et al., 1998); beige-/- (Lyst-/-) mice are deficient in NK and other cell activity (Roder and Duwe, 1979; Saxena et al., 1982). The two strains of mice succumbed to MAV-1 with similar kinetics and were resistant to neurologic disease (Charles et al., 1998). The results suggest that the presence of NK cell activity offered no survival advantage to the SCID mice.
The role for B cell function (production of early antiviral IgM) in MAV-1 infection overlaps the time when typical innate immune responses occur (Moore et al., 2004), and could reduce the need for an NK cell response. NK cell killing is regulated by a balance of positive and negative signaling through activating and inhibitory cell receptors (reviewed in Biron and Sen, 2007; Lodoen and Lanier, 2006). Net activation of NK cell killing can occur when NK cells have received positive activation signaling greater than inhibitory signaling. Reduced inhibitory signaling can occur when NK cells encounter cells with low levels of major histocompatibility complex (MHC) class I antigens, which are ligands for some NK cell inhibitory receptors. Many viruses have mechanisms to downregulate MHC class I, thus protecting them from CD8+ T cell killing, but making them potentially susceptible to NK cell killing. However, MAV-1 does not downregulate MHC class I during infection (Kring and Spindler, 1996). This suggests that the cytotoxic function of NK cells might not be necessary for control of MAV-1 infection. On the other hand, SJL mice, which are highly susceptible to MAV-1 infection (Spindler et al., 2001), display a “low NK” phenotype, defined as low endogenous levels of NK cell killing that increase only minimally upon poly-I:C treatment (Kaminsky et al., 1983). Thus MAV-1 resistance may depend on functional NK cell responses.
To examine more thoroughly whether NK cells are necessary for control of MAV-1 infection, we infected mice that had undergone antibody-mediated depletion of NK cells and mice genetically deficient for NK cells. Depletion of NK cells in two MAV-1-resistant mouse strains, C57BL/6 and BALB/c, with anti-NK1.1 and anti-asialo GM1 antibodies, respectively, had no effect on control of replication of MAV-1 in the brain at early and late times post infection (p.i.). Mice genetically deficient in NK cells or a combination of NK and T cells did not differ from control mice in viral loads or survival. We conclude that NK cells are not required for control of MAV-1 replication in brains of resistant BALB/c and C57BL/6 mice.
RESULTS
Effects of NK cell depletion on early replication of MAV-1 in the brains of BALB/c and C57BL/6 mice
BALB/c mice were depleted of NK cells using anti-asialo GM1 to examine the ability of depleted mice to control MAV-1 infection at early times post infection. This antibody depletes NK cells and Ag-specific T cells when administered in vivo (Slifka et al., 2000). Mice were treated every two days with intraperitoneal (i.p.) injections of anti-asialo GM1 or control antibody; injections began one day before i.p. infection with 102 plaque-forming units (PFU) of MAV-1, a dose more than 2 log units below the LD50 for BALB/c mice (Guida et al., 1995; Spindler et al., 2001). Eight days after infection, splenocytes were analyzed by flow cytometry to measure the level of NK cell depletion (Fig. 1). NK cells were identified by DX5+ TCRβ-staining and therefore fall in the upper left quadrant of the dot plots. In mock-infected mice treated with control antibody, 2.75% of the splenocytes were DX5+ TCRβ-, whereas in anti-asialo GM1 antibody-treated mice the DX5+ TCRβ- cells were reduced to 0.45%, indicating a significant depletion of the NK cells. Upon MAV-1 infection alone we observed a reduction in the percentage of NK cells (Fig. 1A, compare top panels), but because there were increased numbers of total splenocytes in the infected mice, the absolute number of NK cells did not differ between mock and infected control antibody-treated mice (data not shown). There was no significant difference in percentage of NK cells between the antibody-depleted mock-infected and antibody-depleted MAV-1-infected groups (Fig. 1A, lower panels, 0.45% and 0.51%). We analyzed the brain viral loads from all of the infected mice to determine the effects of NK cell depletion on viral replication. The brain viral titers were measured by enzyme linked immunosorbent assay (ELISA); there were no significant differences between control mice and NK cell-depleted mice (Fig. 1B). There were also no clinical signs of disease observed in infected NK cell-depleted or control mice. The finding that NK cell depletion did not lead to increased viral replication suggests that BALB/c mice do not require NK cells for control of MAV-1 in the brain at early times after infection.
Figure 1.
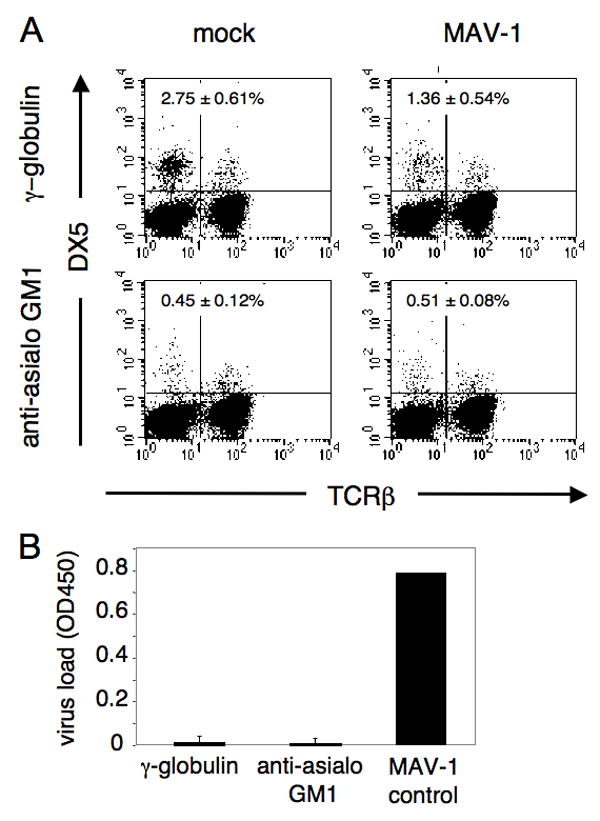
Effects of NK cell depletion on BALB/c mice. A. Representative example of flow cytometric confirmation of depletion. BALB/cAnNCr mice were injected i.p. at day -1, 1, 3, 5, 7 relative to infection with 1.07 mg of anti-asialo GM1 or rabbit γ-globulin as control antibody. Animals were given a dose of 102 PFU of MAV-1 i.p. and euthanizes at 8 days p.i. Splenocytes were analyzed for individual mice, and dot plots for one representative mouse of each treatment group are shown. Percentages of DX5+ TCRβ- cells are indicated in the top left quadrants; values are the mean and standard deviation for all the mice in each treatment group (n= 3-4 per group). Mice were analyzed individually for both NK cell depletion and brain viral titer. B. Brain titers following NK cell depletion and MAV-1 infection of BALB/cAnNCr mice 8 days p.i., assayed by capture ELISA. Each bar represents the background-subtracted average of the group, with standard deviation indicated. The MAV-1 control is an internal standard run in each assay as a positive control for the ELISA. A and B are representative examples of three depletion experiments of BALB/cAnNCr mice that all had similar results.
We tested the effect of NK cell depletion in C57BL/6 mice, a strain in which NK cells can be depleted with the anti-NK1.1 antibody (PK136). Mice were treated with PK136 i.p. on days -1 and 0 and infected i.p. on day 0 with 103 PFU of MAV-1, a dose more than 1.4 log units below the LD50 for C57BL/6 mice (Guida et al., 1995; Spindler et al., 2001). Mice were euthanized on day 8, and flow cytometric analysis of their splenocytes revealed that treatment with PK136 effectively depleted NK cells while treatment with control antibody had no effect (Fig. 2A). The upper left quadrant of the dot plots indicates NK cells (DX5+ TCRβ-). The upper plots illustrate that 3.30% of the splenocytes in mock-depleted, mock-infected animals were DX5+ TCRβ-, whereas the lower plots show that only 0.52% of splenocytes in PK136-treated, mock-infected animals were NK1.1+ TCRβ-, indicating a significant depletion of NK cells. The PK136 antibody also depletes NK1.1 T cells (Mühlen et al., 2004), and a reduction in this cell population can be seen in these experiments (upper right quadrants of the dot plots). MAV-1 infection alone (in the absence of NK cell depletion) of C57BL/6 mice resulted in a reduction in the percentage of splenic NK cells (Fig. 2A, compare upper left and right panels), but because of increased numbers of splenocytes in the infected mice, the number of NK cells was similar between mock- and virus-infected control antibody-treated mice (data not shown). Brain titers of NK cell-depleted and mock-depleted animals were measured by plaque assay and capture ELISA; we have previously shown that ELISA and plaque assay measurements of viral load correlate (Welton et al., 2005). A similar correlation is seen here (Fig. 2B, 2C). There were no significant differences in viral load between NK cell-depleted mice and mock-depleted mice (Fig. 2B, P = 0.12; Fig. 2C, P = 0.46). There were also no observable clinical signs of disease in NK-cell depleted or control mice. These results indicate that the absence of NK and NK1.1 T cells did not alter viral replication in the brains of C57BL/6 mice at early times after MAV-1 infection.
Figure 2.
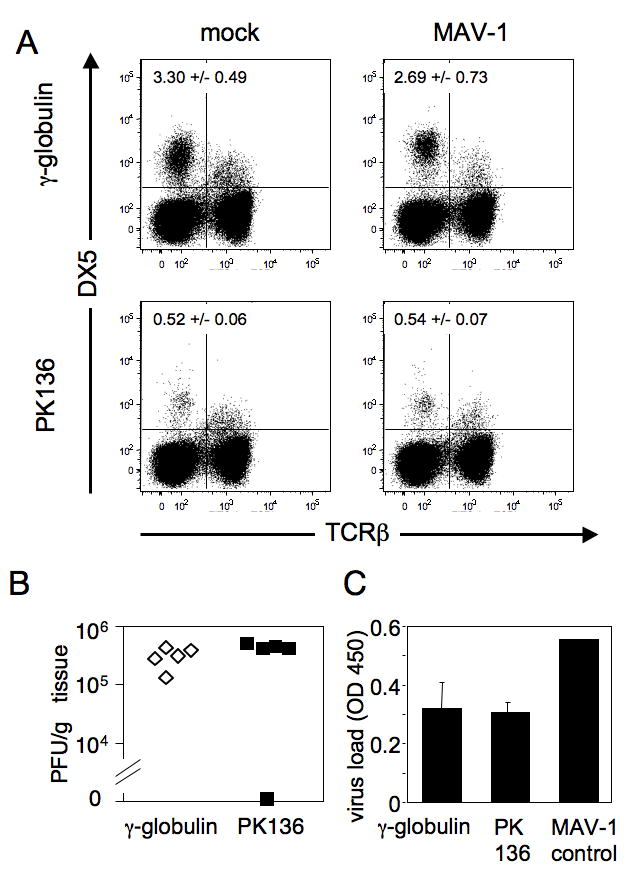
NK cell depletion and infection in C57BL/6NCr mice. A. Representative example of flow cytometric confirmation of depletion. C57BL/6NCr mice were mock depleted using a γ-globulin control antibody (upper panels) or were depleted of NK cells using PK136 (lower panels). On days -1 and 0 animals were injected i.p. with 100 μg of antibody. Intraperitoneal infection with 103 PFU of MAV-1 or mock infection also occurred on day 0. Splenocytes isolated from mice 8 days p.i. were analyzed individually and one mouse of each treatment group is shown. Percentages of NK cells in the spleen are indicated in the upper left quadrant (DX5+, TCRβ-) for the four treatment groups; values are the mean and standard deviation for all the mice in each treatment group (n = 4-5 per group). Depletion results were confirmed by staining for NK1.1 instead of DX5 (data not shown). B. Viral loads in the brain were determined by plaque assay for each animal, treated either with control γ-globulin or PK136, as indicated. Serially diluted MAV-1 was concurrently titrated as a positive control (data not shown). Results are one example of three replicate experiments performed. C. Viral loads were also determined for the same animals as in B using capture ELISA. The MAV-1 control is an internal standard run in each assay as a positive control for the ELISA.
To examine the role of NK cells at other times in infection, we depleted C57BL/6 mice of their NK cells for 4, 14 or 20 days. Mice were injected with either PK136 or a control antibody on days -1, 0, 7, 8, 15 and 16 and infected with 103 PFU of MAV-1 on day 0. At 4 days p.i. in NK cell-depleted and mock-depleted mice, brain viral loads were below the limit of detection (data not shown). At 14 or 20 days p.i., groups of mice were euthanized, and the effectiveness of the NK cell depletion was examined by flow cytometry of splenocytes. NK cells were depleted in mice treated with PK136 at both 14 and 20 days p.i. (Fig. 3A and data not shown). NK cells comprised 2-4% of the splenocytes in control antibody-treated mice but <0.9% of splenocytes in PK136-treated mice. This indicates that the long-term treatment schedule effectively depleted NK cells. Although there was a lower percentage of NK cells in virus-infected γ-globulin-treated mice compared to mock-infected mice (compare Fig. 3A upper left and right panels), the number of NK cells was similar because there were more splenocytes in the infected mice (data not shown). At 14 days p.i., NK cell-depleted mice had a low level of detectable virus in their brains, whereas mice that were mock-depleted had viral loads that were below the limit of reliable detection by plaque assay (Fig. 3B). This suggests that there may have been a slower rate of clearance of virus in the absence of NK cells. However, by 20 days p.i., mice in both the NK cell-depleted and control groups had cleared MAV-1, with brain viral titers below the limit of reliable detection by plaque assay, indicating that the overall result was clearance of the virus in both the absence and presence of NK cells. No clinical signs of disease were observed for NK cell-depleted or control mice at any time point. Despite the difference in viral load at 14 days p.i. between the mock- and NK cell-depleted mice, the ability of all animals to control the infection by day 20 is consistent with results described above that NK and NK1.1 T cells were not required for the control of acute MAV-1 infection.
Figure 3.
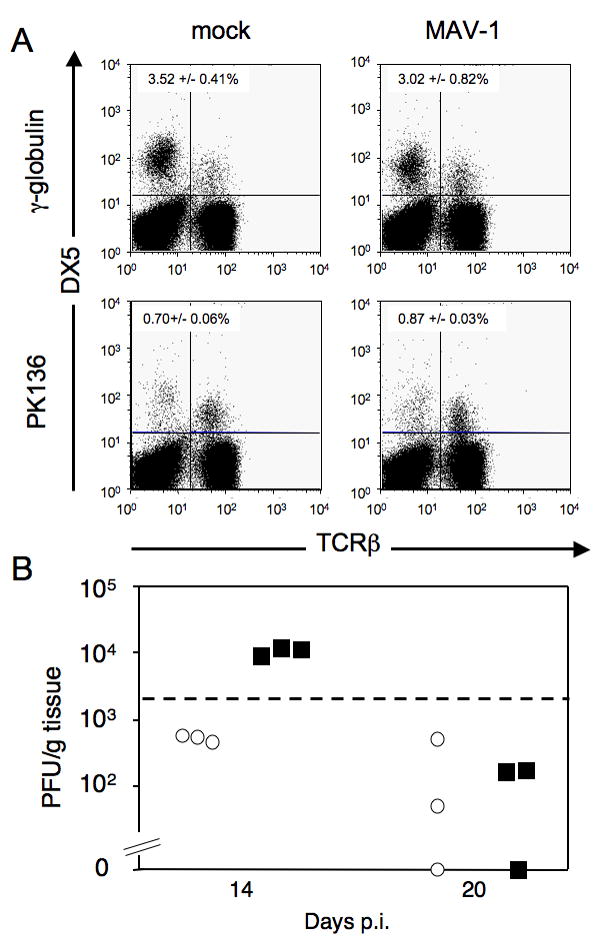
Effect of NK cell depletion and infection in C57BL/6NCr mice at 14-20 dpi. A. Mice were given γ-globulin or PK136 on days -1, 0, 6 and 7 for 14-day infections and on days -1, 0, 6, 7, 13 and 14 for 20-day infections. Mice were infected i.p. with 103 PFU of MAV-1 on day 0. NK cell depletion was confirmed by flow cytometry as shown in this representative example from 14 days p.i. in which one mouse of each treatment group is shown. Percentages of NK cells in the spleen are indicated in the upper left quadrant (DX5+, TCRβ-) for each of the four groups; values are the mean and standard deviation for all the mice in each group (n = 3). For the 20-day samples the depletions were comparable (data not shown). Depletion results were confirmed by staining for NK1.1 instead of DX5 (data not shown). B. Viral loads in the brain as determined by plaque assay in mock depleted (circles) or NK cell-depleted (squares) mice 14 or 20 days p.i. Dotted line indicates the limit of reliable detection in the plaque assay (2 × 10³ PFU/g).
Virus loads in MAV-1 infected IL-15-/- mice are similar to those in control mice
To test if mice genetically deficient in NK cells retain the ability to control MAV-1 at early times post infection, we tested interleukin (IL)-15-/- (C57BL/6NTac-IL15tm1Imx) mice, which lack NK cells and also have reductions in memory CD8 T cells, NK1.1 T cells and Thy1- CD8α intraepithelial lymphocytes (Kennedy et al., 2000). IL-15-/- and control C57BL/6NTac mice were infected i.p. with 102 PFU of MAV-1 and euthanized 8 days p.i. Brain viral titers were analyzed by capture ELISA. IL-15-/- mice did not show increased viral titers compared to the control mice (Fig. 4). Neither NK cell-deficient nor control mice showed any signs of clinical disease. This result suggests that IL-15, NK cells, memory CD8 T cells, NK1.1 T cells and Thy1-CD8α intraepithelial lymphocytes were not required to control MAV-1 infection. These data are consistent with the data in Figs. 1 - 3 that neither NK cells nor NK1.1 T cells played a major role in the control of MAV-1 infection in the brain.
Figure 4.
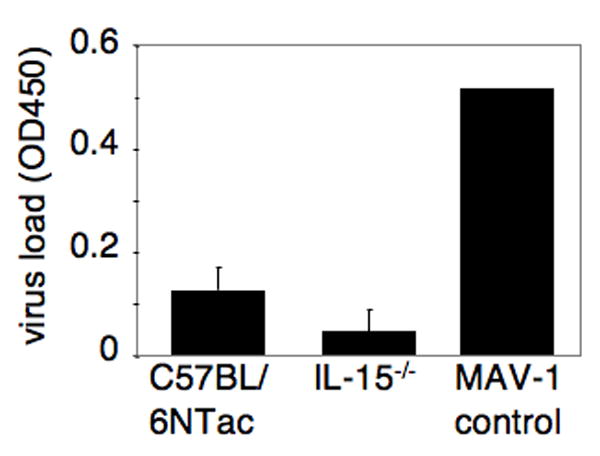
Capture ELISA quantitation of brain viral titers in MAV-1-infected C57BL/6Ntac (control) and IL-15 -/- mice. Animals were infected for 8 days with 102 PFU of MAV-1. Each bar represents the background subtracted averages per group; n= 5 for each group. The MAV-1 control is an internal standard run in each assay as a positive control.
Effects of the combined lack of NK cells and T cells on replication of MAV-1 in the brains of CD3εtg mice
We further tested the importance of NK cells using a strain of mice lacking both NK and T cells. T cell-deficient mice are able to control MAV-1 infection at early times but succumb 10-12 weeks p.i. (Moore et al., 2003). CD3εtg mice lack NK cells and T cells (Wang et al., 1994) and provide another genetically deficient model in which to test the importance of NK cells for control of MAV-1 at early and late times of infection, albeit in the background of T cell deficiency. CD3εtg and C57BL/6 control mice were infected i.p. with 102 PFU of MAV-1 and euthanized 8 days p.i. Brain viral titers were analyzed by plaque assay. Titers were similar for both C57BL/6 and CD3εtg infected mice (Fig. 5), indicating that CD3εtg mice did not differ from C57BL/6 controls in their ability to control MAV-1 infection at 8 days p.i. Mice were also analyzed at 4 and 6 days p.i. Viral loads were below the limit of detection in both CD3εtg and C57BL/6 mice at 4 days p.i., but at 6 days p.i. viral loads were detectable and also did not differ between the two strains (data not shown). To examine a role for NK cells in long-term MAV-1 infections, CD3εtg mice (deficient in NK and T cells) were compared to B6.129P2-Tcrbtm1Mom Tcrdtm1Mom/J (β×δ) mice (deficient in αβ and γδ T cells). These two strains and C57BL/6 control mice were infected with 102 PFU of MAV-1, and survival was measured over the course of 10 weeks. The results indicate there was not a significant difference in the ability to control and survive MAV-1 infection in mice lacking NK and T cells compared to mice lacking only T cells (Supplementary Figure). These data are consistent with the findings above that NK cells were not critical for control of MAV-1 infection of BALB/c and C57BL/6 mice.
Figure 5.
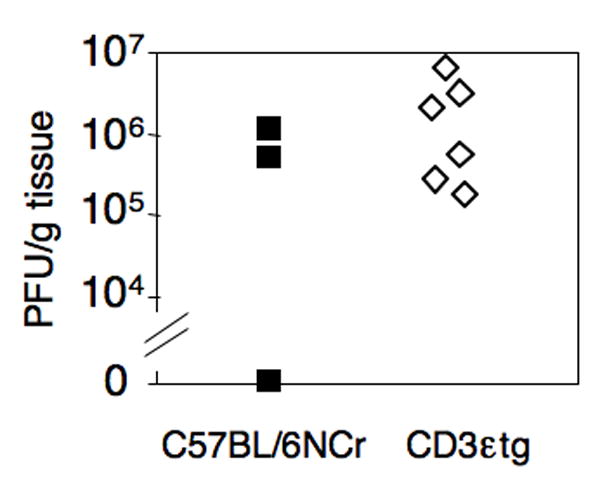
Infection of CD3εtg and C57BL/6NCr mice. Animals were infected for 8 days with 102 PFU of MAV-1. Viral loads in the brain were determined by plaque assay and were not significantly different (P = 0.76).
DISCUSSION
We hypothesized that NK cells may be important for MAV-1 infection because SJL mice, which are susceptible to MAV-1 (Spindler et al., 2001), have a “low NK” phenotype (Kaminsky et al., 1983). That is, they have low endogenous levels of NK cell activity that are not increased by treatment with IFN-γ or IFN inducers. The corollary is that NK cells of MAV-1-resistant mouse strains contribute to this resistance to infection. To test this, we depleted resistant mouse strains of their NK cells in order to mimic the low NK phenotype of SJL mice. BALB/c mice are considered to be resistant to MAV-1 and C57BL/6 mice are relatively resistant, with a 1-2 log unit lower 50% lethal dose (LD50) than BALB/c (Guida et al., 1995; Spindler et al., 2001). Despite this lower LD50, C57BL/6 mice are able to survive and clear virus doses used in these experiments (Moore et al., 2003; Moore et al., 2004). In the experiments reported here, mice of these two inbred strains were efficiently depleted of NK cells by administration of anti-asialo GM1 antibody (BALB/c) or anti-NK1.1 antibody (C57BL/6). Mice depleted of NK cells by antibody injection showed no clinical signs of disease, and brain viral loads were similar in NK cell-depleted and mock-depleted mice 8-20 days post infection (Figs. 1-3). These results indicate that a lack of NK cells did not result in altered levels of MAV-1 replication in the brain in the acute phase of infection and suggest that NK cell depletions did not increase the ability of MAV-1 to traffic to the brain. The data do not support the hypothesis that MAV-1-susceptible mouse strains are susceptible because of functional NK cell deficiency.
The antibody depletion strategies used in these studies deplete NK1.1 T cells as well as the larger NK cell population. IL-15-/- mice also lack NK1.1 T cells, allowing for the possibility that an absence of this cell population played a role in these results. While not yet fully understood, the role of NK1.1 T cells in fighting infection is believed to occur primarily through their rapid release of IFN-γ and ability to activate other immune cells (Van Dommelen and Degli-Esposti, 2004). NK1.1 T cells have been reported to confer protection or partial protection from various viral and bacterial infections including HSV-1 and HSV-2 (Ashkar and Rosenthal, 2003; Grubor-Bauk et al., 2003) and Streptococcus pneumoniae (Kawakami et al., 2003). The simultaneous depletion of NK and NK1.1 T cells had no effect on pathogenesis or brain viral loads in MAV-1-infected mice. Given these results we conclude that NK1.1 T cells are unlikely to play a role in controlling MAV-1 infection.
Depletions of NK cells by anti-asialoGM1 and PK136 antibody treatment have been widely demonstrated to functionally deplete NK cell activity in vivo (Wang et al., 1998; Welsh et al., 1990). Furthermore, use of mice genetically deficient for NK cells confirmed the results obtained by NK cell-depletion, i.e., lack of NK cells did not make BALB/c or C57BL/6 mice more susceptible to MAV-1 infection in the brain. IL-15 induces the activation and increases the cytotoxicity of mature NK cells, and it is crucial for NK cell development and maintenance of memory CD8+ T cells (Carson et al., 1994; Goldrath et al., 2002; Kennedy et al., 2000; reviewed in Prlic et al., 2002). Due to these roles, mice deficient in IL-15 lack NK cells and have reductions in memory CD8+ T cells, NK1.1 T cells and Thy1- CD8α intraepithelial lymphocytes (Kennedy et al., 2000). Despite these defects, IL-15-/- mice mount effective virus-specific primary CD8+ T cell responses and control some experimental viral infections (Becker et al., 2002; Goldrath et al., 2002; Obar et al., 2004; Zuo et al., 2005) but not others (Kennedy et al., 2000; Schluns et al., 2002). We found that IL-15-/- mice showed no increase in susceptibility to MAV-1 upon infection relative to control mice on the same strain background. These data support our findings that NK cells are not required for control of MAV-1 infection. Furthermore they indicate that IL-15, memory CD8+ T cells, NK1.1 T cells and Thy1- CD8α intraepithelial lymphocytes also do not play a significant role in the acute phase of infection.
CD3εtg mice are another genetically NK cell-deficient mouse model. These mice are deficient in T cells and NK cells and showed no differences in MAV-1 brain viral titers from control mice at 6 and 8 days p.i. We compared long-term survival of these CD3εtg mice that lack both NK and T cells to mice that lack only T cells (β×δ) (Supplementary Figure). Previous work using T cell-deficient mice (β×δ and others) showed that T cells are required for long-term control of viral infection (Moore et al., 2003). In the experiments reported here, CD3εtg mice succumbed to MAV-1 infection before all of the β×δ mice, suggesting that the NK cell deficiency in the CD3εtg mice may have an effect on long-term survival. However, statistical analysis revealed that the difference was not significant at the 5% level. We note that the genetic cause of the T cell deficiency is different in the β×δ and CD3εtg mice, and that there are inevitable minor strain background differences arising from backcrossing the T cell mutations to the C57BL/6J background. Thus there are caveats to making comparisons of mice with the two T cell deficiencies. However, the long-term survival data for the CD3εtg mice are consistent with only a modest role (if any) for NK cells late in MAV-1 infection. Our data suggest that the role of T cells in controlling MAV-1 infection is greater than that of NK cells.
Although we were initially surprised that a lack of NK cells did not alter disease signs, survival, and brain viral loads in MAV-1 infection, our data are consistent with the results of Charles et al. (1998), who examined MAV-1 infection of mice carrying a mutation of the Lyst (beige) gene. Lyst-/- mice (knocked out for the lysosomal trafficking regulator) have reduced NK cell activity (Roder and Duwe, 1979; Saxena et al., 1982). However these mice do not lack all NK cell function, particularly in viral infections (Kärre et al., 1980; Roder and Duwe, 1979; Welsh and Kiessling, 1980). In addition, Lyst-/- mice have granulocyte defects (Gallin et al., 1974); thus NK cells are not the only cells affected. Charles et al. (1998) found that whether mice carried the Lyst-/- mutation or not, they were equally susceptible to MAV-1 infection at lethal doses and lacked neurologic dissemination and signs of central nervous system hemorrhage. Despite the caveats about the pleiotropic effects of the Lyst-/- gene mutation, the data suggest that the NK cell defects (and other defects) of the Lyst-/- mice do not make mice more susceptible to MAV-1 infection.
In addition, in agreement with our findings for MAV-1, there are other viruses known to be relatively resistant in vivo to the effects of NK cells. These include lymphocytic choriomeningitis virus and murine gammaherpesvirus 68 (Usherwood et al., 2005; Welsh, 1986; Welsh, 1978; Welsh and Kiessling, 1980). We consider here reasons why control of MAV-1 replication in the brain is not dependent on NK cells. Alteration of MHC class I expression is a common tactic viruses employ to evade detection and activation by immune cells (Orange et al., 2002). The balance of NK cell activation vs. inhibition can be shifted toward activation of cytotoxicity when NK cells detect target cells expressing reduced levels of MHC class I (reviewed in Biron and Sen, 2007). A previous finding suggests that NK cell recognition of “low MHC class I” cells may not be important for control of MAV-1 infection: MAV-1 infection does not decrease MHC class I expression (Kring and Spindler, 1996). This may reduce the need for NK cell-mediated cytolysis of cells lacking MHC class I. NK cells in mice deficient for MHC class I are defective in target killing (Yokoyama and Kim, 2006). Mice genetically deficient for MHC class I expression (β2m-/-) survive infection with MAV-1 and are able to clear virus nearly as well as control mice (Moore et al., 2003), despite having functionally defective NK cells. Another reason why NK cells may not be critical for response to MAV-1 infection is that they may not be needed for production of IFN-γ. Antigen-presenting cells produce large amounts of IFN-γ in response to IL-12, and the amounts of IFN-γ produced in vitro by dendritic cells and macrophages are substantially larger than those produced by NK cells (Fukao and Koyasu, 2000; Fukao et al., 2000; Ohteki et al., 1999; Puddu et al., 1997). MAV-1 infection induces transient IL-12 expression in splenocytes and peritoneal cells, which should thus induce IFN-γ (Coutelier et al., 1995). IFN-γ likely plays a role in control of MAV-1 infection, because mice deficient for IFN-γ are more susceptible than control mice to MAV-1 infection (M. Moore and K. Spindler, unpublished). However we postulate that T cells and antigen presenting cells produce enough IFN-γ to control the MAV-1 infection in the absence of NK cells.
The data presented in this report indicate that NK cells are not required for control of MAV-1 infection at early or late times post infection, as measured by brain viral loads. This suggests that neither cytotoxic effects nor IFN-γ secretory functions of NK cells are critical to the control of MAV-1 replication. These studies also suggest that the “low NK” phenotype of MAV-1-susceptible SJL mice is not responsible for their inability to control MAV-1 replication. This is consistent with our susceptibility mapping studies (Welton et al., 2005), which indicate that a major quantitative trait locus on mouse Chromosome 15 is involved in susceptibility to MAV-1, whereas we found no quantitative trait loci for susceptibility on Chromosome 6, where the mouse natural killer complex locus maps. Combined, these data indicate that in mouse strains with a range of susceptibilities to MAV-1 infection, NK and NKT cells are unimportant for control of replication of virus in the brain.
MATERIALS AND METHODS
Mice, virus, infections, and statistics
BALB/cAnNCr and C57BL/6NCr mice were obtained from the National Cancer Institute (Bethesda, MD). CD3εtg mice were a kind gift of E. Szomolanyi-Tsuda. These mice express human CD3ε in high copy and are defective in T cells and NK cells, but not B cells (Hollander et al., 1995; Szomolanyi-Tsuda et al., 2001; Wang et al., 1994). These mice had been backcrossed onto a C57BL/6 background for 10 generations by Dr. Szomolanyi-Tsuda. C57BL/6NTac-IL15tm1Imx mice and C57BL/6NTac background controls were obtained from Taconic (Germantown, NY), originally generated in the laboratory of Dr. Jacques Peschon of the Immunex Corporation (Seattle, WA). IL15-/- mice lack NK cells and have reductions in memory CD8 T cells, NK1.1 T cells and Thy1- CD8α intraepithelial lymphocytes (Kennedy et al., 2000). C57BL/6NCR.129P2-Tcrbtm1Mom Tcrdtm1Mom/J (β×δ) were obtained from The Jackson Laboratory (Bar Harbor, ME). These mice had been backcrossed onto a C57BL/6 background for an unknown number of generations, and C57BL/6NCr mice were used as background controls. These β×δ mice do not express αβ T-cell receptor or any γδ T-cell receptor and are thus deficient in both αβ and γδ T lymphocytes. Mice were infected i.p. with 102 or 103 PFU of MAV-1 in 100 μl phosphate-buffered saline or mock-infected with conditioned media (media from uninfected cells 3-5 days post confluence) similarly diluted. Mice were euthanized at 8, 14 or 20 days p.i. or when moribund in the long-term survival experiment by CO2 asphyxiation, and their organs were harvested. All mice were maintained in microisolator housing with food and water ad libitum. All animal work complied with relevant federal and institutional policies. MAV-1 was grown and titrated in NIH 3T6 cells, a mouse fibroblast cell line (Cauthen et al., 2007). A log rank (Mantel-Cox) test of the null hypothesis that the survival curves (based on Kaplan-Meier estimates) were equivalent was performed using SPSS software. Student’s t test analyses were performed using Microsoft Excel.
Depletion of NK cells
To deplete NK cells in BALB/cAnNCr mice, 1.07 mg anti-asialo GM1 antibody (Wako Chemicals USA, Inc., Richmond, VA) was administered i.p. on days -1, 1, 3, 5, 7 relative to infection (day 0). Control animals were given the same dose of rabbit γ-globulin (Jackson ImmunoResearch Laboratories, Inc., West Grove, PA). To deplete NK cells in C57BL/6NCr mice, an i.p. injection of 100 μg of PK136, a rat monoclonal against mouse NK1.1 antigen (purified by University of Virginia Lymphocyte Culture Center), was administered on days 0 and 1 relative to infection (day 0) for a total dose of 200 μg. The same dose of rat IgG antibody (Jackson ImmunoResearch Laboratories, Inc., West Grove, PA) was given to control mice. For long-term NK cell depletion in C57BL/6NCr mice, animals were given 100 μg doses of PK136 on days -1, 0, 7, 8, 15 and 16 relative to infection. NK cell depletion was confirmed by flow cytometry in every experiment. Depletion with PK136 and anti-asialo GM1 antibody reduced NK cell numbers to a mean of 6 or 16% of non-depleted levels of NK cells, respectively.
Flow cytometry analysis
C57BL/6NCr splenocytes were stained with antibodies to NK1.1, TCRβ and DX5 (BD Biosciences, San Jose, CA). BALB/cAnNCr splenocytes were stained with antibodies to TCRβ and DX5 (BD Biosciences, San Jose, CA). Analysis was conducted on 150,000 cells per sample in C57BL/6NCr experiments and 200,000 cells per sample in BALB/cAnNCr experiments. Stained samples were analyzed by flow cytometry with a FACScan™ or FACSCaliber flow cytometer and CellQuest™ (BD Biosciences, San Jose, CA) or FlowJo (Tree Start Inc, Ashland, OR) software. Efficient NK cell depletion was confirmed by identifying NK cells as NK1.1+TCRβ- and DX5+ TCRβ- in the case of C57BL/6NCr mice or DX5+ TCRβ- in the case of BALB/cAnNCr mice.
Quantitation of virus
Brain homogenates were prepared using the Mini-Beadbeater-96 (BioSpec Products, Bartlesville, OK) as previously described (Welton et al., 2005; Welton and Spindler, 2007). Briefly, the ~100 mg samples were mechanically disrupted with sterile glass beads in phosphate-buffered saline and assayed via plaque assay (Cauthen et al., 2007) or by antigen capture ELISA (Welton et al., 2005; Welton and Spindler, 2007). These two methods of virus quantitation have been shown by regression analysis to have a high correlation coefficient (Welton et al., 2005).
Supplementary Material
Survival curve of infected C57BL/6NCr (B6), CD3εtg (CD3) and β×δ mice. Mice were infected with 102 PFU of MAV-1 and monitored daily for survival. Comparison of the survival curves of β×δ and CD3εtg mice indicated that the log rank (Mantel-Cox) chi-square statistic was 3.06, on one degree of freedom (P = 0.08) and the survival curves were not significantly different at the 5% level.
Acknowledgments
We are grateful to Dr. Eva Szomolanyi-Tsuda for providing the CD3εtg mice. We thank Marty Moore, Tom Moore, and Yasmina Laouar for valuable discussions, advice and comments on the manuscript. We thank Mike Imperiale and Jason Weinberg for their careful reading of the manuscript. We thank Brady West for statistical assistance. This work was supported by NIH R01 AI023762 to K.R.S. and NIH T32 AI007528 (L.E.G.).
Footnotes
Publisher's Disclaimer: This is a PDF file of an unedited manuscript that has been accepted for publication. As a service to our customers we are providing this early version of the manuscript. The manuscript will undergo copyediting, typesetting, and review of the resulting proof before it is published in its final citable form. Please note that during the production process errors may be discovered which could affect the content, and all legal disclaimers that apply to the journal pertain.
References
- Ashkar AA, Rosenthal KL. Interleukin-15 and natural killer and NKT cells play a critical role in innate protection against genital herpes simplex virus type 2 infection. J Virol. 2003;77:10168–10171. doi: 10.1128/JVI.77.18.10168-10171.2003. [DOI] [PMC free article] [PubMed] [Google Scholar]
- Becker TC, Wherry EJ, Boone D, Murali-Krishna K, Antia R, Ma A, Ahmed R. Interleukin 15 is required for proliferative renewal of virus-specific memory CD8 T cells. J Exp Med. 2002;195:1541–1548. doi: 10.1084/jem.20020369. [DOI] [PMC free article] [PubMed] [Google Scholar]
- Biron CA, Sen GC. Innate responses to viral infections. In: Knipe DM, Howley PM, editors. Fields Virology. 5. Vol. 1. Lippincott Williams & Wilkins; Philadelphia: 2007. pp. 249–278. 2 vols. [Google Scholar]
- Bukowski JF, Woda BA, Welsh RM. Pathogenesis of murine cytomegalovirus infection in natural killer cell-depleted mice. J Virol. 1984;52:119–128. doi: 10.1128/jvi.52.1.119-128.1984. [DOI] [PMC free article] [PubMed] [Google Scholar]
- Carson WE, Giri JG, Lindemann MJ, Linett ML, Ahdieh M, Paxton R, Anderson D, Eisenmann J, Grabstein K, Caligiuri MA. Interleukin (IL) 15 is a novel cytokine that activates human natural killer cells via components of the IL-2 receptor. J Exp Med. 1994;180 doi: 10.1084/jem.180.4.1395. [DOI] [PMC free article] [PubMed] [Google Scholar]
- Cauthen AN, Welton AR, Spindler KR. Construction of mouse adenovirus type 1 mutants. Methods Mol Med. 2007;130:41–59. doi: 10.1385/1-59745-166-5:41. [DOI] [PubMed] [Google Scholar]
- Charles PC, Guida JD, Brosnan CF, Horwitz MS. Mouse adenovirus type-1 replication is restricted to vascular endothelium in the CNS of susceptible strains of mice. Virology. 1998;245:216–228. doi: 10.1006/viro.1998.9180. [DOI] [PubMed] [Google Scholar]
- Cook JL, Routes JM. Adenovirus E1A gene-induced tumor cell rejection through cellular sensitization to immune and nonimmune apoptotic injuries. Front Biosci. 2005;10:1396–1414. doi: 10.2741/1628. [DOI] [PubMed] [Google Scholar]
- Coutelier J-P, van Broeck J, Wolf SF. Interleukin-12 gene expression after viral infection in the mouse. J Virol. 1995;69:1955–1958. doi: 10.1128/jvi.69.3.1955-1958.1995. [DOI] [PMC free article] [PubMed] [Google Scholar]
- Fukao T, Koyasu S. Expression of functional IL-2 receptors on mature splenic dendritic cells. Eur J Immunol. 2000;30:1453–1457. doi: 10.1002/(SICI)1521-4141(200005)30:5<1453::AID-IMMU1453>3.0.CO;2-W. [DOI] [PubMed] [Google Scholar]
- Fukao T, Matsuda S, Koyasu S. Synergistic effects of IL-4 and IL-18 on IL-12-dependent IFN-gamma production by dendritic cells. J Immunol. 2000;164:64–71. doi: 10.4049/jimmunol.164.1.64. [DOI] [PubMed] [Google Scholar]
- Gallin JI, Bujak JS, Patten E, Wolff SM. Granulocyte function in the Chediak-Higashi syndrome of mice. Blood. 1974;43:201–206. [PubMed] [Google Scholar]
- Ginsberg HS. The life and times of adenoviruses. Adv Virus Res. 1999;54:1–13. doi: 10.1016/s0065-3527(08)60363-2. [DOI] [PubMed] [Google Scholar]
- Goldrath AW, Sivakumar PV, Glaccum M, Kennedy MK, Bevan MJ, Benoist C, Mathis D, Butz EA. Cytokine requirements for acute and basal homeostatic proliferation of naive and memory CD8+ T cells. J Exp Med. 2002;195:1515–1522. doi: 10.1084/jem.20020033. [DOI] [PMC free article] [PubMed] [Google Scholar]
- Grubor-Bauk B, Simmons A, Mayrhofer G, Speck PG. Impaired clearance of herpes simplex virus type 1 from mice lacking CD1d or NKT cells expressing the semivariant Vα14-Jα281 TCR. J Immunol. 2003;170:1430–1434. doi: 10.4049/jimmunol.170.3.1430. [DOI] [PubMed] [Google Scholar]
- Guida JD, Fejer G, Pirofski L-A, Brosnan CF, Horwitz MS. Mouse adenovirus type 1 causes a fatal hemorrhagic encephalomyelitis in adult C57BL/6 but not BALB/c mice. J Virol. 1995;69:7674–7681. doi: 10.1128/jvi.69.12.7674-7681.1995. [DOI] [PMC free article] [PubMed] [Google Scholar]
- Hollander GA, Simpson SJ, Mizoguchi E, Nichogiannopoulou A, She J, Gutierrez-Ramos JC, Bhan AK, Burakoff SJ, Wang B, Terhorst C. Severe colitis in mice with aberrant thymic selection. Immunity. 1995;3:27–38. doi: 10.1016/1074-7613(95)90156-6. [DOI] [PubMed] [Google Scholar]
- Kajon AE, Brown CC, Spindler KR. Distribution of mouse adenovirus type 1 in intraperitoneally and intranasally infected adult outbred mice. J Virol. 1998;72:1219–1223. doi: 10.1128/jvi.72.2.1219-1223.1998. [DOI] [PMC free article] [PubMed] [Google Scholar]
- Kaminsky SG, Nakamura I, Cudkowicz G. Selective defect of natural killer and killer cell activity against lymphomas in SJL mice: low responsiveness to interferon inducers. J Immunol. 1983;130:1980–1984. [PubMed] [Google Scholar]
- Kärre K, Klein GO, Kiessling R, Klein G, Roder JC. In vitro NK-activity and in vivo resistance to leukemia: Studies of beige, beige//nude and wild-type hosts on C57BL background. Int J Cancer. 1980;26:789–797. doi: 10.1002/ijc.2910260613. [DOI] [PubMed] [Google Scholar]
- Kawakami K, Yamamoto N, Kinjo Y, Miyagi K, Nakasone C, Uezu K, Kinjo T, Nakayama T, Taniguchi M, Saito A. Critical role of Vα14+ natural killer T cells in the innate phase of host protection against Streptococcus pneumoniae infection. Eur J Immunol. 2003;33:3322–3330. doi: 10.1002/eji.200324254. [DOI] [PubMed] [Google Scholar]
- Kennedy MK, Glaccum M, Brown SN, Butz EA, Viney JL, Embers M, Matsuki N, Charrier K, Sedger L, Willis CR, Brasel K, Morrissey PJ, Stocking K, Schuh JC, Joyce S, Peschon JJ. Reversible defects in natural killer and memory CD8 T cell lineages in interleukin 15-deficient mice. J Exp Med. 2000;191:771–780. doi: 10.1084/jem.191.5.771. [DOI] [PMC free article] [PubMed] [Google Scholar]
- Kring SC, King CS, Spindler KR. Susceptibility and signs associated with mouse adenovirus type 1 infection of adult outbred Swiss mice. J Virol. 1995;69:8084–8088. doi: 10.1128/jvi.69.12.8084-8088.1995. [DOI] [PMC free article] [PubMed] [Google Scholar]
- Kring SC, Spindler KR. Lack of effect of mouse adenovirus type 1 infection on the cell surface expression of major histocompatibility complex class I antigens. J Virol. 1996;70:5495–5502. doi: 10.1128/jvi.70.8.5495-5502.1996. [DOI] [PMC free article] [PubMed] [Google Scholar]
- Lodoen MB, Lanier LL. Natural killer cells as an initial defense against pathogens. Curr Opin Immunol. 2006;18:391–398. doi: 10.1016/j.coi.2006.05.002. [DOI] [PMC free article] [PubMed] [Google Scholar]
- Moore ML, Brown CC, Spindler KR. T cells cause acute immunopathology and are required for long-term survival in mouse adenovirus type 1-induced encephalomyelitis. J Virol. 2003;77:10060–10070. doi: 10.1128/JVI.77.18.10060-10070.2003. [DOI] [PMC free article] [PubMed] [Google Scholar]
- Moore ML, McKissic EL, Brown CC, Wilkinson JE, Spindler KR. Fatal disseminated mouse adenovirus type 1 infection in mice lacking B cells or Bruton’s tyrosine kinase. J Virol. 2004;78:5584–5590. doi: 10.1128/JVI.78.11.5584-5590.2004. [DOI] [PMC free article] [PubMed] [Google Scholar]
- Mühlen KA, Schumann J, Wittke F, Stenger S, Van Rooijen N, Van Kaer L, Tiegs G. NK cells, but not NKT cells, are involved in Pseudomonas aeruginosa exotoxin A-induced hepatotoxicity in mice. J Immunol. 2004;172:3034–3041. doi: 10.4049/jimmunol.172.5.3034. [DOI] [PubMed] [Google Scholar]
- Obar JJ, Crist SG, Leung EK, Usherwood EJ. IL-15-independent proliferative renewal of CD8+ T cells in latent gammaherpesvirus infection. J Immunol. 2004;173:2705–2714. doi: 10.4049/jimmunol.173.4.2705. [DOI] [PubMed] [Google Scholar]
- Ohteki T, Fukao T, Suzue K, Maki C, Ito M, Nakamura M, Koyasu S. Interleukin 12-dependent interferon gamma production by CD8alpha+ lymphoid dendritic cells. J Exp Med. 1999;189:1981–1986. doi: 10.1084/jem.189.12.1981. [DOI] [PMC free article] [PubMed] [Google Scholar]
- Orange JS, Fassett MS, Koopman LA, Boyson JE, Strominger JL. Viral evasion of natural killer cells. Nat Immunol. 2002;3:1006–1012. doi: 10.1038/ni1102-1006. [DOI] [PubMed] [Google Scholar]
- Peng Y, Falck-Pedersen E, Eikon KB. Variation in adenovirus transgene expression between BALB/c and C57BL/6 mice is associated with differences in interleukin-12 and gamma interferon production and NK cell activation. J Virol. 2001;75:4540–4550. doi: 10.1128/JVI.75.10.4540-4550.2001. [DOI] [PMC free article] [PubMed] [Google Scholar]
- Prlic M, Lefrancois L, Jameson SC. Multiple choices: regulation of memory CD8 T cell generation and homeostasis by interleukin (IL)-7 and IL-15. J Exp Med. 2002;195:F49–52. doi: 10.1084/jem.20020767. [DOI] [PMC free article] [PubMed] [Google Scholar]
- Puddu P, Fantuzzi L, Borghi P, Varano B, Rainaldi G, Guillemard E, Malorni W, Nicaise P, Wolf SF, Belardelli F, Gessani S. IL-12 induces IFN-gamma expression and secretion in mouse peritoneal macrophages. J Immunol. 1997;159:3490–3497. [PubMed] [Google Scholar]
- Roder J, Duwe A. The beige mutation in the mouse selectively impairs natural killer cell function. Nature. 1979;278:451–453. doi: 10.1038/278451a0. [DOI] [PubMed] [Google Scholar]
- Ruzek MC, Kavanagh BF, Scaria A, Richards SM, Garman RD. Adenoviral vectors stimulate murine natural killer cell responses and demonstrate antitumor activities in the absence of transgene expression. Molec Ther. 2002;5:115–124. doi: 10.1006/mthe.2002.0529. [DOI] [PubMed] [Google Scholar]
- Saxena RK, Saxena QB, Adler WH. Defective T-cell response in beige mutant mice. Nature. 1982;295:240–241. doi: 10.1038/295240a0. [DOI] [PubMed] [Google Scholar]
- Schluns KS, Williams K, Ma A, Zheng XX, Lefrancois L. Cutting edge: Requirement for IL-15 in the generation of primary and memory antigen-specific CD8 T cells. J Immunol. 2002;168:4827–4831. doi: 10.4049/jimmunol.168.10.4827. [DOI] [PubMed] [Google Scholar]
- Slifka MK, Pagarigan RR, Whitton JL. NK markers are expressed on a high percentage of virus-specific CD8+ and CD4+ T cells. J Immunol. 2000;164:2009–2015. doi: 10.4049/jimmunol.164.4.2009. [DOI] [PubMed] [Google Scholar]
- Smith K, Brown CC, Spindler KR. The role of mouse adenovirus type 1 early region 1A in acute and persistent infections in mice. J Virol. 1998;72:5699–5706. doi: 10.1128/jvi.72.7.5699-5706.1998. [DOI] [PMC free article] [PubMed] [Google Scholar]
- Spindler KR, Fang L, Moore ML, Brown CC, Hirsch GN, Kajon AK. SJL/J mice are highly susceptible to infection by mouse adenovirus type 1. J Virol. 2001;75:12039–12046. doi: 10.1128/JVI.75.24.12039-12046.2001. [DOI] [PMC free article] [PubMed] [Google Scholar]
- Szomolanyi-Tsuda E, Brien JD, Dorgan JE, Garcea RL, Woodland RT, Welsh RM. Antiviral T-cell-independent type 2 antibody responses induced in vivo in the absence of T and NK cells. Virology. 2001;280:160–168. doi: 10.1006/viro.2000.0766. [DOI] [PubMed] [Google Scholar]
- Usherwood EJ, Meadows SK, Crist SG, Bellfy SC, Sentman CL. Control of murine gammaherpesvirus infection is independent of NK cells. Eur J Immunol. 2005;35:2956–2961. doi: 10.1002/eji.200526245. [DOI] [PubMed] [Google Scholar]
- Van Dommelen SL, Degli-Esposti MA. NKT cells and viral immunity. Immunol Cell Biol. 2004;82:332–341. doi: 10.1111/j.0818-9641.2004.01261.x. [DOI] [PubMed] [Google Scholar]
- Wang B, Biron C, She J, Higgins K, Sunshine M-J, Lacy E, Lonberg N, Terhorst C. A block in both early T lymphocyte and natural killer cell development in transgenic mice with high-copy numbers of the human CD3E gene. Proc Natl Acad Sci USA. 1994;91:9402–9406. doi: 10.1073/pnas.91.20.9402. [DOI] [PMC free article] [PubMed] [Google Scholar]
- Wang M, Ellison CA, Gartner JG, HayGlass KT. Natural killer cell depletion fails to influence initial CD4 T cell commitment in vivo in exogenous antigen-stimulated cytokine and antibody responses. J Immunol. 1998;160:1098–1105. [PubMed] [Google Scholar]
- Welsh RM. Regulation of virus infections by natural killer cells. A review. Nat Immun Cell Growth Regul. 1986;5:169–199. [PubMed] [Google Scholar]
- Welsh RM, Dundon PL, Eynon EE, Brubaker JO, Koo GC, O’Donnell CL. Demonstration of the antiviral role of natural killer cells in vivo with a natural killer cell-specific monoclonal antibody (NK1.1) Nat Immun Cell Growth Regul. 1990;9:112–120. [PubMed] [Google Scholar]
- Welsh RM., Jr Cytotoxic cells induced during lymphocytic choriomeningitis virus infection of mice. I. Characterization of natural killer cell induction. J Exp Med. 1978;148:163–181. doi: 10.1084/jem.148.1.163. [DOI] [PMC free article] [PubMed] [Google Scholar]
- Welsh RM, Jr, Kiessling RW. Natural killer cell response to lymphocytic choriomeningitis virus in beige mice. Scand J Immunol. 1980;11:363–367. doi: 10.1111/j.1365-3083.1980.tb00001.x. [DOI] [PubMed] [Google Scholar]
- Welton AR, Chesler EJ, Sturkie C, Jackson AU, Hirsch GN, Spindler KR. Identification of quantitative trait loci for susceptibility to mouse adenovirus type 1. J Virol. 2005;79:11517–11522. doi: 10.1128/JVI.79.17.11517-11522.2005. [DOI] [PMC free article] [PubMed] [Google Scholar]
- Welton AR, Spindler KR. Capture ELISA quantitation of mouse adenovirus type 1 in infected organs. Methods Mol Biol. 2007;130:215–221. doi: 10.1385/1-59745-166-5:215. [DOI] [PubMed] [Google Scholar]
- Yokoyama WM, Kim S. Licensing of natural killer cells by self-major histocompatibility complex class I. Immunol Rev. 2006;214:143–154. doi: 10.1111/j.1600-065X.2006.00458.x. [DOI] [PubMed] [Google Scholar]
- Zuo J, Stohlman SA, Bergmann CC. IL-15-independent antiviral function of primary and memory CD8+ T cells. Virology. 2005;331:338–348. doi: 10.1016/j.virol.2004.10.035. [DOI] [PMC free article] [PubMed] [Google Scholar]
Associated Data
This section collects any data citations, data availability statements, or supplementary materials included in this article.
Supplementary Materials
Survival curve of infected C57BL/6NCr (B6), CD3εtg (CD3) and β×δ mice. Mice were infected with 102 PFU of MAV-1 and monitored daily for survival. Comparison of the survival curves of β×δ and CD3εtg mice indicated that the log rank (Mantel-Cox) chi-square statistic was 3.06, on one degree of freedom (P = 0.08) and the survival curves were not significantly different at the 5% level.