

Abstract
Iron homeostasis depends on adequate dietary copper but the mechanisms are unknown. Mice (Mus musculus) and rat (Rattus norvegicus) offspring were compared to determine the effect of dietary copper deficiency (Cu-) on iron status of plasma, liver, brain and intestine. Holtzman rat and Hsd:ICR (CD-1) outbred albino mouse dams were fed a Cu- diet and drank deionized water or Cu supplemented water. Offspring were sampled at time points between postnatal ages 13 and 32. Cu- rat and mouse pups were both anemic, but only rat pups had lower plasma and brain iron levels. Plasma iron was lower throughout the suckling period in Cu- rats but not Cu-mice. Cu- mice derived from dams restricted of Cu only during lactation were also severely anemic without hypoferremia. Intestinal metal analysis confirmed that Cu- pups had major reductions in intestinal concentration of Cu, increased Fe, and normal Zn. However, whole mouse (less the intestine) analysis demonstrated normal content of Fe indicating that the limitation in iron transport by intestinal hephaestin had no consequence to total iron reserves of the mouse. Further research will be needed to determine the reason Cu- mice were anemic since the “ferroxidase” hypothesis does not explain this phenotype.
Keywords: copper, deficient, mice, iron, intestine, brain, plasma, anemia
INTRODUCTION
Copper (Cu) and iron (Fe) are two transition metals that are essential dietary components to ensure sufficient supply to meet demands of cell growth, differentiation, and optimal function. Both Cu and Fe are redox active metals. This characteristic is required for function but also leads to potentially toxic environments if levels are too high. Both cuprous ion and ferrous ion react vigorously with hydrogen peroxide to form hydroxyl radical (Prohaska, 1997). Thus, mammalian cells contain exquisite protein machinery to facilitate transport (Fe) and excretion (Cu) to maintain homeostasis (Prohaska, 2006; Andrews and Schmidt, 2007).
Despite having unique physiological functions with unique protein partners (apo-enzymes) there is a nutritional interaction between Cu and Fe. Dietary deficiency of either metal leads to anemia and higher liver concentration of the other metal. Mechanisms for this are not known. Credit for the discovery of a role for Cu in normal hemoglobin production dates to early seminal rat work at the University of Wisconsin (Hart et al., 1928). However, a role for Cu in explaining anemia was suggested in humans 80 years earlier (Fox, 2003). Both Cu and Fe deficiency lead to hypochromic anemia in mammals (Lahey et al., 1952). The mechanism is not simple.
Classical work from Cartwright, Wintrobe and coworkers in swine made the observation that Cu deficiency impaired Fe release into the circulation from intestine, liver, and macrophage stores (Gubler et al., 1952). The most popular theory that connects this observation with Cu suggests that Fe release is dependent on enzymatic oxidation of Fe2+ by a “ferroxidase.” This was suggested originally to be a function of ceruloplasmin (Cp), a plasma cuproprotein (Osaki et al., 1966). Later, an intestinal Cp homologue, hephaestin, was described that carries out this function in enterocytes. Mice with a translocation mutation of hephaestin develop anemia and intestinal Fe accumulation (Vulpe et al., 1999). Recently, reduction in hephaestin function leading to lower plasma Fe was suggested to explain the anemia of Cu deficiency in mice (Chen et al., 2006).
However, there are some observations that do not support the “ferroxidase” theory in mice that plasma iron is limiting in Cu deficiency. Young suckling mice at postnatal age 11–12 (P11–12) are anemic but have normal plasma ferroxidase activity (Prohaska, 1981). Mice lacking ceruloplasmin (Cp −/−) are not usually anemic and often have normal plasma iron despite elevated hepatic iron (Harris et al., 1999). In suckling rats Cu deficiency is associated with anemia, lower plasma Fe, and lower brain Fe (13). However, P11–12 Cu deficient mice are anemic but have elevated brain Fe (Prohaska, 1983). Humans with frank copper deficiency and anemia can have normal plasma iron (Miyoshi et al., 2004).
Current experiments were designed to compare neonatal rats and mice regarding anemia, plasma Fe, and brain Fe content. Hephaestin function, iron export, was evaluated by determination of intestinal Fe content and comparing Fe content in the remainder of the mouse following Cu deficiency anemia.
MATERIALS AND METHODS
Animal Care and Diets
Pregnant Holtzman (Rattus norvegicus) rats and pregnant Hsd:ICR (CD-1) outbred albino mice (Mus musculus) were purchased commercially (Harland Sprague Dawley, Indianapolis, IN, USA). Rodents were offered a copper-deficient diet (Teklad Laboratories, Madison, WI, USA) similar to the AIN-76A diet but modified by omitting cupric carbonate from the AIN-76A mineral mix as described previously (Prohaska and Brokate, 2002). This diet contained 0.36 mg Cu/kg and 53 mg Fe/kg by chemical analysis. Copper adequate (Cu+) rodents were given deionized water with copper sulfate (20mg Cu/L) to drink. Copper deficient (Cu-) rodents drank copper-free deionized water.
Two nutritional paradigms of copper limitation were used in these studies: a gestation/lactation and lactation model. In the gestation/lactation rat model, dams were placed on the treatment diet at embryonic day 7 (E7) similar to established recent protocols (Prohaska and Gybina, 2005). In the gestation/lactation mouse model, dams were placed on the treatment diet at E17 according to established protocols (Prohaska and Brokate, 2002). Dams that underwent the lactation model were placed on diet at P0. On postnatal day 2 (P2), litter sizes were culled to ten pups. At P20, pups were weaned and placed on the same dietary treatment as their dams. In all experiments, pups, one per litter, were sampled at specific ages. All animals had free access to diet and drinking water and were maintained at 24oC with 55% relative humidity on a 12-hour light cycle (0700-1900 h light). All protocols were approved by the University of Minnesota Animal Care Committee. Male offspring from the rat experiments were sampled at P13, P20, and P26.
Male offspring from the gestation/lactation mouse experiments were sampled at P16, P19, and P27. Male mice from the lactation experiment were sampled at P27 and P32. Following weighing rat pups and mice were lightly anesthetized with diethyl ether and killed by decapitation. In rats, blood, livers, and brains were harvested. In mice, intestines, livers, brains, and blood were harvested. Trunk blood was collected in a heparinized tube. All rat brains were dissected with cerebellums and medulla/pons regions removed before metal analysis. Mouse brains were dissected at P27 with medulla/pons removed before metal digestion while at P16 and P19 mouse brains were halved before metal analysis. For whole body metal analyses, mice were anesthetized and killed by cervical dislocation to avoid bleeding. Fecal material and digesta were removed from intestine (pyloric sphincter to annus) prior to digestion and metal analyses. The remainder of the mouse was digested following guidelines of others (Failla and Seidel, 1988).
Biochemical Analyses
Hemoglobin was determined spectrophotometrically as metcyanhemoglobin (Prohaska, 1983). Plasma activity of the cuproprotein ceruloplasmin (EC 1.16.3.1) was measured by following oxidation of o-dianisidine at 37°C (Prohaska, 1991). Tissues and diet were wet-digested with HNO3 (Trace Metal Grade, Fischer Scientific, Pittsburg, PA, USA) and residue was dissolved in 0.1 mol/L HNO3. Whole mouse carcasses less the intestinal tract were wet-digested with HNO3 and hydrogen peroxide. Samples were analyzed for metals by flame atomic absorption spectroscopy (AAS) (model 1100 B, Perkin-Elmer, Wellesley, MA, USA). Brain iron values for rats were corrected for blood contamination as described elsewhere and the method was developed for mice (Prohaska and Gybina, 2005).
Plasma iron was measured by flame AAS following treatment with trichloroacetic acid (TCA) (Olson and Hamlin, 1969). Briefly, plasma was treated with one volume of 20 % (w/v) TCA and heated to precipitate contaminating hemoglobin and release transferrin bound iron. More than 95% of hemoglobin bound iron is removed by this technique. Following centrifugation, the supernatant was diluted with 5 volumes of water and then analyzed by AAS. To confirm the validity of the TCA method, selected plasma samples were also analyzed for iron using Ferene-S, a spectrophotometric method (Eskelinen et al., 1983).
PCR Methods
Enterocytes were isolated from the upper small intestine of four P27 male Cu- and Cu+ mice using an EDTA treatment method (Chen et al., 2003). Total RNA was isolated and purity established spectrophotometrically and by RNA gels (Prohaska and Brokate, 1999). The mRNA content of enterocyte ferroportin (Fpn) and glyceraldehyde 3-phosphate dehydrogenase (Gapdh), used as a control, was determined by qRT-PCR using a Roche Light Cycler™. Mouse Fpn primer pairs were 5’ AAC CAG AGT CAC TGT CAT CAG CCA 3’ (forward) and 5’ TCG GCC CAA GTC AGT GAA GGT AAA 3’ (reverse). Gapdh primer pairs were 5’ TTC CTA CCC CCA ATG TAT CCG 3’(forward) and 5’ ACC ACC CTG TTG CTG TAG CCA 3’ (reverse). cDNA was synthesized using Omniscript Reverse Transcripase (Qiagen) and amplified with a Roche SYBR Green I kit. The mouse Fpn primers amplified a DNA product with Tm of 85° C.
Statistical Analysis
Dietary treatment effects were evaluated by Student’s t-test after variance equality was established by F-test, α = 0.05. Data were analyzed using Microsoft Excel™.
RESULTS
Brain Iron
Knowing the hemoglobin concentration one can correct the apparent brain iron for blood iron contamination and not have to perfuse the animal (Prohaska Gybina 2005). To establish a method for measuring brain iron in mice that was successful in rats, 16 P31 male mice were studied. Half were Cu- and half Cu+. Half of the mice were perfused transcardially with metal free saline to remove blood from brain prior to wet digestion. The other half of mice were decapitated and brains and a sample of blood were analyzed for total iron. There was a strong correlation between blood hemoglobin and blood iron in the eight non-perfused mice in which hemoglobin values ranged between 21.3 to 152 g/L (R=0.992). The linear relationship was [blood hemoglobin (g/L) = 0.382 (blood iron (μg/g) − 6.786]. The estimated blood iron contamination of brain averaged 0.57% for both Cu- and Cu+ mice.
P27 male rats and mice were next compared for brain iron content and correlation to degrees of iron deficiency as estimated by hemoglobin content (Fig. 1). Mice and rats were nursed by dams started on treatment during gestation, rats E7 and mice E17. Compared to Cu+ control rodents both Cu- mice and rats were very anemic but only in Cu- rats was there a significant reduction in brain iron concentration.
Fig. 1.
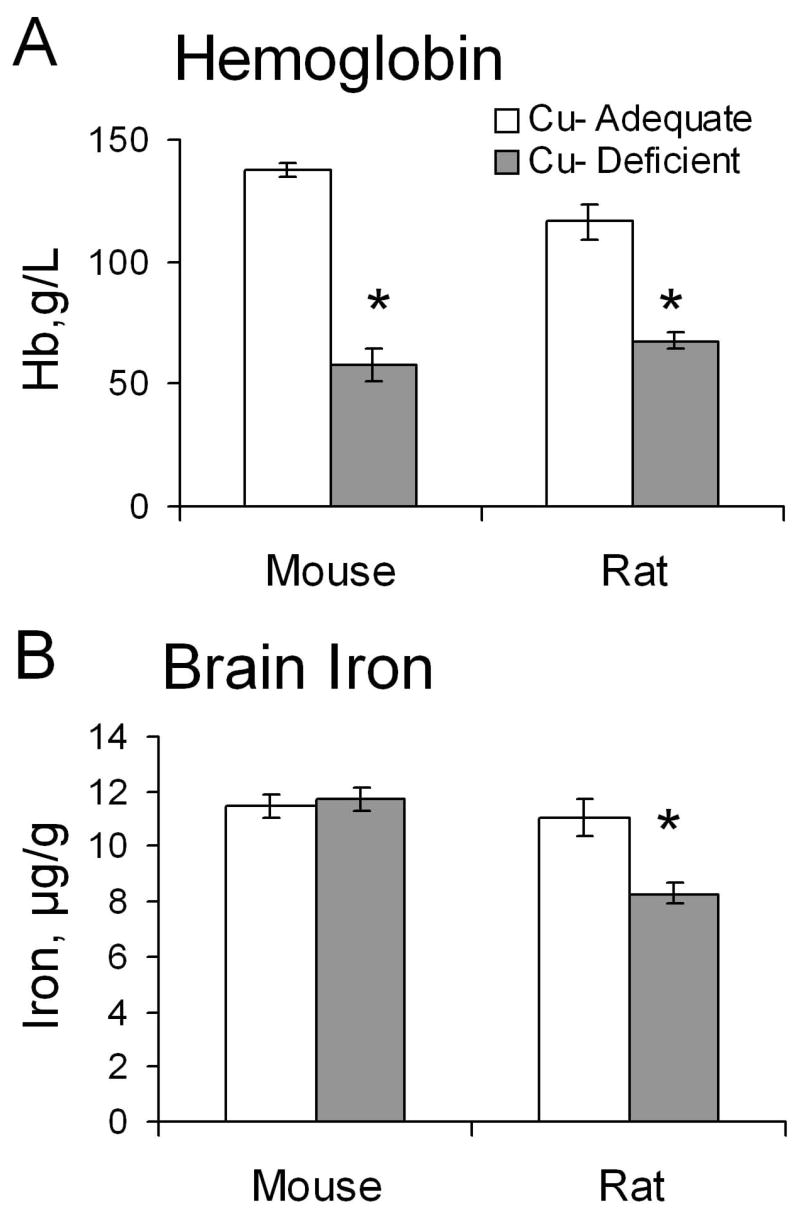
Effect of Cu deficient treatment on hemoglobin (A) and brain iron (B) concentrations in Cu+ and Cu- P27-26 weanling mice and rats. Each bar represents the mean ± SEM (n=3–6). * Indicates a significant difference from Cu+, P < 0.05 (Student’s t-test).
Other biochemical characteristics of these Cu- rodents were similar as severe reductions in liver and brain copper concentration and plasma ceruloplasmin activity were evident (Table 1). Cu- rats and mice were both smaller than Cu+ controls. Liver iron concentration was twice as high in Cu- than Cu+ mice but not different in concentration in Cu- rats (Table 1).
TABLE 1.
Characteristics of CD-1 Mouse and Holtzman Rat Pups
| Characteristic | Diet | Rat | Mouse | Mouse-2 |
|---|---|---|---|---|
| P26 | P27 | P27 | ||
| Body mass, g | Cu+ | 91.1 ± 3.4 | 19.9 ± 0.7 | 21.8 ± 1.0 |
| Cu− | 72.7 ± 6.2* | 16.1 ± 1.8* | 14.5 ± 1.0* | |
| Cp, units/L | Cu+ | 74.2 ± 9.22 | 39.6 ± 2.03 | 40.0 ± 3.53 |
| Cu− | 0.85 ± 0.62* | 0.04 ± 0.03* | 0.13 ± 0.04* | |
| Liver Cu, μg/g | Cu+ | 6.53 ± 0.15 | 4.27 ± 0.13 | 3.62 ± 1.09 |
| Cu− | 0.37 ± 0.05* | 1.38 ± 0.13* | 1.09 ± 0.06* | |
| Liver Fe, μg/g | Cu+ | 68.9 ± 3.1 | 111 ± 13.4 | 112 ± 19.3 |
| Cu− | 60.3 ± 3.8 | 231 ± 19.4* | 386 ± 73.9* | |
| Brain Cu, μg/g | Cu+ | 2.61 ± 0.05 | 3.12 ± 0.13 | 2.39 ± 0.13 |
| Cu− | 0.43 ± 0.05* | 0.59 ± 0.03* | 0.55 ± 0.04* |
Values are means ± SEM. Male rat pups (n = 3-4) and male mouse pups (n=5-6) were used. Mouse-2 was a Lactational Model only. Body mass (wt), ceruloplasmin (Cp), liver copper, liver iron and brain copper were determined as described in Methods.
Difference from Cu-Adequate (Cu+) at same age, P < 0.05 (Student’s t-test).
Plasma Iron Comparison
The TCA atomic absorption method (AAS) of measuring plasma iron was compared to a spectrophotometric method using ferrene S. Eight plasma samples were compared, 4 Cu- adult female rats and 4 Cu+ adult female rats differing by 50% in plasma iron concentration based on the AAS method. There was no difference between the two plasma iron methods. The pooled mean ± sem for the AAS/spectrophotometric methods was 0.94 ± 0.04.
Plasma iron was determined using the AAS method in rats and mice at three time points during development in an attempt to understand the brain iron differences between Cu- rats and mice (Fig. 1). Pups were sampled during suckling, at weaning, and after approximately one week of eating solid food with ten times higher iron than milk (Fig. 2). At all three ages, there was a marked reduction in plasma iron content of Cu- rats compared to Cu+ pups but no impact of Cu deficiency on plasma iron concentration in Cu- mice. Biochemical evaluation of Cu- mice yielded data similar to data in Table 1 at P27 and indicated severe Cu deficiency (data not shown).
Fig. 2.

Effect of Cu deficient treatment during development on plasma iron concentrations in Cu+ and Cu- rats (A) and mice (B). Treatment began at E7 for rats and E17 for mice. Each bar represents means ± SEM (n=3–5). * Indicates a significant difference from Cu+, P < 0.05 (Student’s t-test).
Lactational Copper Deficiency in Mice
To extend and confirm the observations of Cu deficiency in mice nursed by dams starting at E17, a second experiment was conducted in mice by restriction of Cu to the dams starting at parturition. At P27, Cu- pups were very Cu deficient and comparable to P27 mice restricted even earlier (E17) (Table 1 compare two mouse models). The P27 Cu- male mice were very anemic but had no change in plasma iron and elevated, rather then reduced, brain iron concentration (Fig. 3).
Fig. 3.

Effects of Cu deficient treatment during lactation plus postweaning on mouse hemoglobin (A), plasma iron (B), and brain iron (C) concentrations in P27 mice. Each bar represents means ± SEM (n=5–6). * Indicates a significant difference from Cu+, P < 0.05 (Student’s t-test).
Intestine and Whole Mouse Metal Analysis
Additional male mice from the lactational model (P32) were killed by cervical dislocation to avoid bleeding and the entire intestine, with digesta removed, was analyzed for total copper, iron, and zinc. Zinc was included to serve as metal we suspected of not changing due to copper deficiency. The remainder of the mouse was then wet digested and analyzed for the same three metals.
Data (intestine or mouse) were expressed both per gram, since the Cu- mice weighed 68% of Cu+ mice on average, and per intestine or mouse for comparison. The copper concentration, expressed either way, was significantly lower in intestine of Cu- mice compared to controls (Fig. 4). Iron concentration, μg/g, was higher in Cu- compared to Cu+ mice whereas zinc concentration was equivalent in both groups of mice.
Fig. 4.

Effects of Cu deficient treatment during lactation plus postweaning on intestinal content and concentrations of copper (A,B), iron (C,D), and zinc (E,F) in Cu+ and Cu- P32 mice. Each bar represents means ± SEM (n=4). * Indicates a significant difference from Cu+, P < 0.05 (Student’s t-test).
However, when comparing the iron content (per mouse) or concentration (μg/g) of the remainder of the mouse there was no significant difference between Cu- and Cu+ mice (Fig. 5). However, there was a tendency (P >0.05 but < 0.10) for iron content to be lower and iron concentration higher. Copper content and concentration, as expected, were significantly lower in Cu- mice than Cu+ controls. Zinc content reflected the smaller Cu- mice but zinc concentration was equivalent between Cu+ and Cu- mice (Fig. 5). Though we were unable to measure hemoglobin on these P32 male mice, hemoglobin data on their littermate brothers one day earlier P31 suggested severe anemia. Cu- mice hemoglobin, g/L, averaged 41.2 ± 14.7 (n=4) compared to 148 ± 2.2 (n=4) for Cu+ mice, P < 0.01.
Fig. 5.

Effects of Cu deficient treatment during lactation plus postweaning on whole mouse (less the intestine) content and concentrations of copper (A,B), iron (C,D), and zinc (E,F) in Cu+ and Cu- P32 mice. Each bar represents means ± SEM (n=4). * Indicates a significant difference from Cu+, P < 0.05 (Student’s t-test).
Ferroportin
To evaluate the possibility that intestinal iron elevation in Cu- mice might be due low ferroportin rather than hephaestin limitation, enterocytes were harvested from the upper small intestine of P27 male mice in model 1 (Table 1). The Fpn/Gapdh mRNA content was determined by qRT-PCR. The Fpn/Gapdh content of mouse enterocytes was not impacted by dietary treatment, Cu- 10.0 ± 2.58 versus Cu+ 9.29 ± 0.80, P > 0.05.
DISCUSSION
One of the greatest risks of perinatal copper deficiency is that brain development may be irreversibly damaged (Prohaska and Hoffman, 1996). The possibility that perinatal copper deficiency can result in perinatal iron deficiency further underscores this risk (Prohaska and Gybina, 2005). Data in the current studies confirm that brain iron is lower in Cu- rats following gestational/lactational copper deficiency. Interestingly, this was not true for Cu- mice even though brain copper levels were reduced to the same extent as Cu- rats. Although, in the current studies restriction of copper in mice began only shortly before birth, prior studies with full gestational copper deprivation also failed to show a reduction in brain iron in suckling mouse pups despite severe copper deficiency (Prohaska, 1983). Furthermore, previous comparisons of Cu- rat and mouse dams showed that mouse dams were equally, if not more, copper deficient compared to rats following the same nutritional protocols used in the current studies (Prohaska and Broderius, 2006).
Why is brain iron lower in Cu- rats but not Cu- mice? Data in the current experiments suggest that a simple difference, plasma iron concentration, may be the explanation. Iron levels measured at three ages of early development indicated marked reductions in plasma iron in Cu-rats and no changes in Cu- mice. Current mouse plasma iron data conflict with others studying copper deficiency(Chen et al., 2006). Perhaps age and mouse strain may be a factor as the other study reported data on six week old C57BL mice. Furthermore, we have detected lower plasma iron in older Cu- mouse dams. Means (μg/mL) ± sem (n=6) of Cu+ dams were 3.99 ± 0.44 compared to Cu- dams 2.47 ± 0.12, P < 0.01. Whereas we can only speculate as to whether copper-deficient human infants have lower brain iron, they do have lower plasma iron levels in many cases (Brubaker and Sturgeon, 1956; Naveh et al., 1981).
In the current experiments, copper deficiency imposed during lactation and post-lactation in CD-1 mice also resulted in Cu- mice with severe anemia but no change in plasma or brain iron concentration. These mice were only four weeks of age compared to six weeks in the study by others with C57BL mice (Chen et al., 2006). Collectively, data in the current experiments suggest that reduction in brain iron during perinatal copper deficiency is associated with a reduction in plasma iron.
However, since both Cu- rats and mice are severely anemic yet have vastly different plasma iron responses, the anemia associated with copper deficiency cannot be a simple reduction in plasma iron availability for bone marrow. Some have argued that iron release from storage compartments is responsible for the anemia of copper deficiency (Gubler et al., 1952; Osaki et al., 1966). If this were true, then Cp (ferroxidase) null mice (Cp−/−) should have low plasma iron and be very anemic. Though sometimes mild anemia has been noted in knockout mice, the seminal work on Cp −/− mice reported no change in hemoglobin levels or plasma iron concentrations (Harris et al., 1999). Our current studies with two models of Cu- P27 mice and other studies, including Cp −/− mice, indicate that liver iron is higher in mice with low Cp activity. However, spleen iron is actually lower in Cu- mice with 98% lower Cp activity (Prohaska and Lukasewycz, 1990). Splenic macrophages recycle red cell iron and should depend on ferroxidase for release. Some published data support the idea that mouse plasma “ferroxidase” activity is not impacted by copper deficiency (Prohaska, 1981). This may explain why a normal plasma iron can exist even when Cp function is impaired as in Cp−/− mice and Cu- pups.
Some argue that anemia of copper deficiency is caused by a block in iron uptake because of lower hephaestin levels and activity (Reeves et al., 2005; Chen et al., 2006). This hypothesis is based upon data that indicate higher intestinal iron in Cu- rodents. In suckling Cu- rats we recently reported that small intestinal iron elevation was not always detected whereas lower hemoglobin was, suggesting a disconnect between anemia and intestinal iron overload (Pyatskowit and Prohaska, 2008). Results in the current studies do support the contention that iron is higher in the intestinal tissue in Cu- mice. Importantly, the same Cu- mice, however, had no overall limitation in iron content, strongly suggesting that reduced hephaestin function is not totally responsible for the anemia of copper deficiency. Others have also reported no change in whole animal iron content following dietary copper deficiency in rats (Failla and Seidel, 1988). Contrary opinions are based on older C57BL Cu- male mice (Chen et al., 2006). However, data from this lab published previously on C57BL mice treated with the same diet and paradigm failed to detect an iron overload in small intestine in anemic Cu- mice (Prohaska and Lukasewycz, 1990). Thus, it seems unlikely that loss of ceruloplasmin or hephaestin function can explain the severe anemia of copper deficiency. Current data support the hypothesis that the anemia is not due to iron limitation but rather to iron utilization (Goodman and Dalman, 1969). This is borne out by several studies in which iron injections failed to raise hemoglobin levels in Cu- rodents (Williams et al., 1983; Prohaska et al., 1985; Reeves and DeMars, 2006). In contrast, iron injection of Cu- suckling pups did correct the hemoglobin deficit (Prohaska, 1984). Thus, it is possible that Cu- suckling mammals are iron deficient (Pyatskowit and Prohaska, 2008). Supportive evidence of this idea was the observation that liver iron is lower in Cu- rodents at P3 (Prohaska and Broderius, 2006). Others have also recently shown that fetal liver iron is lower in Cu- rat pups (Andersen et al., 2007). Future research will be needed to confirm this supposition and to determine the extent to which the phenotype of perinatal copper deficiency is due to iron limitation.
Acknowledgments
This study was supported by NIH grant HD 39708. Technical assistance of Margaret Broderius and Anna Gybina is greatly appreciated.
Footnotes
Publisher's Disclaimer: This is a PDF file of an unedited manuscript that has been accepted for publication. As a service to our customers we are providing this early version of the manuscript. The manuscript will undergo copyediting, typesetting, and review of the resulting proof before it is published in its final citable form. Please note that during the production process errors may be discovered which could affect the content, and all legal disclaimers that apply to the journal pertain.
References
- Andersen HS, Gambling L, Holtrop G, McArdle HJ. Effect of dietary copper deficiency on iron metabolism in the pregnant rat. Br J Nutr. 2007;97:239–246. doi: 10.1017/S0007114507239960. [DOI] [PubMed] [Google Scholar]
- Andrews NC, Schmidt PJ. Iron homeostasis. Annu Rev Physiol. 2007;69:69–85. doi: 10.1146/annurev.physiol.69.031905.164337. [DOI] [PubMed] [Google Scholar]
- Brubaker C, Sturgeon P. Copper deficiency in infants; a syndrome characterized by hypocupremia, iron deficiency anemia, and hypoproteinemia. AMA J Dis Child. 1956;92:254–265. [PubMed] [Google Scholar]
- Chen H, Huang G, Su T, Gao H, Attieh ZK, McKie AT, Anderson GJ, Vulpe CD. Decreased hephaestin activity in the intestine of copper-deficient mice causes systemic iron deficiency. J Nutr. 2006;136:1236–1241. doi: 10.1093/jn/136.5.1236. [DOI] [PubMed] [Google Scholar]
- Chen H, Su T, Attieh ZK, Fox TC, McKie AT, Anderson GJ, Vulpe CD. Systemic regulation of Hephaestin and Ireg1 revealed in studies of genetic and nutritional iron deficiency. Blood. 2003;102:1893–1899. doi: 10.1182/blood-2003-02-0347. [DOI] [PubMed] [Google Scholar]
- Eskelinen S, Haikonen M, Raisanen S. Ferene-S as the chromogen for serum iron determinations. Scand J Clin Lab Invest. 1983;43:453–455. [PubMed] [Google Scholar]
- Failla ML, Seidel KE. Total body content of copper and other essential metals in rats fed fructose or starch. Nutr Res. 1988;8:1379–1389. [Google Scholar]
- Fox PL. The copper-iron chronicles: the story of an intimate relationship. Biometals. 2003;16:9–40. doi: 10.1023/a:1020799512190. [DOI] [PubMed] [Google Scholar]
- Goodman JR, Dalman PR. Role of copper in iron localization in developing erythrocytes. Blood. 1969;34:747–753. [PubMed] [Google Scholar]
- Gubler CJ, Lahey ME, Chase MS, Cartwright GE, Wintrobe MM. Studies on copper metabolism. III The metabolism of iron in copper deficient swine. Blood. 1952;7:1075–1092. [PubMed] [Google Scholar]
- Harris ZL, Durley AP, Man TK, Gitlin JD. Targeted gene disruption reveals an essential role for ceruloplasmin in cellular iron efflux. Proc Natl Acad Sci U S A. 1999;96:10812–10817. doi: 10.1073/pnas.96.19.10812. [DOI] [PMC free article] [PubMed] [Google Scholar]
- Hart EB, Steenbock H, Waddell JECA. Copper as a supplement to iron for hemoglobin building in the rat. J Biol Chem. 1928;77:797–812. [PubMed] [Google Scholar]
- Lahey ME, Gubler CJ, Chase MS, Cartwright GE, Wintrobe MM. Studies on copper metabolism. II Hematologic manifestations of copper deficiency in swine. Blood. 1952;7:1053–1074. [PubMed] [Google Scholar]
- Miyoshi I, Saito T, Iwahara Y. Copper deficiency anaemia. Br J Haematol. 2004;125:106. doi: 10.1046/j.1365-2141.2004.04724.x. [DOI] [PubMed] [Google Scholar]
- Naveh Y, Hazani A, Berant M. Copper deficiency with cow's milk diet. Pediatrics. 1981;68:397–400. [PubMed] [Google Scholar]
- Olson AD, Hamlin WB. A new method for serum iron and total iron-binding capacity by atomic absorption spectrophotometry. Clin Chem. 1969;15:438–444. [PubMed] [Google Scholar]
- Osaki S, Johnson DA, Frieden E. The possible significance of the ferrous oxidase activity of ceruloplasmin in normal human serum. J Biol Chem. 1966;241:2746–2751. [PubMed] [Google Scholar]
- Prohaska J, Bailey W, Cox D. Failure of iron injection to reserve copper-dependent anemia in mice. In: Mills CF, Bremner I, Chesters JK, editors. Trace elements in Man and Animals. TEMA 5. Commonwealth Agricultural Bureaux; Farnham Royal, Slough, UK: 1985. pp. 27–32. [Google Scholar]
- Prohaska JR. Comparison between dietary and genetic copper deficiency in mice: copper-dependent anemia. Nutr Res. 1981;1:159–167. [Google Scholar]
- Prohaska JR. Changes in tissue growth, concentrations of copper, iron, cytochrome oxidase and superoxide dismutase subsequent to dietary or genetic copper deficiency in mice. J Nutr. 1983;113:2048–2058. doi: 10.1093/jn/113.10.2048. [DOI] [PubMed] [Google Scholar]
- Prohaska JR. Repletion of copper-deficient mice and brindled mice with copper or iron. J Nutr. 1984;114:422–430. doi: 10.1093/jn/114.2.422. [DOI] [PubMed] [Google Scholar]
- Prohaska JR. Changes in Cu, Zn-superoxide dismutase, cytochrome c oxidase, glutathione peroxidase and glutathione transferase activities in copper- deficient mice and rats. J Nutr. 1991;121:355–363. doi: 10.1093/jn/121.3.355. [DOI] [PubMed] [Google Scholar]
- Prohaska JR. Neurochemical roles of copper as antioxidant or prooxidant. In: Connor JR, editor. Metals and Oxidative Damage in Neurological Disorders. Plenum Press; New York, NY: 1997. pp. 57–75. [Google Scholar]
- Prohaska JR. Copper. In: Bowman BA, Russell RM, editors. Present Knowledge In Nutrition. Vol. 1. International Life Sciences Institute; Washington, DC: 2006. pp. 458–470. [Google Scholar]
- Prohaska JR, Broderius M. Plasma peptidylglycine alpha-amidating monooxygenase (PAM) and ceruloplasmin are affected by age and copper-status in rats and mice. Comp Biochem Physiol Part B. 2006;143:360–366. doi: 10.1016/j.cbpb.2005.12.010. [DOI] [PMC free article] [PubMed] [Google Scholar]
- Prohaska JR, Brokate B. Copper deficiency alters rat dopamine beta-monooxygenase mRNA and activity. J Nutr. 1999;129:2147–2153. doi: 10.1093/jn/129.12.2147. [DOI] [PubMed] [Google Scholar]
- Prohaska JR, Brokate B. The timing of perinatal copper deficiency in mice influences offspring survival. J Nutr. 2002;132:3142–3145. doi: 10.1093/jn/131.10.3142. [DOI] [PubMed] [Google Scholar]
- Prohaska JR, Gybina AA. Rat brain iron concentration is lower following perinatal copper deficiency. J Neurochem. 2005;93:698–705. doi: 10.1111/j.1471-4159.2005.03091.x. [DOI] [PMC free article] [PubMed] [Google Scholar]
- Prohaska JR, Hoffman RG. Auditory startle response is diminished in rats after recovery from perinatal copper deficiency. J Nutr. 1996;126:618–627. doi: 10.1093/jn/126.3.618. [DOI] [PubMed] [Google Scholar]
- Prohaska JR, Lukasewycz OA. Effects of copper deficiency on the immune system. Adv Exp Med Biol. 1990;262:123–143. doi: 10.1007/978-1-4613-0553-8_11. [DOI] [PubMed] [Google Scholar]
- Pyatskowit JW, Prohaska JR. Multiple mechanisms account for lower plasma iron in young copper deficient rats. Biometals. 2008 doi: 10.1007/s10534-007-9123-6. in press. [DOI] [PMC free article] [PubMed] [Google Scholar]
- Reeves PG, DeMars LC. Signs of iron deficiency in copper-deficient rats are not affected by iron supplements administered by diet or by injection. J Nutr Biochem. 2006;17:635–642. doi: 10.1016/j.jnutbio.2006.04.004. [DOI] [PubMed] [Google Scholar]
- Reeves PG, Demars LC, Johnson WT, Lukaski HC. Dietary copper deficiency reduces iron absorption and duodenal enterocyte hephaestin protein in male and female rats. J Nutr. 2005;135:92–98. doi: 10.1093/jn/135.1.92. [DOI] [PubMed] [Google Scholar]
- Vulpe CD, Kuo YM, Murphy TL, Cowley L, Askwith C, Libina N, Gitschier J, Anderson GJ. Hephaestin, a ceruloplasmin homologue implicated in intestinal iron transport, is defective in the sla mouse. Nat Genet. 1999;21:195–199. doi: 10.1038/5979. [DOI] [PubMed] [Google Scholar]
- Williams DM, Kennedy FS, Green BG. Hepatic iron accumulation in copper-deficient rats. Br J Nutr. 1983;50:653–660. doi: 10.1079/bjn19830136. [DOI] [PubMed] [Google Scholar]