Abstract
Plasmids that contain synthetic genes coding for small oligoribonucleotides called external guide sequences (EGSs) have been introduced into strains of Escherichia coli harboring antibiotic resistance genes. The EGSs direct RNase P to cleave the mRNAs transcribed from these genes thereby converting the phenotype of drug-resistant cells to drug sensitivity. Increasing the EGS-to-target mRNA ratio by changing gene copy number or the number of EGSs complementary to different target sites enhances the efficiency of the conversion process. We demonstrate a general method for the efficient phenotypic conversion of drug-resistant bacterial cultures.
Keywords: bacterial drug resistance, external guide sequences, RNase P
Drug resistance in pathogenic bacteria is a problem of major clinical importance. Under suitable selective conditions, plasmids carrying genes for drug resistance spread rapidly through both animal and human populations. The standard approach to this problem has been to seek new drugs to which the bacteria are sensitive, an expensive and time-consuming process. To complicate matters, bacteria continue to mutate, acquiring resistance to newly developed drugs. We have explored a general method of converting the phenotype of drug-resistant bacteria to drug sensitivity. At the foundation of this method is a means of reducing the amount of translatable mRNA encoding drug resistance per se.
In our method, external guide sequences (EGSs; ref. 1) are designed to form hydrogen-bonded complexes with the mRNAs encoded by genes responsible for drug resistance, those coding for chloramphenicol acetyl transferase (cat; CmR) or β-lactamase (bla; AmpR) in the cases we describe here. When the complexes are formed, they are recognized as substrates by the endogenous, essential endoribonuclease RNase P (2), and the targeted mRNA is cleaved and inactivated, thereby rendering the host cells drug-sensitive. Previously, this technology has been used successfully to decrease levels of gene expression 50–80% in both bacteria (3–5) and mammalian cells in tissue culture (6, 7). Examples of complete phenotypic conversion in populations of drug-resistant Escherichia coli are offered in this report.
MATERIALS AND METHODS
Bacterial Strains, EGS Genes, and Plasmids.
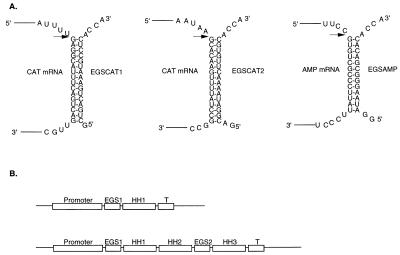
The host bacterial strain for the experiments reported here was BL21(DE3), F−ompT[lon]hsdSB (rB−⋅mB−, an E. coli B strain) with DE3, a λ prophage carrying the T7 RNA polymerase gene (8). EGSs were constructed as follows: EGSs directed against CmR (GCTGACTGAAATGCCTCACCA and GACGGATAAAACTTGTGCACCA) or AmpR (GGATAAGGGCGACACACCA) were designed (Fig. 1A) to hydrogen-bond to 16 bp (positions 67–82 and 156–171 in the coding region of the cat gene) and 13 bp (positions 20–32 in the coding region of the bla gene), respectively, in the appropriate target mRNA to make a structure that resembles the aminoacyl stem of a tRNA and that terminates in the sequence CCA, which is common to all tRNAs. For all EGSs constructed under T7 RNA polymerase control, inserts were cloned into pUC19 as described previously (see ref. 4). After cloning into the pUC vector, DNAs from transformants obtained were sequenced to verify that the proper sequence was present. The plasmids obtained were pT7EGSCAT1, pT7EGSCAT2, and pT7EGSAMP. To obtain EGSs under the control of an E. coli promoter, EGS and hammerhead (HH1) sequences were cloned between the BamHI and HindIII sites of pKB283 (N. Lawrence and S. Altman, unpublished work), which is a derivative of pUC19 with a 283-bp KpnI–BamHI insert that contains the promoter region for the gene encoding M1 RNA (rnpB). The T7 terminator sequence was then replaced by an M1 terminator sequence obtained from the plasmid pM1P (9). Plasmid pACYC184 was obtained from New England Biolabs.
Figure 1.
(A) Structure of external guide sequences directed against mRNAs encoded by the cat (EGSCAT1, EGSCAT2) and bla (EGSAMP) genes. Only a segment of each mRNA, to which the EGS hybridizes, is shown. The arrows indicate the sites of cleavage by RNase P. (B) Schematic representation of synthetic genes for either one EGS alone or two EGSs in tandem. HH1, HH2, and HH3, hammerhead sequences; T, terminator sequence. The promoter and terminator sequences are derived either from phage T7 or E. coli in our experiments (see text).
To make the plasmid pKBEGSCAT1+2, an EcoRI–BamHI insert that contained the M1 RNA promoter region followed by EGSCAT1 and HH1 sequences was ligated to annealed oligonucleotides corresponding to HH2 (with BamHI and SalI sites at its 5′ and 3′ ends, respectively), EGSCAT2 (with SalI and BstEII sites at its 5′ and 3′ ends, respectively), HH3 (with a BstEII site at its 5′ end and the first 3 bp corresponding to a SnaB I site at its 3′ end), and the M1 terminator (with the last 3 bp corresponding to a SnaB I site at its 5′ end and a HindIII site at its 3′ end). All of these fragments were cloned into pUC 19, which had been digested with EcoRI and HindIII. To obtain pKBEGSCAT2, annealed oligonucleotides corresponding to EGSCAT2, HH3, and M1 terminator were cloned between the BamHI and HindIII sites of pKB283. The transformants obtained were subjected to sequence analysis to verify that the expected sequences were present.
Growth Rates in Liquid Culture.
Studies of the growth of cells transformed with various plasmids were carried out as follows: overnight cultures of BL2(DE3) cells (harboring two plasmids: pACYC184 and pT7EGSCAT1 or pT7EGSAMP or pNT7APHH) in LBCarb/Cm (Luria–Bertani medium supplemented with 50 μg/ml carbenicillin and 5 μg/ml chloramphenicol) were diluted to A600 = 0.05 in LBCarb/Cm, and the cultures were incubated at 37°C. Cell growth was followed by measuring A600. Cells were diluted and plated on LB plates, LBAmp (100 μg/ml) plates, and LB plates containing various concentrations of chloramphenicol.
Preparation of Transcripts for Assays in Vitro.
A fragment (225 nt) of CAT mRNA was prepared by transcription in vitro with T7 RNA polymerase using a PCR amplification product of CAT DNA as template. To prepare the DNA that contained the first 225 nt of the cat gene, pACYC184 DNA was used as template with the following primers: 5′-TAATACGACTCACTATAGATGGAGAAAAAAATCACTGGATA-3′ and 5′-CATACGGAATTCCGGATGA G-3′. The underlined sequence represents a portable T7 promoter. The RNA transcript was purified in 8% sequencing gels (10) as previously described.
Northern Blots.
Total RNA (4 μg) extracted from cells in the exponential phase of growth was resuspended in 5 M urea and subjected to electrophoresis in a 2.5%, nondenaturing agarose gel in 1× TEB (89 mM Tris⋅borate/2.5 mM EDTA–Na2, pH 8.3). The gel contained 0.5 μg/ml ethidium bromide, and electrophoresis lasted ≈2 h at 5–10 V/cm or until the bromphenol blue dye had migrated 8 cm. Resolution of the major RNA species was checked on a UV trans-illuminator. The RNAs (including 23S RNA) were electrotransferred to a nylon membrane for 12–15 h at 250 mA as described (5). M1 RNA (estimated at 400 copies/cell; see ref. 5) was used as an internal standard to normalize amounts of RNA in each lane. Hybridization was performed in rapid hybridization buffer according to the directions of the manufacturer (Amersham).
RESULTS
Phenotypic Conversion of Drug-Resistant Bacteria Under Controlled Culture Conditions: Drug Resistance Markers on Plasmids.
EGSs directed against the CmR or AmpR mRNAs were designed and tested in vitro (Fig. 1A) as described in Materials and Methods. These sequences were initially cloned into pUC19 (a high copy number plasmid that harbors the gene for AmpR and that is compatible with pACYC184, a low copy number plasmid that harbors the CmR gene) behind either an E. coli promoter (for the gene for M1 RNA) or a bacteriophage T7 promoter. A hammerhead ribozyme (11–13) that cleaves in cis was inserted after the EGS sequences (Fig. 1B) as described in Materials and Methods to facilitate the synthesis of the correct 3′ termini of the EGSs. When plasmid DNA that contained the relevant EGS genes was transcribed in vitro or in vivo, EGS and hammerhead RNAs of the expected sizes were generated (see below).
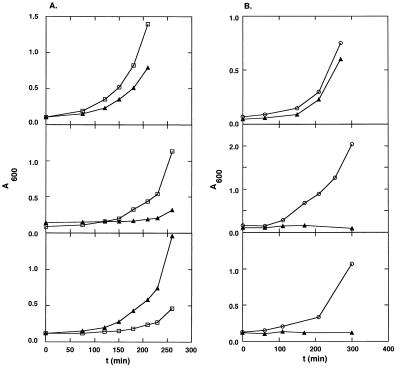
E. coli cells resistant to Cm and not harboring pUC19 or its derivatives were transformed with the plasmids that contained the synthetic EGS genes. Cultures were grown from single colony isolates, and their growth properties were tested in the presence of various concentrations of Cm or Amp (Fig. 2) as described in Materials and Methods. Cells that contained plasmids pACYC184 and pUC19 with no, or a nonspecific, EGS targeted to the mRNA for alkaline phosphatase grew well in concentrations of Cm up to 70 μg/ml whereas cells with the appropriate, specific EGS failed to grow under these conditions and grew more slowly than control cells in 5 μg/ml of Cm as assayed either in liquid culture (see Fig. 2A) or on agar (data not shown). If the liquid cultures or the Petri dishes were incubated for a sufficient time (e.g., >6 h for liquid cultures, >2 days for plates), some resistant bacteria reappeared. In fact, these viable cells had lost the plasmid harboring the EGS genes (data not shown). Loss of the plasmid from a single cell during the first overnight incubation can account for the appearance of the viable cells.
Figure 2.
Growth rates in liquid culture (see Materials and Methods) of drug-resistant cells. [BL21(DE3)/pACYC184] that harbor EGSs directed against the CmR and AmpR mRNAs. All plasmids that harbor EGS genes are derivatives of pUC19, which contains the AmpR marker. (A) EGSs under the control of the E. coli promoter for M1 RNA. (□) pKBEGSAMP encodes EGSAMP directed against mRNA for β-lactamase. (▴) pKBEGSCAT1 encodes EGSCAT1 directed against mRNA for chloramphenicol acetyl transferase. A600 is a linear measure of cell growth. A600 = 1 is equivalent to ≈4 × 10⁸ viable cells. (Top) Cells grown in LB with Carb (50 μg/ml) and Cm (5 μg/ml); (Middle) cells grown in LB with Carb (50 μg/ml) and Cm (70 μg/ml); and (Bottom) cells grown in LB with Carb (500 μg/ml) and Cm (5 μg/ml). (B) EGSs under the control of a bacteriophage T7 promoter. (○) pNT7APHH contains the gene for an EGS directed against the mRNA for alkaline phosphatase (see Materials and Methods), and (▴) pT7EGSCAT1 contains EGSCAT1 directed against the mRNA for CAT. (Top) Cells grown in LB with Carb (50 μg/ml) and Cm (5 μg/ml); (Middle) cells grown in LB with Carb (50 μg/ml) and Cm (70 μg/ml); and (Bottom) cells grown in LB with Carb (50 μg/ml), Cm (70 μg/ml), and 2 mM isopropyl β-d-thiogalactoside.
In those cells that contained inducible T7 RNA polymerase and EGS genes under control of a T7 promoter, efficient phenotypic conversion was observed in the absence or presence of the inducer isopropyl β-d-thiogalactoside because of leaky transcription of the T7 polymerase gene. In these cells (Fig. 2B), phenotypic conversion is more efficient than in cells that harbor EGS genes under the control of the E. coli promoter, presumably because the steady-state copy number of EGS RNA is higher in the former cells and the hairpin structure of the T7 transcription terminator sequence protects the EGS RNA from 3′ to 5′ exonuclear degradation.
Cells harboring synthetic genes coding for EGSAMP grew well in Carb (an analog of ampicillin that is a superior selective agent) at concentrations up to 50 μg/ml (Fig. 2A). However, the EGS gene in these cells is on the same derivative of the high copy number plasmid pUC19 as the AmpR marker (and is under the control of an E. coli promoter). Therefore, the ratio of Amp mRNA to EGSAMP in these cells is expected to be more nearly equal than that of CAT mRNA to EGSCAT1 in the strains described above. Consequently, phenotypic conversion of the AmpR marker is less efficient. Nevertheless, conversion is virtually complete at 500 μg/ml Carb (Fig. 2A).
This method of phenotypic conversion can be improved further by (i) searching for more sites in the target mRNA that will hybridize efficiently with an EGS to form susceptible substrates for RNase P, (ii) expressing multiple EGS genes that will hybridize with the same and/or different sites in the target mRNA (14) (iii) increasing the copy number of the plasmid, and (iv) increasing promoter strength upstream from the EGS genes, thereby elevating the EGS-to-target mRNA ratio. These strategies were explored further with CAT mRNA as the target.
Two EGSs Targeting CAT mRNA.
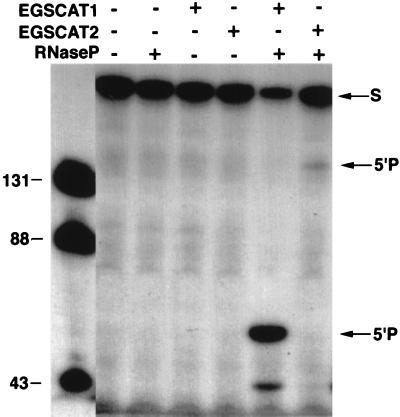
The secondary structure of the entire CAT mRNA sequence was modeled with an energy minimization program (15). A target site was chosen on the basis of the prediction that it would be single-stranded and that the first nucleotide downstream of the intended site of cleavage by RNase P would be G, a factor important in determining the efficiency of cleavage by RNase P (16, 17). A new EGS (EGSCAT2) was designed to hybridize to nucleotides 156–171 in the coding region of CAT mRNA (Fig. 1A). Before the synthesis and testing of EGSCAT2, a fragment of CAT mRNA, which contained 225 nt proximal to the initiator AUG (see Materials and Methods), was transcribed in vitro and probed with nucleases S1 (specific for single-stranded regions) and V1 (specific for hydrogen-bonded regions) and dimethyl sulfate to ascertain that the new target site was indeed in a single-stranded region (data not shown). The fragment of CAT RNA was then tested as a target substrate in the presence of EGSCAT2 in vitro. The efficiency of cleavage with EGSCAT2 was much less than with EGSCAT1 (Fig. 3), and this difference also was reflected in assays of EGSCAT2 function in vivo (see below; Fig. 4). Both EGSCAT1 and EGSCAT2 that were assayed in vitro had the correct EGS and HH sequences. However, on resequencing the new EGS gene that had been picked after cloning for use in vivo, as well as that for EGSCAT1, we found that both of these EGSs, under the control of the E. coli promoter, had suffered a deletion of 6 nt in the hammerhead region. Nevertheless, the mutated EGSs had the desired phenotype in vivo (see below). Further details of the function of hammerhead sequences that contain a deletion will be described elsewhere (R.S. and S.A., unpublished work).
Figure 3.
Cleavage by RNase P of complexes of CAT mRNA and EGS CAT1 or EGSCAT2 in vitro. The general conditions for assay of RNase P cleavage of the complexes of target mRNA and EGSs were as described by Li et al. (3). Additions to each reaction mixture are indicated at the top of the figure, and incubation was for 40 min at 37°C. The reaction analyzed in the first left-hand lane contained a precursor tRNA substrate (pTyr) and RNase P (10 nM of M1 RNA and 100 nM of C5 protein). All of the other reaction mixtures contained 10 nM of 5′ end-labeled target CAT mRNA (225 nt) prepared as described in Materials and Methods and 200 nM of one or the other EGS. The size in nucleotides of the substrate and products in the first lane are indicated on the left-hand side of the figure, and the positions of the 5′ cleavage products in the reactions with CAT mRNA are indicated on the right-hand side of the figure.
Figure 4.
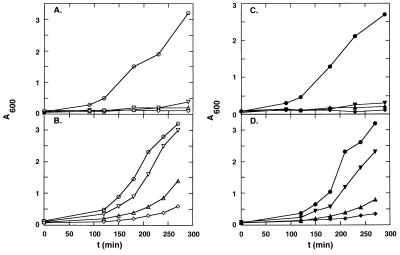
Growth rates in liquid culture of cells harboring EGSs. The concentration of Carb in all cultures was 50 μg/ml. The plasmids used were: pKB283 (○, •), pKBEGSCAT1 (▵, ▴), pKBEGSCAT2 (▿,▾), and pKBEGSCAT1+2 (⋄, ♦). (A) Plasmids in RS7027 grown in the presence of Cm (5 μg/ml). (B) The same plasmids in BL21(DE3) harboring pACYC184. (C) As in A but Cm = 25 μg/ml. (D) As in B, but Cm = 70 μg/ml.
A synthetic gene coding for EGSCAT2 under control of the promoter for M1 RNA was constructed as described for the case of EGSCAT1. Furthermore, a new construct was made (Fig. 1B) in which the two EGSs were placed in tandem with hammerhead ribozymes of the appropriate sequences to guarantee the release of the individual EGSs from the gene transcript by appropriate processing after transcription. The new constructs were inserted into pUC19 as described in Materials and Methods to create pKBEGSCAT2 and pKBEGSCAT1+2, and these plasmids were then inserted into E. coli BL21(DE3)/pACYC184.
The growth properties of the strains that contain genes coding for one of the two EGSs, or both EGSs, in both high and low concentrations of Cm are shown in Figs. 4 B and D and 5B. It is apparent both that EGSCAT2 is less effective than EGSCAT1 in converting the phenotype of the CmR cells and that having both EGSs in the same cell is more effective than EGS1 alone. In fact, the result with both EGSs under the control of an E. coli promoter is comparable to that with EGSCAT1 under the control of the very strong T7 promoter (Fig. 2B). The inhibitory effect is the sum of the inhibition by the two EGSs separately (data not shown). These results verify the simple hypothesis that EGSs attacking multiple sites should be more efficient in reducing gene expression than EGSs targeted to one site only.
Drug Resistance Marker in Single Copy on the Host Chromosome.
To increase the EGS-to-target mRNA ratio in a way different from that described above, the pKB series of plasmids were inserted into a strain, RS7027, in which the CmR gene exists in a single copy only on the host chromosome (18). (The ratio of EGS-to-target mRNA is manipulated in this case by decreasing the copy number of the cat gene rather than by increasing the level and/or number of different EGS RNAs.) A comparison of the growth rates in Figs. 4 A and C and 5A with those in Figs. 4 B and D and 5B, respectively, validates further the statement that an increase, by whatever means, of the EGS-to-target mRNA ratio results in increased efficiency of phenotypic conversion. In these experiments, a cytocidal effect is seen even at 5 μg/ml of Cm. Additionally, cells that harbored CAT EGSs that were diluted from overnight cultures (70 μg/ml Cm) into fresh medium that contained no Cm had very low viability. The low viability after dilution was not due to a nonspecific effect of EGS expression because cells that expressed the EGSs but had no cat genes were perfectly viable in the absence of Cm (data not shown). Furthermore, the amount of CAT enzyme in cells harboring both EGS genes, at 3 h after dilution from overnight cultures, was <25% of that found in cells with no EGS genes. Not more than 10% of the cells that contained EGSs CAT1 and CAT2 were viable at 3 h after dilution; these particular cells, which have lost the plasmid bearing the EGS genes, may account for the residual CAT activity.
Similar results to those described above were obtained in experiments with three additional EGSs selected to target other, phylogeneticlly conserved sites in CAT mRNA (R.S. and S.A., unpublished work). In all cases reported here, cells that harbored EGSs were still in early exponential phase while the control cells were in stationary phase after 6 h of growth in liquid culture.
Amount of EGS and Target mRNA in Vivo.
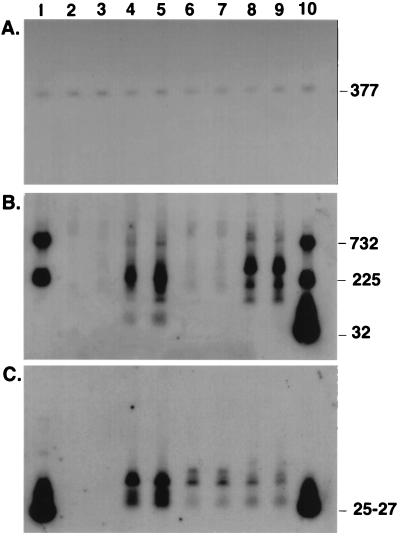
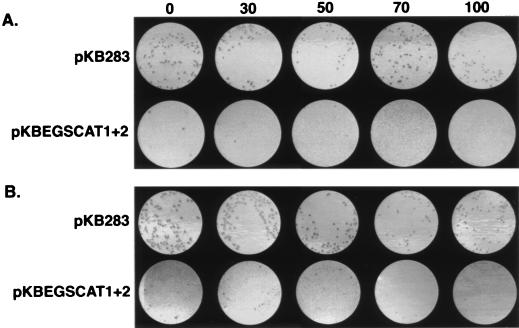
To ascertain whether phenotypic conversion was accompanied by the expected changes in the accumulation of CAT mRNA and complementary EGS RNAs, we examined the intracellular RNA of relevant bacterial strains by Northern blot analysis. One complication in these experiments arose from the fact that the transcription, but not the translation, of CAT mRNA was enhanced under conditions of slow growth (19). This phenomenon is apparent in Fig. 6, which is an autoradiograph of a Northern blot of RNAs (16) extracted from the various strains used for the experiments shown in Fig. 4 B and D. There is obviously an increase in the total amount of CAT mRNA (i.e., intact mRNA and degradation products) in the strains that harbor genes that code for EGS CAT1 or the two EGSs (Fig. 6B, lanes 4 and 5 and 8 and 9) compared with the strains with no EGS or EGSCAT2 (lanes 2 and 3 and 6 and 7) and that increase is correlated with the decrease in growth rate, as anticipated (19). The presence of degradation products that had the size expected (<732 nt) as a result of cleavage of the mRNA by RNase P are prominent in the figure. The amount of EGS RNA was quantitated in separate Northern blots, and all estimates of RNA copy number (Table 1) were normalized to the amount of M1 RNA in the cells. Quantitation of the amounts of EGS and CAT mRNA indicated that, in the cells harboring EGSs CAT1 and CAT2, in which the growth rate is slowest, the total amount of CAT mRNA and its degradation products is highest and that the combination of EGSs CAT1 and CAT2 is most efficient in degrading CAT mRNA as judged by the ratio of EGS RNA to CAT mRNA and its degradation products. Additionally, as expected, the ratio of “intact” CAT mRNA (≥732 nt) to total CAT mRNA (intact plus degradation products) was lowest in cells that contained both EGSs (Table 1). This ratio was almost the same for EGSCAT1 alone, as would be predicted from an examination of Figs. 4 and 5.
Figure 6.
Northern blot analysis of intracellular RNAs. BL21(DE3)/pACYC184 harboring a compatible pUC19 derivative that did or did not contain EGSs complementary to CAT mRNA was harvested during exponential growth, and blots were prepared as described in Materials and Methods. Cells were grown in LB with Carb (50 μg/ml) and either 5 μg/ml Cm (lanes 2, 4, 6, and 8) or 70 μg/ml Cm (lanes 3, 5, 7, and 9). Lanes: 1, marker RNAs: M1 RNA (377 nt), oligo I (25 nt, contains the sequence for EGSCAT2), and CAT mRNAs (732 and 225 nt); 2 and 3, pKB 283 harboring no EGS; 4 and 5, pKBEGSCAT1; 6 and 7, pKBEGSCAT2; 8 and 9, pKBEGSCAT1+2; and 10, marker RNAs as in lane 1 and, additionally, oligo II (32 nt, complementary to EGSCAT1) and oligo III (27 nt, contains the sequence for EGSCAT1). Four probes were used to generate the blots shown: for A, an oligonucleotide complementary to nucleotides 121–140 in M1 RNA; for B, oligo III (to probe for CAT mRNA); and for C, oligo II (to probe for EGSCAT1) and oligo IV (complementary to EGSCAT2 to probe for EGSCAT2). Sizes in nucleotides of various RNAs are shown on the right-hand side of the figure. The slowest migrating species in C may be unprocessed transcripts of the EGS genes that still contain the hammerhead sequences.
Table 1.
Estimates of the steady-state copy number of CAT mRNA, its degradation products, and CATEGS RNA in vivo
| Plasmid | EGS | High Mr mRNA | All mRNA | High Mr/all mRNA |
|---|---|---|---|---|
| pKB283 | 8 | 56 | 0.14 | |
| pKBEGSCAT1 | 163 | 9 | 230 | 0.04 |
| pKBEGSCAT2 | 80 | 7 | 72 | 0.10 |
| pKBEGSCAT1+2 | 77 | 29 | 841 | 0.03 |
| pKB283 | 6 | 52 | 0.12 | |
| pKBEGSCAT1 | 208 | 9 | 357 | 0.03 |
| pKBEGSCAT2 | 74 | 10 | 90 | 0.11 |
| pKBEGSCAT1+2 | 70 | 24 | 792 | 0.03 |
The RNA species shown in the Northern blot in Fig. 6 were quantitated by analysis with a Bio-Imaging Analyzer (Fuji), and copy numbers were calculated using the known amounts of marker RNAs. M1 RNA was used as in internal standards for each sample loaded on a gel (see legend to Fig. 6). Shown here are data for derivatives of E. coli BL21(DE3)/pACYC184 harboring the compatible plasmids listed in the first column. The remaining columns represent the copy number of EGS RNA, high Mr (intact) CAT mRNA (≥732 nt), all CAT mRNA (fragments and intact as shown in Fig. 6B), and the ratio of intact to all CAT mRNA.
Figure 5.
Growth on solid medium of cells harboring EGSs. After overnight culture (5 μg/ml Cm, 50 μg/ml Carb), cells were diluted to A600 = 0.05 and incubated further with aeration (70 μg/ml Cm, 50 μg/ml Carb) for 1–2 h. Aliquots from the liquid cultures were spread on plates that contained various concentrations (micrograms per milliliter) of Cm as indicated across the top of the figure. The highest concentration at which the cells showed no decrease in viability was the single cell resistance level. Note that the cells that harbored pKBEGSCAT1+2 were virtually inviable after incubation in 70 μg/ml Cm. (A) pKB283 and pKBEGSCAT1+2 in RS7027. (B) Same plasmids in BL21(DE3)/pACYC184. The original plates were electronically scanned, and the images were processed and printed by laser printer as shown.
DISCUSSION
We have shown that, in E. coli, under conditions that assure a high copy number of EGSs and/or multiple target sites in a designated mRNA, inactivation of the expression of the designated genes coding for drug resistance is virtually complete. Conditions for efficient phenotypic conversion can be further optimized to prevent a return to drug resistance by changing promoter strength, steady-state EGS RNA copy number, the number of targeted sites, and target gene copy number. A cassette consisting of an appropriate promoter, sequences coding for EGSs and sequences coding for the hammerhead ribozyme to assure the biosynthesis of EGSs with the correct sizes when appropriate and a terminator sequence can be constructed for use in different plasmid/host systems.
The method we have described for phenotypic conversion of drug resistance can, in principle, be applied to any species of bacteria into which plasmids that carry genes coding for EGSs can be transferred. For example, the so-called R plasmids of enteric bacteria (20–23) and their promiscuous and high frequency transfer derivatives, which are responsible for the establishment and transfer of drug resistance in clinical populations, can be altered to carry genes for EGSs instead of particular drug resistance markers. In this way, advantage can be taken of the same mechanisms of plasmid transfer that exists in the natural world to convert the phenotype of drug-resistant bacteria at various sites of infection in animals or humans to a drug-sensitive one under suitable selective conditions. Phenotypic conversion may also be achieved by delivery to bacteria of nuclease-resistant oligonucleotides packaged with a carrier of an appropriate composition (G. Takle, S. George, and A. Goldberg, personal communication).
Mutation of a single base in the target mRNA will not defeat the methodology we describe because a single base mismatch in the complex with the target mRNA is unlikely to alter recognition by RNase P. In fact, EGSCAT1 with a G to C change 9 nt from the 3′ end of the EGS (Fig. 1A) functions just as efficiently in vivo as the perfectly matched EGSCAT1 (data not shown). Thus, at least two, if not more, mutations in the cat gene must occur before the efficiency of the method that uses two EGSs is endangered.
Mechanisms of phenotypic conversion that use other RNA enzymes or antisense oligonucleotides (24) have been used with limited success in E. coli. We provide here evidence that the general methodology that uses RNase P can be very effective in bacteria.
Acknowledgments
We thank Dr. M. Riley for helpful discussions and comments, Donna Wesolowski for excellent technical assistance and Drs. V. Gopalan, G. Miller, and H. D. Robertson for critical readings of the manuscript. R.S. was supported by a postdoctoral fellowship from Innovir Laboratories. Research in the laboratory of S.A. is supported by U.S. Public Health Service Grant GM-19422.
ABBREVIATIONS
- EGS
external guide sequence
- Cm
chloramphenicol
- Amp
ampicillin
- Carb
carbenicillin
- LB medium
Luria–Bertani medium
References
- 1.Forster A C, Altman S. Science. 1990;249:783–786. doi: 10.1126/science.1697102. [DOI] [PubMed] [Google Scholar]
- 2.Altman S, Kirsebom L, Talbot S. FASEB J. 1993;7:7–15. doi: 10.1096/fasebj.7.1.7916700. [DOI] [PubMed] [Google Scholar]
- 3.Li Y, Guerrier-Takada C, Altman S. Proc Natl Acad Sci USA. 1992;89:3185–3189. doi: 10.1073/pnas.89.8.3185. [DOI] [PMC free article] [PubMed] [Google Scholar]
- 4.Li Y, Altman S. Nucleic Acids Res. 1996;24:835–842. doi: 10.1093/nar/24.5.835. [DOI] [PMC free article] [PubMed] [Google Scholar]
- 5.Guerrier-Takada C, Li Y, Altman S. Proc Natl Acad Sci USA. 1995;92:11115–11119. doi: 10.1073/pnas.92.24.11115. [DOI] [PMC free article] [PubMed] [Google Scholar]
- 6.Yuan Y, Hwang E, Altman S. Proc Natl Acad Sci USA. 1992;89:8006–8010. doi: 10.1073/pnas.89.17.8006. [DOI] [PMC free article] [PubMed] [Google Scholar]
- 7.Liu F, Altman S. Genes Dev. 1995;9:471–480. doi: 10.1101/gad.9.4.471. [DOI] [PubMed] [Google Scholar]
- 8.Studier F W, Moffat B A. J Mol Biol. 1986;189:113–130. doi: 10.1016/0022-2836(86)90385-2. [DOI] [PubMed] [Google Scholar]
- 9.Lundberg U, Altman S. RNA. 1995;1:327–334. [PMC free article] [PubMed] [Google Scholar]
- 10.D’Alessio J M. In: Gel Electrophoresis of Nucleic Acids: A Practical Approach. Rickwood D, Hames B D, editors. Oxford: IRL; 1982. pp. 173–197. [Google Scholar]
- 11.Forster A C, Symons R H. Cell. 1987;49:211–220. doi: 10.1016/0092-8674(87)90562-9. [DOI] [PubMed] [Google Scholar]
- 12.Uhlenbeck O C. Nature (London) 1987;328:596–600. doi: 10.1038/328596a0. [DOI] [PubMed] [Google Scholar]
- 13.Haseloff J, Gerlach W L. Nature (London) 1988;334:585–591. doi: 10.1038/334585a0. [DOI] [PubMed] [Google Scholar]
- 14.Ohkawa J, Yuyama N, Takebe Y, Nishikawa S, Taira K. Proc Natl Acad Sci USA. 1993;90:11302–11306. doi: 10.1073/pnas.90.23.11302. [DOI] [PMC free article] [PubMed] [Google Scholar]
- 15.Zucker M, Stiegler P. Nucleic Acids Res. 1981;9:133–148. doi: 10.1093/nar/9.1.133. [DOI] [PMC free article] [PubMed] [Google Scholar]
- 16.Perreault J-P, Altman S. J Mol Biol. 1992;226:399–409. doi: 10.1016/0022-2836(92)90955-j. [DOI] [PubMed] [Google Scholar]
- 17.Kufel J, Kirsebom L. Proc Natl Acad Sci USA. 1996;93:6085–6090. doi: 10.1073/pnas.93.12.6085. [DOI] [PMC free article] [PubMed] [Google Scholar]
- 18.Wertman K F, Wyman A R, Botstein D. Gene. 1986;49:253–262. doi: 10.1016/0378-1119(86)90286-6. [DOI] [PubMed] [Google Scholar]
- 19.Meyer B J, Schottel J L. Mol Microbiol. 1992;6:1095–1104. doi: 10.1111/j.1365-2958.1992.tb01547.x. [DOI] [PubMed] [Google Scholar]
- 20.Meynell E, Datta N. Nature (London) 1967;214:885–887. doi: 10.1038/214885a0. [DOI] [PubMed] [Google Scholar]
- 21.Clerget M, Chandler M, Caro L. Mol Gen Genet. 1981;181:183–191. doi: 10.1007/BF00268425. [DOI] [PubMed] [Google Scholar]
- 22.Thomas C M, editor. Promiscuous Plasmids of Gram-Negative Bacteria. London: Academic; 1989. pp. 1–276. [Google Scholar]
- 23.Hardy K G, editor. Plasmids: A Practical Approach. 2nd Ed. Oxford: Oxford Univ. Press; 1993. pp. 1–252. [Google Scholar]
- 24.Altman S. Proc Natl Acad Sci USA. 1993;90:10898–10900. doi: 10.1073/pnas.90.23.10898. [DOI] [PMC free article] [PubMed] [Google Scholar]


