Abstract
Membrane bilayer fusion has been shown to be mediated by v- and t-SNAREs initially present in separate populations of liposomes and to occur with high efficiency at a physiologically meaningful rate. Lipid mixing was demonstrated to involve both the inner and the outer leaflets of the membrane bilayer. Here, we use a fusion assay that relies on duplex formation of oligonucleotides introduced in separate liposome populations and report that SNARE proteins suffice to mediate complete membrane fusion accompanied by mixing of luminal content. We also find that SNARE-mediated membrane fusion does not compromise the integrity of liposomes.
A considerable body of biochemical and genetic evidence implies a critical role for SNARE proteins (1, 2) in the process of intracellular membrane fusion, along with proteins acting upstream of SNARE proteins (3, 4) in regulation and tethering (5–16).
A direct role for SNAREs in membrane fusion has been established from studies using isolated SNARE proteins reconstituted into liposomes (17), and, more recently, this conclusion has been confirmed by studies using perforated neuroendocrine (PC12) cells (16). The structure of the core of a neuronal SNARE complex (18, 19) and earlier biochemical and electron microscopic studies (20–22) are fully consistent with these findings and suggestions concerning how the exceptionally high stability of SNARE complexes may promote fusion (8, 17). The structural similarity with the cores of various virus-encoded fusion proteins (23) suggests that this principle for membrane fusion is indeed a general one.
In our original report, we demonstrated SNARE-dependent fusion by observing the mixing of phospholipids and found that lipids in both monolayers of the vesicle participated (17). Recent work has shown that SNARE-dependent fusion is extremely efficient and that, when the N-terminal regulatory domain of the t-SNARE is removed, fusion occurs at physiologically relevant rates (24). Although this establishes bilayer fusion, it does not directly establish that contents mix and are retained in the fused vesicles. Here, we report the development of a fusion assay that is designed to address these issues.
Materials and Methods
Reagents.
Both nonmodified and biotinylated oligonucleotides (the latter ones HPLC-purified) were obtained from Integrated DNA Technologies (Coralville, Iowa). The primary structures of oligonucleotides used in this study are as follows: 1, 5′-CCG TGG TGG ATC CCG-3′, 2, 5′-biotin-CGG GAT CCA CCA CGG; and 3, 5′-CGG GAT CCA CCA CGG-3′. Oligonucleotide 1 was subsequently 5′-modified with 33P using [γ-33P]ATP and T4 polynucleotide kinase (25). The apparent specific activity was determined to be ≈0.5 Ci/mmol. All protein preparations were performed as described (17, 24).
Reconstitution of Proteoliposomes and Recovery of Oligonucleotides.
Liposomes were formed in the presence of either VAMP or a preformed complex of syntaxin 1A and SNAP25, respectively, as described (17). The only modification made to this procedure was the addition of oligonucleotides. Lyophilized oligonucleotides were dissolved in reconstitution buffer [25 mM Hepes⋅KOH, pH 7.4/100 mM KCl/10% (wt/vol) glycerol] at concentrations between 1 and 5 mM. In case of the 33P-labeled oligonucleotide 1, reconstitution buffer was supplemented with 1% octyl glucoside (Boehringer Mannheim). 33P-labeled oligonucleotide 1 was added at a final concentration of 1 μM to the VAMP-liposome reconstitution. This was achieved by adding 50 μl of oligonucleotide 1 [containing ≈300 pmol 33P-labeled oligonucleotide] to the lipid film followed by the addition of 50 μl of VAMP (2.85 mg/ml). After dilution with reconstitution buffer (final volume: 300 μl), this procedure theoretically results in the loading of approximately one oligonucleotide per 50 liposomes based on the ratio of the luminal volume of the 45-nm liposomes (17) and the total volume of the reconstitution sample. After flotation of liposomes in a Nycodenz gradient (17), ≈0.2–0.5% of the initial radioactivity was recovered, which roughly corresponds to the luminal volume of liposomes in comparison to the total volume of the reconstitution (300 μl). In case of t-SNARE-containing liposomes, oligonucleotide 2 was included into the reconstitution at a concentration of 50 μM. This should result in the trapping of two molecules per liposome [again based on a liposome diameter of 45 nm and the corresponding ratio of the luminal volume of liposomes compared with the total volume of the reconstitution (1.5 ml)]. To experimentally verify this prediction, we determined the amounts of oligonucleotide 2 present in gradient-purified liposomes by competition experiments between biotinylated oligonucleotide (contained in the liposomes) and the nonbiotinylated form (oligonucleotide 3) added at various known concentrations with respect to the binding to the 33P-labeled, complementary oligonucleotide after lysis of liposomes with detergent. These experiments revealed that oligonucleotide 2 was trapped into t-SNARE-containing liposomes to the expected extent of approximately two molecules per liposome. Where indicated, liposomes containing tc-syntaxin 1A/SNAP-25 were treated with thrombin (Sigma) by adding 8 units of enzyme to 400 μl of gradient-purified liposomes. After gentle mixing, liposomes were incubated at room temperature for 2 hours. Occasionally, liposomes were gently mixed throughout the incubation. Samples then were transferred to ice and supplemented with 4-(2-aminoethyl)benzenesulfonylfluoride/HCl (Calbiochem) (24) to inhibit thrombin.
Content Mixing Assay.
A typical content mixing assay was performed by mixing 1 μl of competitor (oligonucleotide 3; 5 mM), 5 μl of VAMP-containing liposomes, and 45 μl of syntaxin 1A/SNAP-25-containing liposomes. Other additions or variations of the incubation conditions were performed as indicated in the corresponding figure legends. In every individual experiment, duplicates were prepared for each experimental condition. Depending on the specific activity of 33P-labeled oligonucleotide 1, ≈10,000–30,000 cpm were introduced per assay. All experiments were performed without preincubation at 0°C. For standard experiments samples were incubated for 2 hours at 37°C. After incubation, liposome mixtures were placed on ice for 10 min and, where indicated, were treated with 2 units of DNase I (Promega) in the presence of 2 mM MgCl2 for 30 min on ice. After the addition of EDTA (10 mM final concentration) to inhibit the DNase, all samples were supplemented with 1.25 ml TX-100 containing wash buffer [25 mM Hepes⋅KOH, pH 7.4/100 mM KCl/0.5% (wt/vol) TX-100] to lyse liposomes. Thus, after lysis, oligonucleotide 2 was accessible to affinity purification using streptavidin beads. Streptavidin beads were equilibrated in wash buffer supplemented with 0.5 mg/ml yeast tRNA (Boehringer Mannheim), and 50 μl of packed beads were added to each sample. After 12 hours of incubation on a rotating wheel at 4°C, beads were collected by centrifugation at 8,000 × g for 2 min. Beads were washed four times with 1.25 ml of ice-cold wash buffer. After removing the final supernatant, the lids of the tubes were removed, and the tubes were directly placed into a scintillation vial containing 3 ml of scintillation liquid (Ultima Gold, Packard). After thoroughly mixing the samples, copurification of oligonucleotide 1 was analyzed by measuring 33P-derived radioactivity using a Beckman Coulter LS 6000IC scintillation counter.
The raw data are expressed as “percent of total input.” Control samples were prepared that did not contain competitor to monitor the efficiency of the affinity purification procedure. On average, 81 ± 4% (SD) of radioactivity were recovered. Background values were determined by mixing of VAMP-containing- and syntaxin 1A/SNAP-25-containing liposomes in the presence of competitor on ice followed by immediate lysis of liposomes. After correcting for background (typically <2% of total radioactivity), the fusion signal was expressed as percent of total 33P input.
Results and Discussion
An Assay to Measure Membrane Fusion Based on Content Mixing.
Content mixing assays typically rely on the detection of fluorescence to monitor the intermixing of soluble compounds trapped in previously separate liposome populations (26–30). Unfortunately, these assay systems turned out to be less suitable to monitor SNARE-dependent membrane fusion because one of them [ANTS/DPX system (30)] has been reported not to provide reliable data when small unilamellar liposomes are involved (30), such as those reconstituting SNARE proteins (17), whereas another assay [terbium/dipicolinic acid (30)] is not usable because Nycodenz, which is used for gradient purification of SNARE-containing liposomes, interferes with the excitation spectrum of the [Tb(DPA)3]3− chelation complex. Therefore, we decided to develop a new and in principle more sensitive assay that is based on the detection of a radiolabeled fusion product. A further advantage of this strategy is that it allows the simultaneous measurement of lipid mixing (fluorescent product) and content mixing (radioactive product).
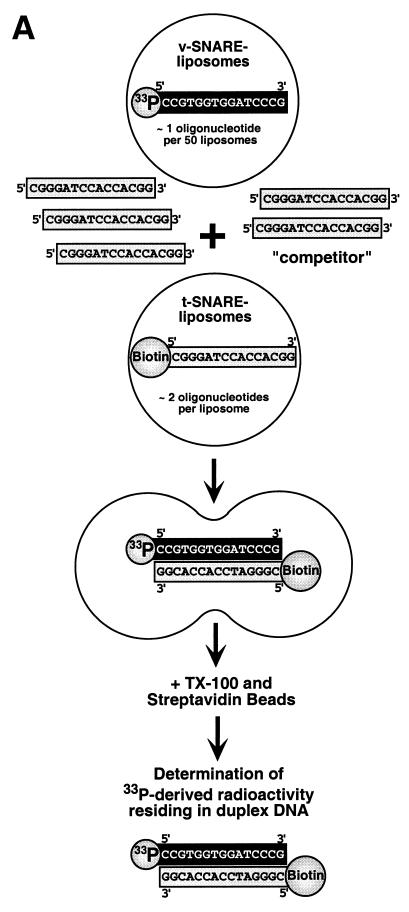
The rationale of the new content mixing assay is illustrated in Fig. 1A. The system is based on complementary oligonucleotides that reside in separate liposome populations. Upon membrane fusion and the formation of a continuous luminal space between fusing vesicles, the formerly separate complementary oligonucleotides are brought into contact, thereby allowing the formation of double-stranded DNA. This event can be monitored by 5′-33P-labeling of one oligonucleotide [present in v-SNARE-containing liposomes (“v-vesicles”)] and 5′-biotinylation of the oligonucleotide present in t-SNARE-containing liposomes (“t-vesicles”) (Fig. 1A). Thus, after lysis of liposomes with detergent, biotinylated DNA (single- or double-stranded) can be affinity-purified by using immobilized streptavidin. To prevent fusion-independent duplex formation of oligonucleotides after lysis, a large excess (as compared with the concentration of biotinylated oligonucleotide 2) of a competitor (an oligonucleotide identical to the biotinylated oligonucleotide with respect to nucleotide sequence but lacking the 5′ biotin modification) was added to the incubation. Importantly, this also prevents a possible false-positive fusion signal based on a potential leakage of oligonucleotides from v- and t-SNARE-containing liposomes. The new assay is highly sensitive because it monitors the appearance of a radiolabeled fusion product.
Figure 1.
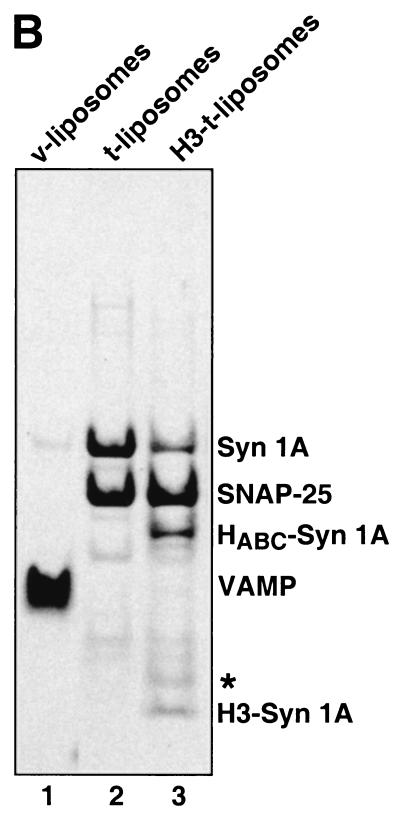
Content mixing assay and protein analysis of liposomes. (A) Schematic illustration of the oligonucleotide-based fusion assay. For a detailed description see text. (B) Analysis of the protein content of various proteoliposome preparations. Proteins were analyzed by using 10% NuPage Gels (NOVEX, San Diego) followed by Coomassie blue protein staining. Lanes: 1, 10 μl of VAMP-containing liposomes; 2, 10 μl of tc-syntaxin 1A/SNAP-25-containing liposomes; 3, 10 μl of H3-syntaxin 1A/SNAP25-containing liposomes obtained after thrombin treatment of tc-syntaxin 1A/SNAP25-containing liposomes (for details see Materials and Methods). The band highlighted with a star (lane 3) was previously identified as a degradation product of SNAP-25 (24).
We found that 83 ± 9% of 33P-derived radioactivity was recovered after DNase treatment of liposomes, indicating that the vast majority of oligonucleotide detected in the gradient-purified liposome fraction is localized lumenally. Because of the large excess of competitor present in our incubations, the small fraction of oligonucleotide facing the outside cannot result in a false-positive signal. The various liposome preparations were analyzed for their protein content by using SDS/PAGE (Fig. 1B). H3-t-liposomes were generated by thrombin treatment to remove the negative regulatory N-terminal HABC domain (24, 31, 32) of a genetically engineered version of syntaxin 1A (24), referred to therein as tc-syntaxin 1A.
Lipid Mixing and Content Mixing Correlate.
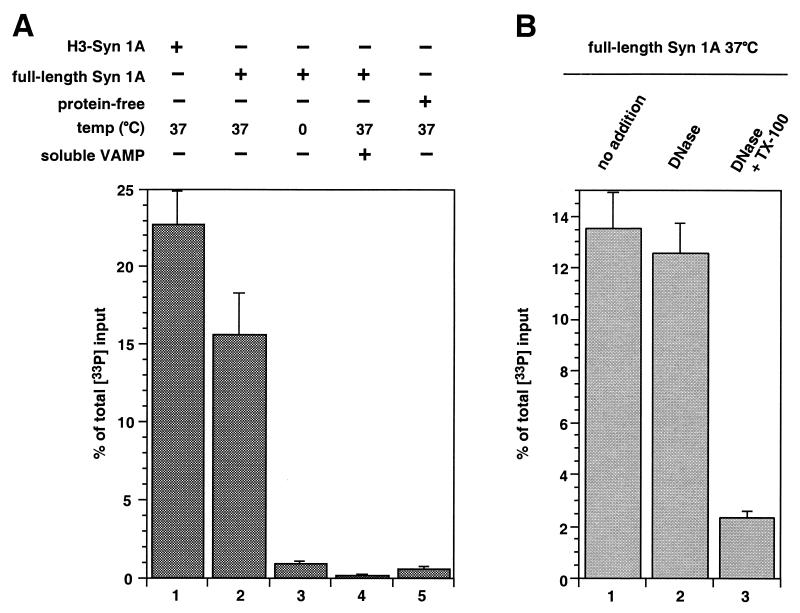
VAMP- and tc-syntaxin 1A/SNAP-25-containing liposomes were incubated in the presence of oligonucleotide competitor for 2 hours at 37°C. About 15% of total 33P-derived radioactivity introduced with v-vesicles [from here on referred to as “percent of total 33P input”] was recovered (Fig. 2A) as duplex, measuring contents mixing during fusion. Similar results were obtained when t-SNARE liposomes contained wild-type syntaxin instead of thrombin-cleavable syntaxin (data not shown). The use of liposomes containing a t-SNARE complex consisting of SNAP-25 and the H3 core domain of syntaxin 1A (see above and Fig. 1B) resulted in ≈22% recovery of total 33P input when incubated with VAMP-containing liposomes (Fig. 2A). This increase in fusion efficiency correlates with the improved kinetics of lipid mixing observed under this condition (24). The fusion signal was greatly reduced or absent at 0°C or in the presence of the cytoplasmic domain of VAMP, which titrates t-SNAREs, or when protein-free liposomes containing biotinylated oligonucleotide were used (Fig. 2A).
Figure 2.
Characterization of SNARE-dependent membrane fusion based on content mixing. (A) SNARE-mediated liposome fusion results in content mixing. All samples contained v-liposomes loaded with 33P-labeled oligonucleotide 1 and were (without a preceding incubation at 0°C) incubated for 120 min under the conditions indicated. Where indicated, 5 μl of the cytoplasmic domain of VAMP (3.8 mg/ml) prepared as described in ref. 17 were added to the incubation. After lysis of liposomes in the continued presence of competitor, biotinylated oligonucleotide 2 was affinity-purified (see Materials and Methods) and co-purification of oligonucleotide 1 was determined by measuring 33P-derived radioactivity. The data are expressed as percent of total 33P input. Standard deviations are shown [n = 5 (lane 1), n = 19 (lane 2), n = 13 (lane 3), n = 14 (lane 4), n = 9 (lane 5)]. (B) Oligonucleotides present in the incubation mixture are protected against DNase. All samples contained v-liposomes loaded with 33P-labeled oligonucleotide 1 and were incubated for 120 min at 37°C. Subsequent DNase I treatment (2 units per sample) was performed for 30 min on ice in the presence of 2 mM MgCl2 under the conditions indicated. After inhibition of DNase I by the addition of EDTA, liposomes were lysed and the mixture was subjected to affinity-purification of oligonucleotide 2. Recovery of 33P duplex DNA was determined as described above. Standard deviations are shown (n = 4).
To confirm the luminal localization of double-stranded DNA at the end of the fusion reaction, we subjected samples to DNase treatment in the absence or presence of detergent after the fusion reaction had been completed. As shown in Fig. 2B, the majority of the product is resistant to DNase treatment unless detergent is added.
Kinetics of Content Mixing.
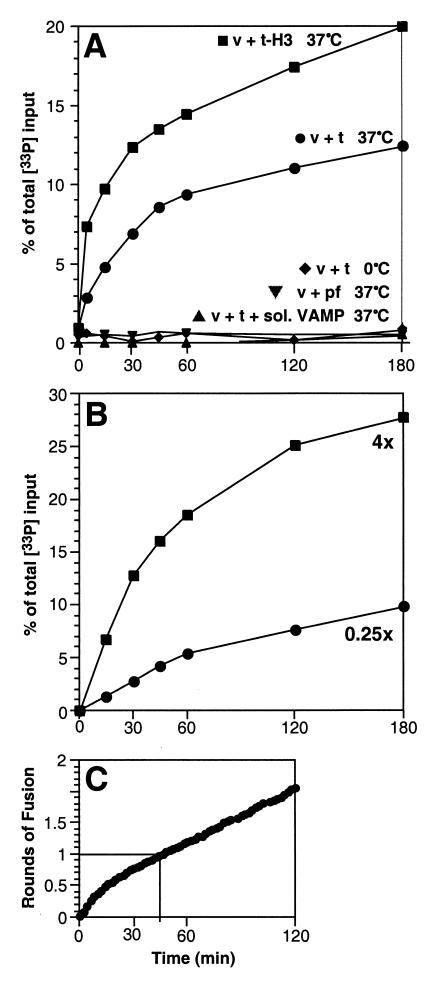
By using vesicles prepared under standard conditions described in Materials and Methods (referred to as “1x”), the fusion signal increased at a higher rate for the first 30–60 min and then at a lower rate thereafter (Fig. 3A, closed circles). Removal of the N terminus of syntaxin increased the initial rate of fusion (Fig. 3A, closed squares), such that 50% of the early, rapid portion of the reaction (likely corresponding to the first round of fusing v-vesicles) was completed in ≈5 min, in reasonable agreement with the reported increase in lipid mixing kinetics observed under this condition (24).
Figure 3.
Kinetic analysis of content mixing. Incubations were carried out as described in the legend of Fig. 2 and in Materials and Methods. For kinetic analysis, incubations were scaled up to allow taking samples of 50 μl at the time points indicated. All experiments were performed without a preceding preincubation at 0°C. Affinity-purification of biotinylated oligonucleotide 2 was performed as described in Materials and Methods. (A) Comparison of full-length tc-Syntaxin-containing liposomes with H3-Syntaxin-containing liposomes. Purification of biotinylated oligonucleotide 2 and determination of co-purification of 33P-labeled oligonucleotide 1 was performed as described in the legend of Fig. 2 and in Materials and Methods. Pf, protein-free. (B) Influence of the amount of oligonucleotide 2 present in t-SNARE-containing liposomes on the kinetics of content mixing. Liposomes were prepared as described in Materials and Methods in the presence of various amounts of oligonucleotide 2. The standard concentration of oligonucleotide 2 (50 μM during liposome reconstitution) as used for experiments shown in Figs. 2 and 3A was elevated to 200 μM (4x) or was lowered to 12.5 μM (0.25x), respectively. Under both conditions, t-SNARE-liposomes contained full-length tc-syntaxin. (C) Analysis of membrane fusion based on lipid mixing. These experiments were performed as described earlier (17), using the same liposome preparations (containing full-length tc-syntaxin in t-SNARE liposomes) used for content mixing assays. The fusion signal is expressed as rounds of fusion applying the calibration curve described in the accompanying paper (24). One round of fusion is reached when every individual VAMP-containing liposome on average fused with a t-SNARE-containing liposome.
In theory, when every t-SNARE-containing vesicle contains one or more biotinylated oligonucleotides, only the first round of fusion will be measured (even though lipids initially present in v-vesicles undergo multiple rounds of fusion under the conditions used (24). When some t-vesicles lack biotinylated oligonucleotide, then fusion of v-vesicles with “unloaded” t-vesicles will result in hybrid vesicles that still contain single-stranded 33P-oligonucleotides, which do not score in the assay. However, they will score in a later round of fusion with a “loaded” t-vesicle. When empty t-vesicles are in the minority, the assay signal should stop after one round. When some unloaded t-vesicles are present, the signal should abruptly slow down but still increase after one round. When unloaded t-vesicles predominate, the assay signal should follow the overall fusion reaction with little or no preferences for the first round (i.e., have similar kinetics to lipid mixing).
When the degree of loading of t-vesicles was lowered by using 25% of the standard (1×) concentration of biotinylated oligonucleotide during reconstitution (Fig. 3B, 0.25×), the kinetics resembled that of lipid mixing that measures several rounds of fusion (24). When the concentration of biotinylated oligonucleotide was raised to 4× the standard level (Fig. 3B, 4×), a fast initial component became prominent, and the signal slows down after 30–40 min. This breakpoint in the kinetics of content mixing corresponds closely to one round of fusion in a lipid mixing assay (24) using the same liposomes (Fig. 3C).
Figure 4.
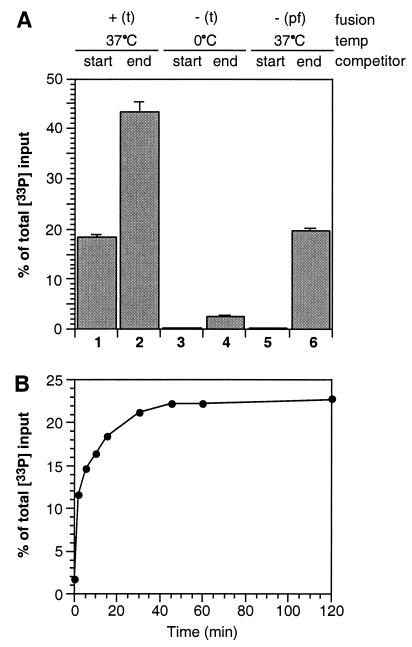
The integrity of liposomes is maintained during SNARE-dependent membrane fusion. (A) Analysis of leakage under fusion and nonfusion conditions. Incubations were performed as described in the legend of Fig. 2 and in Materials and Methods under the conditions indicated. All incubations contained VAMP-liposomes loaded with 33P-labeled oligonucleotide 1. Where indicated, t-SNARE (SNAP25/full-length syntaxin)-containing liposomes (t) loaded with biotinylated oligonucleotide 2 were replaced by protein-free (pf) liposomes containing biotinylated oligonucleotide 2. The competitor was either added at the beginning of the incubation (start) or after 2 hours of incubation (end) under the condition indicated. In the former case, the signal represents luminal duplex formation (i.e., content mixing as a result of membrane fusion) whereas, in the latter case, the signal represents luminal duplex formation plus leakage. Affinity-purification of biotinylated oligonucleotide 2 was performed as described in Materials and Methods. Standard deviations are shown (n = 4). (B) Kinetic analysis of leakage. Leakage was analyzed as described in A under nonfusion conditions. In this experiment, fusion was inhibited by preincubation of t-SNARE (SNAP25/full-length syntaxin) liposomes with the soluble domain of VAMP (final concentration 0.4 mg/ml). For kinetic analysis, incubations were scaled up to allow taking samples of 50 μl at the time points indicated followed by addition of competitor. Affinity-purification of biotinylated oligonucleotide 2 was performed as described in Materials and Methods.
These data extend our earlier observation that lipid mixing involves both the inner and the outer leaflet of phospholipid vesicles (17) and directly demonstrate that SNARE proteins are capable of mediating complete membrane fusion accompanied by the mixing of luminal content.
SNARE-Mediated Membrane Fusion Does Not Compromise the Integrity of Liposomes.
Does leakage occur before, during, or after fusion if it occurs at all? Leakage could be measured in the presence or absence of ongoing fusion by comparing the amounts of duplex oligonucleotides formation in the presence of competitor oligonucleotide with that in the absence of competitor. In the presence of competitor, the assay signal (as usual) will represent duplex DNA sequestered inside of fused vesicles. In the absence of competitor during incubation (competitor is added just before detergent lysis for analysis), the signal now results from sequestered duplex DNA and duplex DNA that forms from single oligonucleotides that leaked out during or without fusion. When fusion is blocked by applying protein-free liposomes loaded with biotinylated oligonucleotide, ≈19.3 ± 0.85% (SD) of total 33P-derived radioactivity was recovered in duplex DNA when the competitor was added at the end of the incubation (Fig. 4A), indicating that leakage does occur to a significant extent in the absence of fusion. Treatment of liposomes with DNase before flotation in a density gradient did not reduce this leakage [here, 17.9 ± 2.5% (SD) leaked in the absence of fusion], suggesting that the release of externally bound oligonucleotide is not the main contribution to the leakage signal. Importantly, we found that leakage is not a result of fusion because it was not significantly increased in the presence of fusion (under this condition, the amount of leakage is the difference between the signals in lanes 1 and 2 of Fig. 4A) as compared with nonfusion conditions (Fig. 4A, lane 6). On the contrary, leakage was found to be temperature-dependent as it was largely reduced when samples were kept on ice (Fig. 4A, lane 4). The leakage process is extremely rapid, being largely complete within 10–15 min at 37°C (Fig. 4B). Thus, leakage [half-time ≈2 min (Fig. 4B)] appears to be unrelated to fusion [half-time ≈30 min for full-length syntaxin (Fig. 3A)] because of the distinct kinetic properties. Evidently, a fraction of the vesicles spontaneously leaks upon warming up from the low temperature at which they were prepared. These data indicate that SNARE-dependent membrane fusion does not compromise the membrane integrity of fusing liposomes.
Electron microscopy (not shown) demonstrates that vesicles before and after fusion are monodisperse and exclude negative stain. This rules out the unlikely possibility that content mixing occurs in a sequestered space other than the lumen of vesicles after extensive aggregation and rupture, as has been observed when calcium is added to pure PS or PS plus DOPE mixtures (33, 34). The liposomes we use contain 85% PC and 15% PS and are incubated in the absence of calcium. The wide range of diameters of the reconstituted liposomes [45 ± 15 nm (SD) (17)] limits the use of electron microscopy for demonstrating fusion based on the predicted increase in diameter.
On the basis of negative results using an indirect method, it had been concluded that, although SNARE complexes dock membranes, they do not fuse them (10). This conclusion was based on data establishing a limited inhibitory effect on fusion when NSF (N-ethylmaleimide-sensitive fusion protein, a protein normally present in the cytoplasm) is added to a cell-free vacuole fusion system, together with partial effects on the stability of SNARE complexes, results that are open to other interpretations. Furthermore, genetic, biochemical and electrophysiological experiments have implicated SNAREs in the overall process of membrane fusion (35–38). The finding that isolated SNARE proteins can efficiently fuse lipid bilayers [as detected by both lipid mixing (17, 24) and content mixing (this study)] directly establishes that they are the basic machinery that merges membranes (17), a conclusion also confirmed in an elegant study using permeabilized cells (16). This principle is underscored by the internal architecture of the SNARE complex, whose “core” consists of four parallel α-helices with the membrane-spanning domains emerging at the same end (18, 19). Similar structures have been reported for viral fusion proteins (23), which is indicative of the existence of a general mechanism of membrane fusion.
Acknowledgments
We thank John Lenard for advice during the development of the content mixing assay, Gero Miesenböck for help with stochastic calculations, and Felix Wieland for critical comments on the manuscript. This work was supported by a grant from the National Institutes of Health (to J.E.R.). W.N. is supported by a postdoctoral long-term fellowship of the Human Frontiers Science Program Organisation, and J.A.M. is a recipient of a postdoctoral fellowship from the National Institutes of Health. T.W. was supported by fellowships from the Swiss National Science Foundation and the European Molecular Biology Organization. F.P. is a recipient of a postdoctoral fellowship from the Medical Research Council of Canada.
Footnotes
A Commentary on this article begins on page 12227.
References
- 1.Söllner T, Whiteheart S W, Brunner M, Erdjument-Bromage H, Geromanos S, Tempst P, Rothman J E. Nature (London) 1993;362:318–324. doi: 10.1038/362318a0. [DOI] [PubMed] [Google Scholar]
- 2.Rothman J E. Nature (London) 1994;372:55–63. doi: 10.1038/372055a0. [DOI] [PubMed] [Google Scholar]
- 3.Sogaard M, Tani K, Ye R R, Geromanos S, Tempst P, Kirchhausen T, Rothman J E, Söllner T. Cell. 1994;78:937–948. doi: 10.1016/0092-8674(94)90270-4. [DOI] [PubMed] [Google Scholar]
- 4.Brennwald P, Kearns B, Champion K, Keranen S, Bankaitis V, Novick P. Cell. 1994;79:245–258. doi: 10.1016/0092-8674(94)90194-5. [DOI] [PubMed] [Google Scholar]
- 5.Nichols B J, Pelham H R. Biochim Biophys Acta. 1998;1404:9–31. doi: 10.1016/s0167-4889(98)00044-5. [DOI] [PubMed] [Google Scholar]
- 6.Robinson L J, Martin T F. Curr Opin Cell Biol. 1998;10:483–492. doi: 10.1016/s0955-0674(98)80063-x. [DOI] [PubMed] [Google Scholar]
- 7.Hay J C, Scheller R H. Curr Opin Cell Biol. 1997;9:505–512. doi: 10.1016/s0955-0674(97)80026-9. [DOI] [PubMed] [Google Scholar]
- 8.Hanson P I, Heuser J E, Jahn R. Curr Opin Neurobiol. 1997;7:310–315. doi: 10.1016/s0959-4388(97)80057-8. [DOI] [PubMed] [Google Scholar]
- 9.Christoforidis S, McBride H M, Burgoyne R D, Zerial M. Nature (London) 1999;397:621–625. doi: 10.1038/17618. [DOI] [PubMed] [Google Scholar]
- 10.Ungermann C, Sato K, Wickner W. Nature (London) 1998;396:543–548. doi: 10.1038/25069. [DOI] [PubMed] [Google Scholar]
- 11.Tsukada M, Will E, Gallwitz D. Mol Biol Cell. 1999;10:63–75. doi: 10.1091/mbc.10.1.63. [DOI] [PMC free article] [PubMed] [Google Scholar]
- 12.Cao X, Ballew N, Barlowe C. EMBO J. 1998;17:2156–2165. doi: 10.1093/emboj/17.8.2156. [DOI] [PMC free article] [PubMed] [Google Scholar]
- 13.Lupashin V V, Waters M G. Science. 1997;276:1255–1258. doi: 10.1126/science.276.5316.1255. [DOI] [PubMed] [Google Scholar]
- 14.Sapperstein S K, Walter D M, Grosvenor A R, Heuser J E, Waters M G. Proc Natl Acad Sci USA. 1995;92:522–526. doi: 10.1073/pnas.92.2.522. [DOI] [PMC free article] [PubMed] [Google Scholar]
- 15.Sönnichsen B, Lowe M, Levine T, Jamsa E, Dirac-Svejstrup B, Warren G. J Cell Biol. 1998;140:1013–1021. doi: 10.1083/jcb.140.5.1013. [DOI] [PMC free article] [PubMed] [Google Scholar]
- 16.Chen Y A, Scales S J, Patel S M, Doung Y C, Scheller R H. Cell. 1999;97:165–174. doi: 10.1016/s0092-8674(00)80727-8. [DOI] [PubMed] [Google Scholar]
- 17.Weber T, Zemelman B V, McNew J A, Westermann B, Gmachl M, Parlati F, Söllner T H, Rothman J E. Cell. 1998;92:759–772. doi: 10.1016/s0092-8674(00)81404-x. [DOI] [PubMed] [Google Scholar]
- 18.Sutton R B, Fasshauer D, Jahn R, Brunger A T. Nature (London) 1998;395:347–353. doi: 10.1038/26412. [DOI] [PubMed] [Google Scholar]
- 19.Poirier M A, Xiao W, Macosko J C, Chan C, Shin Y K, Bennett M K. Nat Struct Biol. 1998;5:765–769. doi: 10.1038/1799. [DOI] [PubMed] [Google Scholar]
- 20.Lin R C, Scheller R H. Neuron. 1997;19:1087–1094. doi: 10.1016/s0896-6273(00)80399-2. [DOI] [PubMed] [Google Scholar]
- 21.Hanson P I, Roth R, Morisaki H, Jahn R, Heuser J E. Cell. 1997;90:523–535. doi: 10.1016/s0092-8674(00)80512-7. [DOI] [PubMed] [Google Scholar]
- 22.Hohl T M, Parlati F, Wimmer C, Rothman J E, Söllner T H, Engelhardt H. Mol Cell. 1998;2:539–548. doi: 10.1016/s1097-2765(00)80153-7. [DOI] [PMC free article] [PubMed] [Google Scholar]
- 23.Skehel J J, Wiley D C. Cell. 1998;95:871–874. doi: 10.1016/s0092-8674(00)81710-9. [DOI] [PubMed] [Google Scholar]
- 24.Parlati F, Weber T, McNew J A, Westermann B, Söllner T H, Rothman J E. Proc Natl Acad Sci USA. 1999;96:12565–12570. doi: 10.1073/pnas.96.22.12565. [DOI] [PMC free article] [PubMed] [Google Scholar]
- 25.Sambrook J, Fritsch E F, Maniatis T. Molecular Cloning: A Laboratory Manual. Plainview, NY: Cold Spring Harbor Lab. Press; 1989. [Google Scholar]
- 26.Kendall D A, MacDonald R C. J Biol Chem. 1982;257:13892–13895. [PubMed] [Google Scholar]
- 27.Wilschut J, Papahadjopoulos D. Nature (London) 1979;281:690–692. doi: 10.1038/281690a0. [DOI] [PubMed] [Google Scholar]
- 28.Blackwood R A, Smolen J E, Hessler R J, Harsh D M, Transue A. Biochem J. 1996;314:469–475. doi: 10.1042/bj3140469. [DOI] [PMC free article] [PubMed] [Google Scholar]
- 29.Yeagle P L, Smith F T, Young J E, Flanagan T D. Biochemistry. 1994;33:1820–1827. doi: 10.1021/bi00173a027. [DOI] [PubMed] [Google Scholar]
- 30.Düzgünes N, Wilschut J. Methods Enzymol. 1993;220:3–14. doi: 10.1016/0076-6879(93)20069-f. [DOI] [PubMed] [Google Scholar]
- 31.Fiebig K M, Rice L M, Pollock E, Brunger A T. Nat Struct Biol. 1999;6:117–123. doi: 10.1038/5803. [DOI] [PubMed] [Google Scholar]
- 32.Nicholson K L, Munson M, Miller R B, Filip T J, Fairman R, Hughson F M. Nat Struct Biol. 1998;5:793–802. doi: 10.1038/1834. [DOI] [PubMed] [Google Scholar]
- 33.Kachar B, Fuller N, Rand R P. Biophys J. 1986;50:779–788. doi: 10.1016/S0006-3495(86)83518-4. [DOI] [PMC free article] [PubMed] [Google Scholar]
- 34.Hui S W, Nir S, Stewart T P, Boni L T, Huang S K. Biochim Biophys Acta. 1988;941:130–140. doi: 10.1016/0005-2736(88)90173-3. [DOI] [PubMed] [Google Scholar]
- 35.Xu T, Binz T, Niemann H, Neher E. Nat Neurosci. 1998;1:192–200. doi: 10.1038/642. [DOI] [PubMed] [Google Scholar]
- 36.Saifee O, Wei L, Nonet M L. Mol Biol Cell. 1998;9:1235–1252. doi: 10.1091/mbc.9.6.1235. [DOI] [PMC free article] [PubMed] [Google Scholar]
- 37.Katz L, Hanson P I, Heuser J E, Brennwald P. EMBO J. 1998;17:6200–6209. doi: 10.1093/emboj/17.21.6200. [DOI] [PMC free article] [PubMed] [Google Scholar]
- 38.Sato K, Wickner W. Science. 1998;281:700–702. doi: 10.1126/science.281.5377.700. [DOI] [PubMed] [Google Scholar]


