Abstract
Kinesin is a dimeric motor protein that transports organelles in a stepwise manner toward the plus-end of microtubules by converting the energy of ATP hydrolysis into mechanical work. External forces can influence the behavior of kinesin, and force-velocity curves have shown that the motor will slow down and eventually stall under opposing loads of ≈5 pN. Using an in vitro motility assay in conjunction with a high-resolution optical trapping microscope, we have examined the behavior of individual kinesin molecules under two previously unexplored loading regimes: super-stall loads (>5 pN) and forward (plus-end directed) loads. Whereas some theories of kinesin function predict a reversal of directionality under high loads, we found that kinesin does not walk backwards under loads of up to 13 pN, probably because of an irreversible transition in the mechanical cycle. We also found that this cycle can be significantly accelerated by forward loads under a wide range of ATP concentrations. Finally, we noted an increase in kinesin’s rate of dissociation from the microtubule with increasing load, which is consistent with a load dependent partitioning between two recently described kinetic pathways: a coordinated-head pathway (which leads to stepping) and an independent-head pathway (which is static).
Kinesin is a homodimeric motor protein that uses the energy of ATP hydrolysis to transport organelles toward the plus-end of microtubules against the viscous drag of the cytoplasm. Each subunit consists of a ≈7 nm (≈340 amino acid) globular motor domain (head) connected to a ≈75 nm (≈500 amino acid) α-helical tail involved in dimerization (1). Like the motor proteins myosin and dynein, kinesin performs work by coupling a chemical ATPase cycle with a mechanical cycle resulting in an incremental movement and force production. Because kinesin is thought to operate alone or in small groups, it must be able to remain bound to the microtubule for numerous consecutive cycles before dissociating (termed processivity) to travel distances that are useful on a cellular length scale. The mechanism for coupling the ATPase and mechanical cycles, the directionality, the force generation event (power stroke), and the putative coordination between kinesin’s two motor domains during processive movement all need to be elucidated to achieve a comprehensive understanding of kinesin function.
Recent technological advances have opened the door to investigations of discrete nanometer-size movements and piconewton forces produced by individual motor molecules in vitro (2–5). This approach has proven fruitful in characterizing the stochastic behavior of kinesin. Studies have shown that kinesin moves in discrete steps along the microtubule (2, 6) and that it slows down linearly as a function of increasing load until it comes to a stall (5, 7–9). These studies have provided valuable information about the efficiency of the motor and the variability of its chemomechanical coupling. However, they are consistent with a variety of phenomenological models of kinesin motility.
To learn more about the mechanism of kinesin, we have examined the behavior of this motor under previously unexplored load regimes. Earlier studies have investigated the effects of “backward” loads (directed toward the microtubule’s minus-end) in the range of 0 to ≈5 pN. We extend this range to ≈13 pN and find that the motor cannot walk backwards. This is consistent with the existence of an irreversible step in the mechanical cycle that may contribute to kinesin’s unidirectionality. We also exert a “forward” load (toward the microtubule’s plus-end) and note a significant acceleration relative to the unloaded regime. Finally, we report that the dissociation rate of the motor from the microtubule increases as a function of backward load when the velocity is decreasing, and then becomes insensitive to load once the motor is stalled. In light of recent kinetic studies (10, 11), these findings can be interpreted quantitatively as a load-dependent kinetic partitioning between the normal processive pathway for coordinated heads and a static nonprocessive pathway of independent heads.
MATERIALS AND METHODS
Materials.
Native squid kinesin was purified according to the method of Schnapp and Reese (12), and sea urchin axonemes were prepared according to Gibbons and Fronk (13). The in vitro motility assay has been described (6). Briefly, kinesin was adsorbed at low density onto 1-μm casein-coated carboxylated latex beads (Polysciences) and the beads were introduced into a ≈200-μm-deep assay chamber whose inner surface was prebound with rhodamine-labeled axonemes [5-(and-6)carboxytetramethylrhodamine succinimidyl ester; Molecular Probes]. The assay was conducted at 25°C in assay buffer [BRB80 (80 mM Pipes/1 mM MgCl2/1 mM EGTA, pH 6.8) supplemented with 5 μM to 1 mM MgATP/13 mM glucose/40 μg/ml glucose oxidase/0.13 mg/ml catalase/0.26% 2-mercaptoethanol/0.5 mg/ml casein/18 mM NaCl].
Instrumentation.
The instrument used in the assay is a custom-made, inverted single beam (1047 nm neodium:YLF laser, Spectra-Physics) trapping microscope (14) equipped with a Xenon lamp (Oriel, Stamford, CT) for bright field and epifluorescence imaging. The principles of operation for this kind of instrument have been reviewed recently (15). The bright field image is cast upon both a charge-coupled camera (CCD) camera and a quadrant photodiode detector (QPD), whereas the fluorescence image is directed to a silicon intensified (SIT) camera for visualization of the axonemes.
The signals from the QPD were amplified and differenced were checked with a Cyberamp 380 (Axon instruments, Foster City, CA) whose 4th order analog Bessel filters were set to 10 kHz (3–4 times the corner frequency of the Brownian noise in this assay) and then digitized at 1 kHz. Data acquisition and analysis (see below) were performed with custom software developed in labview (National Instruments, Austin, TX). The QPD was calibrated by moving it a known distance relative to the image of an immobilized bead. The trap was calibrated for each bead by applying the equipartition theorem to the variance in the position of a trapped bead before it was brought into contact with an axoneme. To assess the linearity of the trap, its pulling force at various distances from its center was calculated with Stokes’ law from the instantaneous centripetal speed of a bead as it was being captured (10 kHz analog low-pass; 24 kHz sampling). The trapping force increases linearly with distance from the center out to ≈100 nm and reaches a maximum at ≈150 nm.
Determination of Motor Position.
The elastic tether between the motor and the bead (kmotor) behaves as a nonlinear spring under low loads (6, 7) and varies somewhat from bead to bead. Therefore, to accurately calculate the motor’s position from the measured bead position, the tether’s load-dependent spring constant was characterized for each motor as follows. The variance in bead position was measured for each run of the motor along the axoneme (using a sliding 50-point window). The sharp peaks produced when the window crossed displacements steps were rejected (i.e., where the 50-point linear regression slope of the time course of the variance exceeded 0.01), and the remaining variance data was used to calculate the spring constant of the whole system using the equipartition theorem. The spring constant was then plotted as a function of load (calculated from the concomitant bead position), and the data was fit with an inverse exponential whose y intercept agreed with the independently measured trap stiffness (ktrap). The motor’s spring constant asymptotically approached a value of ≈0.3 pN/nm under a load of ≈3 pN. Using the fitted function for the load dependence of kmotor, the time course of the motor’s position, xmotor(t), was calculated from that of the bead’s position, xbead(t), according to xmotor(t) = xbead(t)⋅[(kmotor + ktrap)/kmotor].
Force–Velocity (F–V) Curves.
F–V curves were obtained for individual runs by applying a 300-ms sliding linear regression window to xmotor(t) and plotting the slope as a function of load (calculated from the bead position). Because of the following considerations, deriving a mean F–V curve from 50 to 100 individual F–V curves required a small correction to compensate for biased sampling. Only about 40% of runs reached a stall plateau, and the latter were distributed in a wide range of 3–7 pN. In the other 60% of runs, the motor dissociated before stalling. The number of runs represented at each (binned) load interval decreased as a function of load, because some of the runs dropped out along the way either by stalling or by dissociating at lower loads. This effect leads to a biased sampling at high loads. For example, if a motor stalled at 4 pN, it should also be stalled under a load of 5 pN; however, it fails to travel to the 5-pN load region and, therefore, fails to contribute to the mean calculated at 5 pN. To compensate for this bias, the motors that dropped out were assumed to have zero velocity at higher loads (mostly >4 pN). This correction had only a minor effect on the shape of the F–V curve (steepening and shifting its linear region slightly to the left), and it helped to decrease the scatter caused by runs abruptly dropping out. Under forward loads, no correction was necessary because the motors did not stall and rarely dissociated before reaching the center of the trap.
Dissociation Rates.
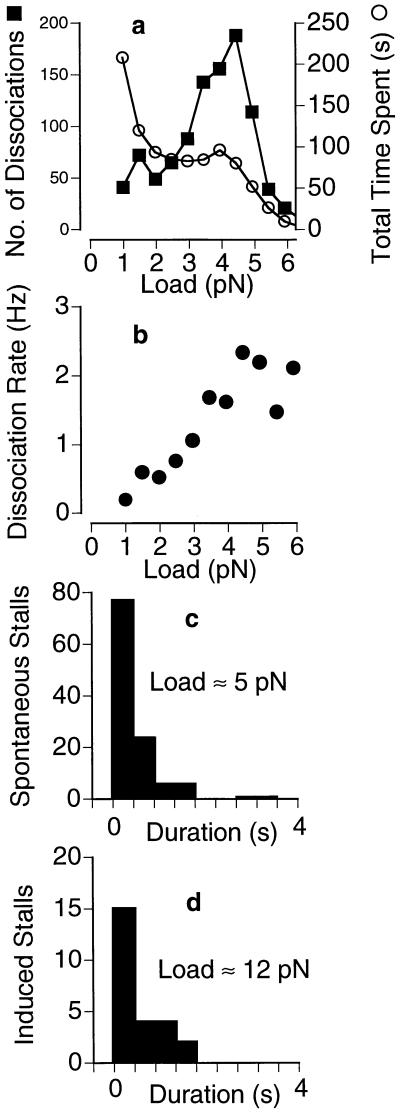
The load dependence of the dissociation rate was calculated from numerous runs by dividing the distribution of dissociation loads by the distribution of time spent by the motor under corresponding loads (see Fig. 3 legend).
Figure 3.
Load dependence of kinesin’s dissociation rate in 40 μM ATP. Kinesin was allowed to take numerous runs (n = 1,050) along the microtubule like the ones shown in Fig. 1. (a) The load at the end point of each run was included in an overall distribution of dissociation loads (▪). The amount of time (number of points) spent under each load was also measured (○). (b) The ratio of these two distributions yields the dissociation rate, which is seen to increase with load up to ≈2/s at ≈5 pN. (c and d) The distribution of stall durations is approximately exponential, with a load-independent mean of 0.57 s (c, ≈5 pN; d, ≈12 pN) corresponding to a dissociation rate of 1.8/s. (Trap stiffness = 0.06 pN/nm.)
Measurements of plateau durations were carried out by visually identifying their start and end points. Because the start of a plateau was not always sharply defined (some curves approached it asymptotically), we only scored a subset of runs featuring unambiguous plateau start points. The end point was always well defined by an abrupt drop off. We estimate ≈10% uncertainty in measuring the durations of the selected plateaus by this method.
RESULTS
The experimental assay used in this study has been described (6). Native squid kinesin was sparsely adsorbed onto the surface of 1-μm casein-coated latex beads that were then introduced into a perfusion chamber containing surface-bound fluorescently labeled sea urchin axonemes [structured bundles of doublet-microtubules (16)]. Because of their rigidity and affinity for glass, axonemes constitute a convenient and stable experimental substrate for kinesin motility (17). Individual beads, visualized by video microscopy, were captured with a laser trap and brought into contact with an axoneme by translating the stage, where each was held for up to 1 min to promote a kinesin–microtubule interaction. If the bead failed to move, it was considered devoid of functional kinesin and a new bead was tested. The kinesin concentration was adjusted such that only about half of the beads exhibited movement. Assuming a random distribution of kinesin on the bead surface, >98% of the observed movements are expected to be generated by a single kinesin molecule (2, 7).
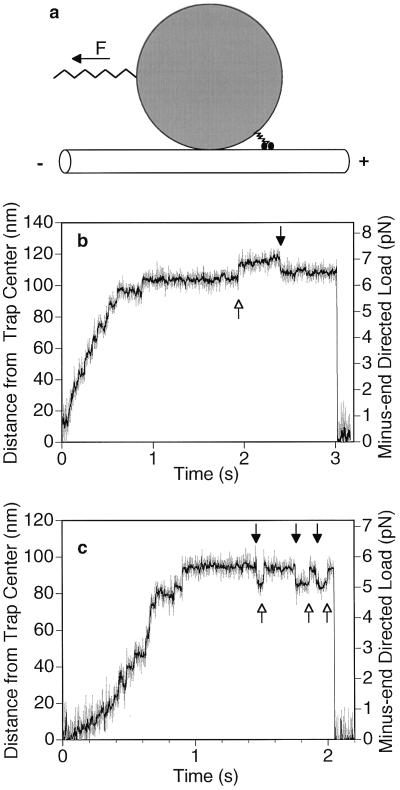
The assay can be modeled as a sphere tethered between two springs: the optical trap on one side and the kinesin-bead linkage on the other (Fig. 1a). The left end of the trap spring remains fixed whereas the right end of the motor spring, connected to kinesin’s dual motor domains, advances along the microtubule. The trap behaves as a linear spring (with tunable spring constant ktrap), whereas the motor spring is reasonably linear only for loads exceeding ≈2 pN (see Materials and Methods). The characteristics of the motor spring are also slightly variable from bead to bead. Therefore, we calculated the load dependence of the motor spring constant, kmotor, for each bead. This was achieved by applying the equipartition theorem to the measured amplitude of the Brownian movement: kmotor(L) = [kbT/σ2(L)] − ktrap, where kbT is the mean thermal energy in the springs, σ2 is the positional variance of the bead during a pause between steps, and (L) denotes the load dependence.
Figure 1.
Schematic of the in vitro motility bead assay (not to scale) and examples of displacement data. (a) A single two-headed kinesin molecule adsorbed on the surface of a 1-μm carboxylated latex bead walks toward the plus-end of the microtubule under the opposing (backward) load of an optical trap (F) that acts as a spring. The tether (kinesin tail) between the motor heads and the bead also acts as a spring. The external load can also be directed toward the plus-end of the microtubule to test the behavior of kinesin under a forward load (see Fig. 4). (b and c) Examples of raw data for the bead moving away from the center of the trap against an increasing load. Gray, unfiltered; black, processed with a nonlinear digital moving-average filter (18). Some discrete movements are clearly visible before and during the stall. Balanced back-and-forth movements occur during the stall (arrows), but multiple consecutive backward movements are not seen. When kinesin dissociates the bead falls back into the center of the trap. (Trap stiffness = 0.06 pN/nm; [ATP] = 40 μM.)
The position of the bead was measured at 1-ms intervals with nanometer accuracy as the motor pulled it along the microtubule. Because of the compliance of the motor–bead linkage, the movements of the bead are smaller than those of the motor. The position of the motor relative to the center of the trap, xmotor, can be calculated from that of the bead, xbead, if the spring constants are known: xmotor = [(ktrap + kmotor)/kmotor]⋅xbead.
Movement Away from Trap Center Under Backward Load.
In a typical run (Fig. 1 b and c), a single kinesin molecule pulled the bead along the microtubule away from the center of the trap under an increasing backward load until it stalled at 4–8 pN (2, 6, 7). Discrete steps could often be observed as previously reported (2, 6). The stall regime can be identified as a horizontal plateau in most of the displacement records. Each run ended upon dissociation of kinesin from the microtubule, followed by a rapid (<1 ms) return of the bead to the center of the trap, whereupon kinesin could begin a new run.
Discrete backward movements similar to those noted in previous studies (5, 19) were also frequently observed, most notably while the motor was stalled (Fig. 1 b and c, black arrows) and during long pauses that occur at low (5 μM) ATP (not shown). On average, at 40 μM ATP, one-third of the stall plateaus contained a clearly distinguishable backward movement. Interestingly, repeated consecutive backward movements were not observed, but alternating back-and-forth movements were common (Fig. 1 b and c).
The magnitudes of the back-and-forth movements of the motor were the same for both directions: each distribution contained a peak at 8–10 nm (whose exact position varies with histogram bin width), which is consistent with the longitudinal periodicity of the microtubule lattice (8 nm). One possible explanation for these observations is that one head remains firmly bound as an anchor while the other head alternates between accessible binding sites on either side of the anchoring head. The distribution of backward step sizes did not contain peaks at multiples of 8 nm, which argues against a complete dissociation of both heads followed by a fortuitous rebinding as the bead is falling back toward the center of the trap.
To investigate whether the back-and-forth movements were related to the enzymatic activity of the motor, kinesin was subjected to forces of 0–10 pN while attached in rigor to a microtubule in the presence of the nonhydrolyzable nucleotide adenylyl imidodiphosphate (AMPPNP) (40 μM) (data not shown). This was achieved through small displacements of the microscope stage (≈200 nm) parallel to the axoneme to move the immobilized bead away from the center of the trap. No back-and-forth movements were ever observed under these conditions, which suggests that they involve states that are adopted only in the presence of ATP.
Kinesin Remains Stalled Under High Backward Loads.
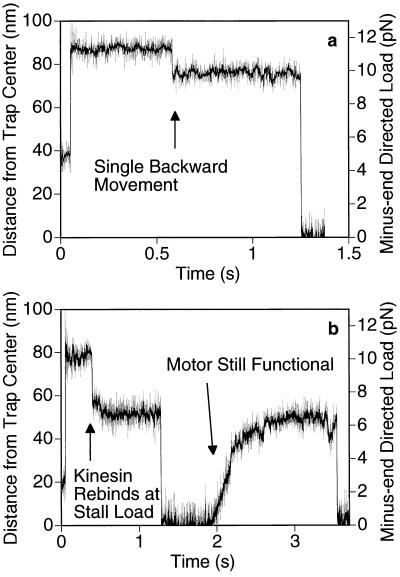
Because backward movements were most frequent under a stall load (at the end of a normal run), we sought to determine if exerting an even greater backward load might induce more backward steps, thereby reversing the overall directionality of the motor. To answer this question, we abruptly increased the load on a moving kinesin into the 10- to 15-pN range (2–3 × stall load) by moving the microscope’s piezo-driven stage relative to the trap in a direction parallel to the axoneme. In dozens of trials, the motor always stalled immediately (referred to hereafter as an “induced stall”). The behavior of the motor during an induced stall was similar to that during a spontaneous stall at ≈5 pN. Balanced back-and-forth movements could occur, but multiple consecutive forward or backward steps were not seen. A common outcome involved a single backward movement followed by a dissociation (Fig. 2b). During its rapid return toward the center of the trap, the motor would occasionally rebind to the microtubule (always at or below the usual stall load) and resume its normal movement away from the trap center until it reached a natural stall. This indicates that the motor was still functional after being subjected to an induced stall (Fig. 2b).
Figure 2.
Behavior of kinesin under super-stall loads. While kinesin was moving away from the trap center, the microscope’s piezo stage was abruptly moved by ≈70 nm (at the 50-ms time point in a and b) in the same direction to raise the load to 10–12 pN. (The axoneme and the motor move the same distance as the stage, but the bead only moves ≈60 nm because of the compliance of the motor-bead linkage.) The motor stalls immediately and never walks backwards to the normal stall load of ≈5 pN, although a single backward movement prior to dissociation is common (a). As the bead falls back toward the center of the trap, kinesin can occasionally rebind to the microtubule but only at positions where the load is smaller or equal to the stall load (b). (Trap stiffness = 0.13 pN/nm; [ATP] = 40 μM.)
Load-Dependent Dissociation Kinetics.
To compare moving and stalled behaviors of kinesin, the rates of dissociation from the microtubule were measured as a function of load for 1,050 runs. For each load interval, F ± ΔF, the number of dissociations observed was divided by the total amount of time spent by the motor in the same load interval to yield dissociation rates (Fig. 3). At 40 μM ATP, the dissociation rate rises with load from 0.2 s−1 at 1 pN to ≈2 s−1 at 5 pN, indicating that the ability of an active kinesin to hold onto the microtubule is impaired by the presence of an external backward load. The mean durations of spontaneous (≈5 pN) and induced (≈12 pN) stalls were both 0.57 s (Fig. 3 c and d), which corresponds to a dissociation rate (1.8 s−1) that is similar to those at the highest loads in Fig. 3b. These observations indicate that the dissociation rate increases with load as long as the motor is moving, but then becomes independent of load once the motor stalls.
Kinesin Exhibits Normal Motion Under Forward Loads.
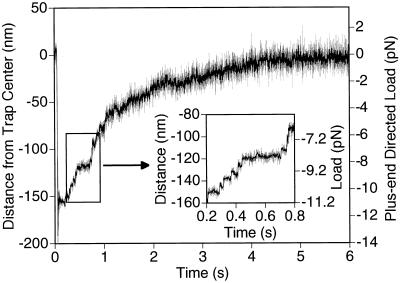
To investigate whether the speed of kinesin could be increased, a forward load was exerted on a moving motor by suddenly translating the stage in the opposite direction. The motor usually remained bound to the microtubule and moved stepwise toward the center of the trap (Fig. 4). In some runs, the motor passed through the center of the trap and out the other side, where it continued to walk under a backward load until it reached a stall load (data not shown). Discrete forward steps could be identified (Fig. 4 Inset), suggesting that the motor was executing normal mechanical cycles.
Figure 4.
Kinesin-driven movement under forward (plus-end directed) loads. At the 50-ms time point, the piezo stage was abruptly moved ≈200 nm in the direction opposite to that of kinesin movement to place the trap center in front of the motor. The Inset illustrates the observable stepwise character of the movement. The apparent deceleration as the bead approaches the center of the trap, and subsequent apparent long pause, is due to the bead reaching this position in advance of the motor (because of the geometry shown in Fig. 1a) and then rotating in place as the motor walks along the microtubule underneath it.
F–V Curves.
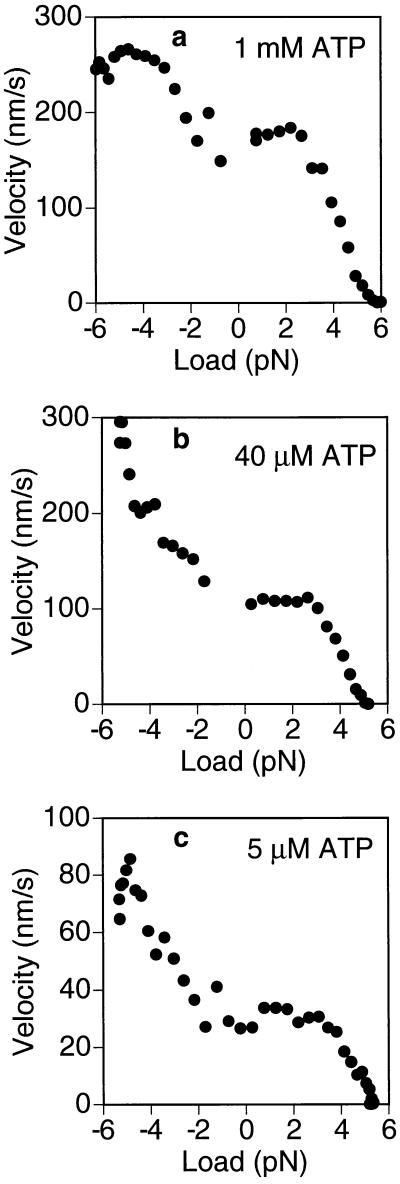
From the experiments described above, it was possible to calculate mean F–V curves that extend into the previously unexplored forward load regime. Mean kinesin F–V curves were obtained for ATP concentrations of 1 mM, 40 μM, and 5 μM (Fig. 5 a–c, respectively) by averaging the F–V curves for numerous individual runs (see Materials and Methods and Fig. 5 legend). The left and right sides of the graphs correspond to forward (plus-end directed) and backward (minus-end directed) loads, respectively. The right side of the F–V curves has been measured previously (5, 7–9), and the present data are broadly consistent with those studies.
Figure 5.
F–V curves for kinesin under ATP concentrations of 1 mM (a), 40 μM (b), and 5 μM (c) in a 0.06 pN/nm trap. The right side of each plot (positive loads) pertains to backward loads opposing the movement of the motor. The left side (negative loads) pertains to the forward loading regime derived from experiments like the one shown in Fig. 4. Under a forward load of 5 pN, the motor moves ≈3 times faster than under 0 pN when ATP is rate limiting (b and c), but only about 50% faster under saturating ATP concentrations (1 mM) (a). The F–V curve is approximately linear in the 2- to 5-pN range. Approximately 100 runs were used for each curve. The F–V curve was obtained for each run individually by running a sliding 300-point linear regression. To control for the effects of biased sampling in calculating the mean at high loads, the runs that did not make it out to high loads were assumed to have zero velocity at those loads (see Materials and Methods). Therefore, the right side of the plots represents a lower bound on the estimate for the true F–V curve. Without this correction, the curves would contain slightly more scatter due to runs abruptly dropping out and lie ≈1 pN farther to the right (not shown).
In the forward loading regime, kinesin can move considerably faster than in the absence of load, exhibiting a ≈3-fold velocity increase under 5 pN if the ATP concentration is rate limiting (Fig. 5 b and c). At saturating ATP (1 mM), the relative increase was only ≈50%. Interestingly, for loads >5 pN the velocity appeared to drop off sharply (data not shown), although the amount of data available for high forward loads is currently limited, and further studies will be needed investigate this effect. It is interesting to note that neither the relative nor the absolute load-dependent velocity increase is independent of ATP concentration, which imposes some constraints on the possible explanations for the acceleration (see Discussion).
DISCUSSION
We have investigated the behavior of individual kinesin molecules under load, including previously unexplored super-stall and forward-loading conditions. As kinesin walks away from the center of the optical trap under an increasing backward load its forward movement slows down and its dissociation rate from the microtubule increases, until it reaches the stall load of ≈5 pN. The stalled motor can undergo balanced back-and-forth movements comparable in magnitude to the dimensions of a tubulin dimer. Under super-stall loads of up to 13 pN, the motor remains bound but does not walk backwards. With the assistance of a forward load, kinesin’s speed increases significantly. Below we propose potential interpretations for these observations and illustrate how they might complement recent kinetic models (10, 11, 20, 21).
With increasing backward load, kinesin slows down to a stall while its dissociation rate increases. Once the velocity reaches zero, further increases in load have no effect on the dissociation rate. This observation is typical of kinetic partitioning: the dimeric motor reaches a state from which it can either commit to a forward step or follow an alternate pathway that leads it through a state in which both heads are weakly bound and the motor can release from the microtubule. This alternative pathway is favored when the normal stepping pathway is inhibited by load, leading to an increased dissociation rate.
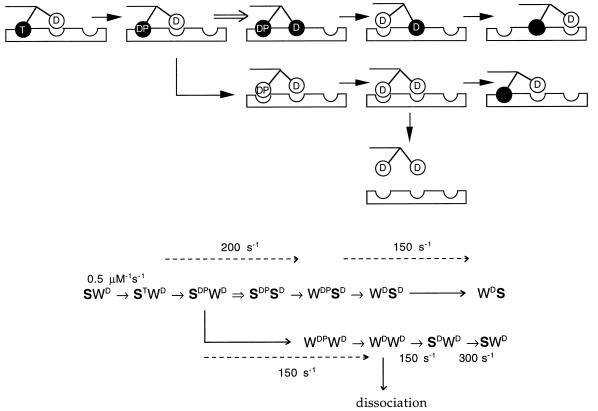
The foregoing ideas are illustrated in Fig. 6, which is based on the kinetic model of Ma and Taylor (10, 11), where T, D, and P denote ATP, ADP, and phosphate, respectively; S is a strong-binding state; and W is a weak-binding state. The model of Ma and Taylor proposes alternating, coordinated enzymatic cycles of the two motor domains of the kinesin dimer, such that the two heads take turns in binding strongly to the microtubule (which lowers the affinity of the bound head for ADP) (10, 11). However, the authors point out the likely existence of a short-lived state in which both heads are strongly bound to the microtubule. Our scheme expands their model to include a load-dependent transition to this intermediate state (double arrow in Fig. 6). The upper pathway pertains to a correlated-head cycle that succeeds in coupling the ATPase activity to a forward step. The motor is diverted into the lower pathway when forward stepping is inhibited by load. Note that in the latter case, the anterior head remains permanently in the weak binding state and the posterior head cycles independently as if it were a monomer. The rate constants shown were measured by Ma and Taylor (10, 11).
Figure 6.
A chemomechanical model of kinesin movement under minus-end directed loads. A simplified cartoon (Upper) depicts an example of an alternating head cycle that is consistent with the proposed kinetic scheme (Lower). In the drawing three adjacent microtubule binding sites are shown. Kinesin moves from left to right toward the plus-end of the microtubule, with its tail tensioned to the left by the laser trap. Black circle, strong binding head; white circle, weak binding head (which may be dissociated or interacting with the binding site); T, ATP; D, ADP; P, phosphate. Some arrows bundle several transitions to simplify the illustration of kinetic partitioning and processivity. The proposed load-dependent transition is represented as a double arrow (⇒), which commits the motor to a net forward movement by allowing the anterior head to adopt a strong binding state (upper pathway). Under high load, this transition is inhibited and the partner head continues its kinetic cycle independently, without achieving a forward step (bent arrow leading to lower pathway). States in which both heads are weakly bound are susceptible to complete dissociation. The rate constants shown in the bottom scheme, where W is weak and S is strong, are those recently reported by Ma and Taylor (10). Several variations on this theme are possible because the chemical intermediates that correspond to the strong and weak states and that are involved in the commitment step (⇒) have not yet been fully defined.
When the load-dependent transition (⇒) becomes very slow under a load approaching 5 pN, the motor cycles primarily through the (lower) decoupled pathway as if it were a monomer, and the occupancy of the WDWD state increases. The steady-state solution to the rate equations for this pathway at 40 μM ATP yields an occupancy probability of 0.05 for the WDWD state. Given a measured dissociation rate of ≈2/s, the dissociation rate constant comes out to ≈40/s (2/0.05), which is half of that reported for a monomeric construct by Ma and Taylor (≈80/s) (10). The 2-fold difference is consistent with a mechanism in which each head undergoes a stochastic dissociation independent of the other head, as if each were a monomer (22). It is also interesting to note that, in this model, the steady-state ATPase rate is only slightly lower at stall than under zero load (the difference is ≈25% at 1 mM ATP, 5% at 40 μM ATP, and <1% at 5 μM ATP). The foregoing analysis supports the notion that kinesin is a loosely coupled motor featuring a load-dependent mechanical transition that is not obligatory for completion of the enzymatic cycle (7, 11, 23–25).
The general scheme described above could also potentially explain the stepping behavior of kinesin under high backward loads. In order for kinesin to remain bound to the microtubule it is likely that at least one head must be in a strong binding state. It is also likely that the partner head must be in a weak binding state to move between binding sites. The weakly bound head might be able to transiently associate with accessible binding sites in front and back of the strongly bound anchoring head, thereby producing back-and-forth movements. We propose that if the weak-binding head is interacting with an anterior binding site as the partner head hydrolyzes an ATP it can undergo a W → S load-dependent transition which preserves the last forward step. Under high backward loads, this transition could be very slow, and the strongly bound partner head could complete its ATPase cycle independently. Moreover, if this transition can occur only on a forward binding site the motor will not walk backwards processively, in agreement with our findings at super-stall loads. This interpretation of our results is consistent with an inherent asymmetry in the kinesin–microtubule complex.
Under a forward load, the velocity of stepwise movement increases significantly (up to 3-fold at low ATP). Numerous effects could contribute to this phenomenon, including an increased ATP association rate constant, ATP-independent steps, slipping, larger steps, or an increase in coupling efficiency. However, none of these effects alone could account quantitatively for the observed behavior. Increasing the ATP association rate constant to the diffusion limit could not account for the ≈50% increase in velocity (compared with the unloaded velocity) seen under saturating ATP concentration, because ATP binding is not rate limiting in the cycle. The occurrence of ATP-independent steps or slipping would be expected to produce an ATP-independent absolute increase in velocity, which was not observed. By visual inspection of individual forward steps, it did not appear that those taken under a forward load were consistently longer than those taken under a backward load. Finally, changes in coupling efficiency favoring the upper pathway in the scheme above (due to an increase in the proposed load-dependent rate constant) could not account for a 3-fold velocity change under low ATP conditions, where this transition is not rate limiting. Moreover, the change in coupling efficiency would demand that the unloaded efficiency under limiting ATP concentrations be as low as 30%, which seems unlikely. These considerations suggest that the velocity increase under forward loads may involve several synergistic effects, and further studies will be needed elucidate them.
In summary, this study lends support to recent kinetic models (10, 11, 20, 21) and suggests that kinesin’s normal coordinated head mechanism for chemomechanical coupling gives way to an uncoupled monomeric mechanism under heavy load. We adopt the view that kinesin is a loosely coupled motor whose coupling efficiency is determined by a single load-dependent W → S transition that is also responsible for inter-head coordination. Kinesin can be made to move considerably faster under forward loads, but cannot be made to move backwards. The data presented here should provide further constraints for models of kinesin’s chemomechanical mechanism (23–25).
Acknowledgments
We thank Drs. Ryan Case, Paul Hillner, Truc Pham, Laura Romberg, Ed Taylor, and Guenther Woelke for valuable discussions and review of the manuscript. This work was supported in part by a fellowship from the California Affiliate of the American Heart Association.
ABBREVIATION
- F–V
force–velocity
References
- 1.Vale R D. In: Kinesin. Kreis T, Vale R, editors. Oxford: Oxford Univ. Press; 1993. pp. 199–201. [Google Scholar]
- 2.Svoboda K, Schmidt C F, Schnapp B J, Block S M. Nature (London) 1993;365:721–727. doi: 10.1038/365721a0. [DOI] [PubMed] [Google Scholar]
- 3.Finer J T, Simmons R M, Spudich J A. Nature (London) 1994;368:113–118. doi: 10.1038/368113a0. [DOI] [PubMed] [Google Scholar]
- 4.Ishijima A, Harada Y, Kojima H, Funatsu T, Higuchi H, Yanagida T. Biochem Biophys Res Commun. 1994;199:1057–1063. doi: 10.1006/bbrc.1994.1336. [DOI] [PubMed] [Google Scholar]
- 5.Meyhöfer E, Howard J. Proc Natl Acad Sci USA. 1995;92:574–578. doi: 10.1073/pnas.92.2.574. [DOI] [PMC free article] [PubMed] [Google Scholar]
- 6.Coppin C M, Finer J T, Spudich J A, Vale R D. Proc Natl Acad Sci USA. 1996;93:1913–1917. doi: 10.1073/pnas.93.5.1913. [DOI] [PMC free article] [PubMed] [Google Scholar]
- 7.Svoboda K, Block S M. Cell. 1994;77:773–784. doi: 10.1016/0092-8674(94)90060-4. [DOI] [PubMed] [Google Scholar]
- 8.Hunt A J, Gittes F, Howard J. Biophys J. 1994;67:766–781. doi: 10.1016/S0006-3495(94)80537-5. [DOI] [PMC free article] [PubMed] [Google Scholar]
- 9.Gittes F, Meyhöfer E, Baek S, Howard J. Biophys J. 1996;70:418–429. doi: 10.1016/S0006-3495(96)79585-1. [DOI] [PMC free article] [PubMed] [Google Scholar]
- 10.Ma Y Z, Taylor E W. J Biol Chem. 1997;272:717–723. doi: 10.1074/jbc.272.2.717. [DOI] [PubMed] [Google Scholar]
- 11.Ma Y Z, Taylor E W. J Biol Chem. 1997;272:724–730. doi: 10.1074/jbc.272.2.724. [DOI] [PubMed] [Google Scholar]
- 12.Schnapp B J, Reese T J. Proc Natl Acad Sci USA. 1989;86:1548–1552. doi: 10.1073/pnas.86.5.1548. [DOI] [PMC free article] [PubMed] [Google Scholar]
- 13.Gibbons I R, Fronk E. J Biol Chem. 1979;254:187–196. [PubMed] [Google Scholar]
- 14.Simmons R M, Finer J T, Chu S, Spudich J A. Biophys J. 1996;70:1813–22. doi: 10.1016/S0006-3495(96)79746-1. [DOI] [PMC free article] [PubMed] [Google Scholar]
- 15.Svoboda K, Block S M. Annu Rev Biphys Biomol Struct. 1994;23:247–285. doi: 10.1146/annurev.bb.23.060194.001335. [DOI] [PubMed] [Google Scholar]
- 16.Alberts B, Bray D, Lewis J, Martin R, Roberts K, Watson J. Molecular Biology of the Cell. New York: Garland; 1994. [Google Scholar]
- 17.Block S M, Goldstein L S, Schnapp B J. Nature (London) 1990;348:348–352. doi: 10.1038/348348a0. [DOI] [PubMed] [Google Scholar]
- 18.Chung S H, Kennedy R A. J Neurosci Methods. 1991;40:71–86. doi: 10.1016/0165-0270(91)90118-j. [DOI] [PubMed] [Google Scholar]
- 19.Svoboda K, Mitra P P, Block S M. Proc Natl Acad Sci USA. 1994;91:11782–11786. doi: 10.1073/pnas.91.25.11782. [DOI] [PMC free article] [PubMed] [Google Scholar]
- 20.Hackney D D. Proc Natl Acad Sci USA. 1994;91:6865–6869. doi: 10.1073/pnas.91.15.6865. [DOI] [PMC free article] [PubMed] [Google Scholar]
- 21.Moyer M L, Gilbert S P, Johnson K A. Biophys J. 1997;72:A61. (abstr.). [Google Scholar]
- 22.Kao E P C. An Introduction to Stochastic Processes. Belmont: Wadsworth; 1997. p. 21. [Google Scholar]
- 23.Derényi I, Vicsek T. Proc Natl Acad Sci USA. 1996;93:6775–6779. doi: 10.1073/pnas.93.13.6775. [DOI] [PMC free article] [PubMed] [Google Scholar]
- 24.Duke T, Leibler S. Biophys J. 1996;71:1235–1247. doi: 10.1016/S0006-3495(96)79323-2. [DOI] [PMC free article] [PubMed] [Google Scholar]
- 25.Peskin C S, Oster G. Biophys J. 1995;68:202s–211s. [PMC free article] [PubMed] [Google Scholar]


