Abstract
We investigated the defensive behavior of honeybees under controlled experimental conditions. During an attack on two identical targets, the spatial distribution of stings varied as a function of the total number of stings, evincing the classic “pitchfork bifurcation” phenomenon of nonlinear dynamics. The experimental results support a model of defensive behavior based on a self-organizing mechanism. The model helps to explain several of the characteristic features of the honeybee defensive response: (i) the ability of the colony to localize and focus its attack, (ii) the strong variability between different hives in the intensity of attack, as well as (iii) the variability observed within the same hive, and (iv) the ability of the colony to amplify small differences between the targets.
In recent years, a number of studies of defensive behavior in honeybees have been conducted, stimulated in part by the arrival in the United States of aggressive Africanized honeybees (1, 2). The majority of work on this subject has focused on the influence of genetic and environmental factors (3–6) on the defensive behavior. There are almost no studies that attempt to explain the collective (colony-level) pattern of attacks or the dynamics that govern them. However, recent studies of food recruitment processes, building behavior, and social differentiation in insect societies (7–11) or in societies of other gregarious arthropods (12) have shown the importance of mechanisms based on self-organization. In such recruitment systems, positive feedback plays a key role.
The collective defensive response of honeybees is another example of a recruitment (amplification) process in social insects. This work investigates the mechanism underlying the honeybee defensive response by examining the spatial distribution of stings during attacks by European honeybees (Apis mellifera mellifera) on two identical targets.
Materials and Methods
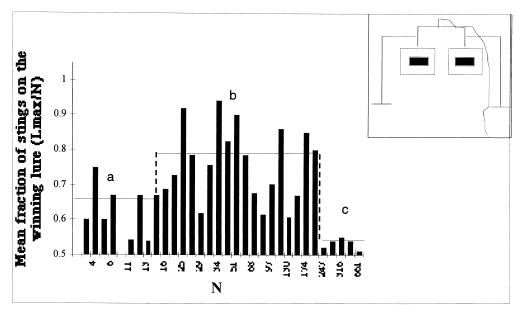
During the summer of 1997, 45 experiments were carried out at Bures-sur-Yvette, France, on five hives containing populations of between 20,000 and 40,000 worker bees. Our experimental setup was similar to that used in other studies of the defensive response of Africanized honeybees. In the first set of experiments, we used two targets of black leather patches (13) measuring 20 cm by 15 cm centered on a support of white cardboard measuring 50 cm by 50 cm. The targets were separated by 50 cm and were positioned 50 cm from the entrance of the hives (Fig. 1 Inset). In a second set of experiments, the same experimental setup was used, except that one of the two targets received three stings just before the experiment. In a third set of experiments, we used a single, large target (30 cm by 30 cm; Fig. 2) rather than two smaller, separate targets. The targets were connected to a pendulum system in such a way that the targets could be kept moving by the experimenter who was positioned behind the hives.
Figure 1.
Evaluation of the relationship between the fraction of the number of stings on the most attacked lure (Lmax/N) and the total number of stings on the two lures (N) carried out in a function of N. A value close to 0.5 indicates a symmetrical attack. Three zones are observed: two (a and c) without significant difference when compared with a binomial of parameter 0.5 (χ2 = 1.68 and 4.35 for 19 and 4 df, respectively) and one (b) with significant difference when compared with a binomial of parameter 0.5 (χ2 = 204.3 for 20 df). The solid line indicates the mean value of Lmax/N for each zone. (Inset) Experimental setup (see Materials and Methods).
Figure 2.
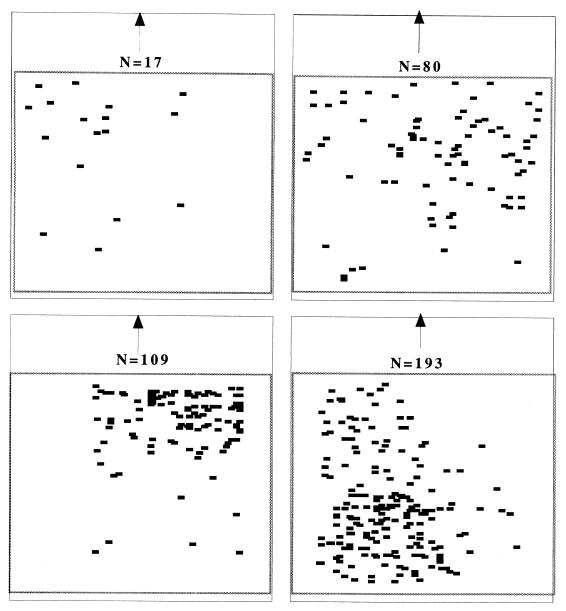
Four examples of sting distribution on one target for four different numbers of stings (N). The arrows indicate the tops of the setups.
To stimulate an attack on the targets, the hive was struck in a uniform manner three times at intervals of 40 s. After 2 min, the targets were removed, and the number of stings on each target was counted. (The barbed stingers of the honeybee remain in the leather target and provide a visual record of the attack.) To reduce disturbance to the hives, an interval of 2 days was left between successive experiments carried out on the same colony. We observed no trend over time either in the number of guard bees at the hive entrance or in the total number of stings on the target when we used this schedule. This result suggests that the time between each experiment was sufficient to prevent exhausting the defenses of the colonies or perhaps stimulating an increase in numbers of workers guarding the nest entrance.
Results
Fig. 1 shows the percentage of stings on the more highly attacked target as a function of the total number of stings (N) in each experiment. This relationship varies significantly as a function of N, and shows a classic “pitchfork bifurcation.” Under conditions of a limited attack (less than 16 stings; zone A in Fig. 1), the percentage of stings on the more highly attacked target is close to 50%, indicating a symmetrical (unfocused) attack. As the total number of stings increases, the distribution abruptly becomes asymmetrical with a mean value of 80% (zone B in Fig. 1). The null hypothesis that the stings on the lures fit a random binomial distribution was rejected (χ2 = 210.4; df = 44; P < 0.005). Over all the trials, there was no preference for one target (right or left), suggesting that the external conditions of the experimental setup or a systematic peculiarity of one target plays no role in the origin of the asymmetry (t = 0.209; df = 88).
A pitchfork bifurcation as a function of a control parameter (in this case the total number of stings, N) usually indicates the presence of competitive positive feedback, which amplifies an initial fluctuation (14, 15). The appearance of this forking phenomenon may be explained by the following. First, when a bee stings a target, it leaves its stinger in place. The stinger emits an alarm pheromone (primarily isopentyl acetate) and then becomes attractive to other nearby bees that have not yet stung a target (16, 17). Initially, the probability of stinging one or the other target (Pi) is identical and small. As the number of stings (N) continues to grow, an initial random fluctuation occurs in the number of stings on the right or left target. This fluctuation induces a slight difference in the attractiveness of the more attacked target, and this difference is amplified as the number of stings increases. It is this amplification that generates the bifurcation and asymmetrical distribution of stings that are observed on the targets.
But why is there a return toward symmetry when the number of stings increases (zone C in Fig. 1)? Indeed, when N > 200, there is no significance difference when compared with a binomial distribution. In addition to the positive feedback component of the system, there must also exist a negative feedback that brings the system back toward a homogeneous situation. The mechanisms constituting this negative feedback have not been unequivocally established but are likely to be a combination of the following. (i) Physical crowding at the targets allows only a limited number of individual bees to occupy the target site. (ii) As the number of stings on a target increases, it is likely that there is a saturation effect: the amount of pheromone in the vicinity gives rise to a repulsive effect or to a physiological adaptation of the bees to isopentyl acetate (18). (iii) As the number of stings becomes very large, the quantity of alarm pheromone and its propagation around the two targets becomes so considerable that the bees cannot distinguish the targets as two distinct objects.
To test this idea, another series of 37 experiments was carried out during the summer of 1998. In these experiments, the lures were separated by 1.5 m. The distribution of the stings was very close to that shown in Fig. 1. However, for high values of N (195–658), the mean value of Lmax/N is equal to 0.62, and we can reject the hypothesis that there is a random distribution for these values (χ2 = 53.9; df = 5; P < 0,001).
The single large target used in the third set of experiments shows the influence of heterogeneities. During an attack, the bees have a tendency to land at the edges and especially the corners of the target (19). Although this tendency induces a heterogeneity in the distribution of attacks on the target (corner versus center), it does not account for why the heterogeneous attacks occur on a particular corner or other portion of the target. The corners and the edges of the target are areas where there is an increased probability of receiving a sting. Initially, the stings are made more or less randomly with, of course, a higher probability to be on the edges and the corners. Then, when a sting has been delivered, the area immediately around it acquires an increased probability to be attacked subsequently. Then, the distribution of stings becomes aggregative, concentrated on one of the edges or a corner of the target. The distribution of stings on the target is random and homogeneous for small values of N, but a heterogeneous pattern develops when N is large (Fig. 2). Therefore, we find heterogeneities that appear on another level of observation: in the distribution of impacts within a single target.
The Model.
A model (which we implement as a Monte Carlo simulation) can be developed to account for the experimental observations. At each time step, a bee has a probability (Pi) to sting one of the targets. If B is the number of bees still alive and able to sting, then the number of stings per second that occur on each target is B⋅Pi. Because each time a bee stings, she loses her stinger, the total number of bees able to sting decreases each second by the quantity B(P1 + P2). The probability (Pi) is related to the target characteristics (color, movement, etc.) and the total number of previous stings (Ni) on the target (constants a, a′, and b). A reasonable expression for Pi is suggested by Beckers et al. (20) in their treatment of chemical recruitment in ants:
 |
1 |
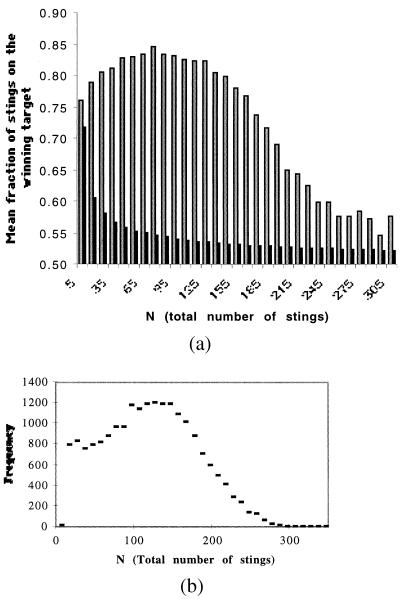
where γ is the probability to be within sensory range of the target i. The bees randomly select one target, such that γi < 0.5. Eq. 1 for Pi is a response threshold function and takes into account the increase of the probability to sting when N increases (9–11, 21). Eq. 1 can be modified further to take into account the potential saturation of the target previously discussed. A biologically reasonable approach is to substitute Fi = Ni/[1 + (Ni/δ)] for Ni (22), where δ can be considered either a measure of the crowding or saturation at the target and F1 is a function that expresses the saturation effect. As required, when δ is very large, Fi = Ni. For Ni = 0, Pi is γi(a/a′), and for large Ni, Pi = γib. It is rather easy to show that, with such a model, the bees quickly focus their attack on one target, except when the total number of stings is small (in the case of weak amplification) or very large (in which case, a crowding or saturation effect occurs). Fig. 3A shows the distribution of stings produced by the Monte Carlo simulation for different numbers of stings (N). The distribution is similar to the experimental distribution shown in Fig. 1. There is a large variability in the mean number of stings that appear on the winning target, and when the total number of stings is small or large, the distribution of stings is more symmetrical.
Figure 3.
(A) The relationship between the mean number of stings on the most attacked lure (Lmax) and the total number on the two lures and this relationship in a function of the total number (N) produced by the model (open bars). a = 1; b = 0.5; a′ = 8,000; γ = 0.5; δ = 15; the number of bees involved B = 500. N1 = N2 = 0. The second curve corresponds to the same ratio (Lmax/N) but for a random and constant probability to sting (black bars). (B) The distribution of the total number of stings for the corresponding simulation.
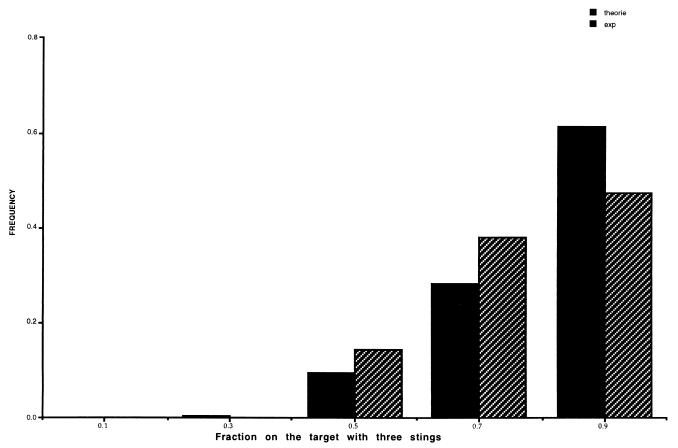
Fig. 4 summarizes the distribution of stings on the targets for the series of 20 experiments carried out with three stings on one target at the beginning of the experiment. In each experiment, the target with the three stings receives the higher number of stings, and we can reject the hypothesis of a random distribution (t = 4.69; df = 40; P < 0.001). It is rather easy to simulate this experiment with Eq. 1. In this case, the simulation begins with N1 = 3 and N2 = 0 stings. The experimental and theoretical distribution are in good agreement (χ2 = 2.82; df = 4; P < 0.05).
Figure 4.
The distribution of the percentage of the total number of stings on the target that began with three stings for the same parameters values: see Fig. 3A. Initial conditions were N1 = 3; N2 = 0.
Returning to the biology of honeybee defenses, these results indicate how a colony initially confronted with an intruder is able to concentrate its forces and focus its defensive attack.¶ Later, if the intruder is not repelled and the number of stings increases, the attacks may become more diffusive. Under natural conditions, differences in the color, texture, and odors of different portions of an intruder will have different attractive effects and modulate the defensive response of the colony. The model and the experimental results presented here show how these differences in attractiveness can be amplified strongly to generate an adaptive colony response.
The experiments show a high variability in the total number of stings to the target (range: 0 ≤ N < 600). This variability can be explained partially by interhive differences: the two smallest hives (which also have the smallest number of guards at the nest entrance; Table 1) made, on average, the smallest number of attacks per experiment. The ratio (N per colony population) increases with colony population of the hive. In general, large hives are known to be more aggressive (23, 24). In addition, over all the experiments, the correlation coefficient between the number of guards and N is equal to 0.644 (P < 0.001; df = 44).
Table 1.
Indices enabling the measurement of defensive investment by the hives
| Hive | Gm | Gsd | NPm | NPsd | SC |
|---|---|---|---|---|---|
| 1 | 1a | 0.96 | 10e | 6.1 | 20,000 |
| 2 | 9b | 3.51 | 17e | 24.3 | 30,000 |
| 3 | 8b | 2.61 | 138f | 150.5 | 40,000 |
| 4 | 12c | 3.45 | 124f | 93.2 | 40,000 |
| 5 | 23d | 3.91 | 164f | 250.4 | 40,000 |
Gm, mean number of guards at the entrance of nest; Gsd, standard deviations of this mean; NPm, mean number of total stings for each experiment; NPsd, standard deviation of this mean; SC, size of the colony. Means for the same characteristics followed by different letters are significantly different (P < 0.05, Newman-Keuls test).
However, an important source of variability in the intensity of an attack remains to be explained. In those hives with approximately the same population and within replicates for a given nest, we find great differences in the magnitude of the defensive response (Table 1, columns NPm and NPsd). However, the variation in mean number of guards at the entrance of the nest is relatively small (Table 1, column Gsd), and as previously mentioned, no temporal trend was observed in number of guards or the total number of stings in replicates with the same hive. Strong intrahive variability is an integral feature of the honeybee defensive system. The model shows that these large differences in the intensity of an attack occur without altering any of the colony parameters: Fig. 3B is a frequency distribution of the total number of stings (for the parameter values in the simulation used for Fig. 3A). We see that the total number of stings varies between 0 and 300 for an initial population of 500 soldiers. The honeybee defensive system is able to amplify seemingly trivial variations in the initial conditions with which it is presented and use this variability to strongly modulate the intensity of the colony’s attack. This effect may be an adaptive feature of colony defense.
Conclusions
These theoretical and experimental studies of honeybee defense provide an understanding of the link between individual behaviors and the collective response. The results of this study are consistent with the idea that the defense mechanisms of the colony are under the control of genetic determinants that affect an individual’s response threshold (21). What we have shown, in addition, is that these collective responses are not the simply the summation of multiple genetically coded individual responses. Rather, properties of the response appear on a collective level that cannot be appreciated by the study of the individual characteristics alone; the colony’s collective response is an emergent property of the dynamics and nonlinear interactions at the individual level. One potential consequence of this property is that evolution may be able to mold the collective response of the colony by selecting among rather minor differences in individual phenotypes for such characteristics as quantity of pheromone emitted or the threshold of a behavioral response. Through the use self-organized mechanisms, the colony may achieve diversity and adaptive plasticity in its responses in an economical manner, without the need for explicit genetic coding of each aspect of the collective aggressive response (such as the total number of stings in an attack, the distance the bees go in pursuit of an intruder, or the response time to attack).
A second consequence of such a self-organized process is that some of the collective responses, which at first glance may seem to be independent (such as the intensity of the attack and the ability to focus on one target), may actually be strongly associated.
Acknowledgments
We thank Jean-Francois Odoux, the beekeeper of Laboratoire de Neurobiologie Comparée des Invertébrés (Institut National de la Recherche Agronomique), for his valuable help and Robert Jeanne for his helpful comments. This work was supported by a grant from the Fond pour le Recherche dans l’Industrie et l’Agriculture (Belgium).
Footnotes
Schmidt, J. O., International Congress of Entomology, Aug. 25–31, 1996, Florence, Italy, Proceeding abstr.
References
- 1.Collins A, Rinderer T E, Tucker K W, Pesante D G. J Apic Res. 1987;26:217–223. [Google Scholar]
- 2.Ruttner F. African Races of Honeybees. Grenoble, France: Proc. XXV Int. Congr. Afr.; 1975. pp. 325–344. [Google Scholar]
- 3.Paxton R J, Sakamoto C H, Rugiga F C N. J Apic Res. 1994;33:75–82. [Google Scholar]
- 4.Moritz R F A, Southwich E E, Harbo J B. Apidologie. 1987;18:389–392. [Google Scholar]
- 5.Collins A. J Apic Res. 1981;20:13–18. [Google Scholar]
- 6.Collins A, Rinderer T E. J Chem Ecol. 1985;11:333–338. doi: 10.1007/BF01411419. [DOI] [PubMed] [Google Scholar]
- 7.Deneubourg J L, Goss S. Ethol Ecol Evol. 1989;1:295–311. [Google Scholar]
- 8.Bonabeau E, Theraulaz G, Deneubourg J L, Aron S, Camazine S. Trends Ecol Evol. 1997;12:188–193. doi: 10.1016/s0169-5347(97)01048-3. [DOI] [PubMed] [Google Scholar]
- 9.Huang Z Y, Robinson G E. In: Information Processing in Social Insects. Detrain C, Deneubourg J L, Pasteels J M, editors. Basel: Birkhaüser; 1999. pp. 165–186. [Google Scholar]
- 10.Beshers S N, Robinson G E. In: Information Processing in Social Insects. Detrain C, Deneubourg J L, Pasteels J M, editors. Basel: Birkhaüser; 1999. pp. 115–139. [Google Scholar]
- 11.Bonabeau E, Theraulaz G. In: Information Processing in Social Insects. Detrain C, Deneubourg J L, Pasteels J M, editors. Basel: Birkhaüser; 1999. pp. 141–163. [Google Scholar]
- 12.Krafft B, Pasquet A. Insectes Soc. 1991;38:83–90. [Google Scholar]
- 13.Lecomte J. Behavior. 1951;4:60–66. [Google Scholar]
- 14.Kauffman S A. The Origins of Order: Self-Organization and Selection in Evolution. Oxford: Oxford Univ. Press; 1993. [Google Scholar]
- 15.Nicolis G, Prigogine I. Exploring Complexity. New York: Freeman; 1989. [Google Scholar]
- 16.Maschwith U W. Nature (London) 1964;204:324–327. [Google Scholar]
- 17.Cassier P, Tel-Zur D, Lensky Y. J Insect Physiol. 1993;40:23–32. [Google Scholar]
- 18.Free J B. J Apic Res. 1988;27:227–229. [Google Scholar]
- 19.Lehrer M, Srinivasan M V, Zhang S W, Horridge G A. Nature (London) 1988;332:336–337. [Google Scholar]
- 20.Beckers R, Deneubourg J L, Goss S. J Theor Biol. 1992;159:397–415. [Google Scholar]
- 21.Robinson G E, Page R E. Nature (London) 1988;333:356–358. [Google Scholar]
- 22.Aron S, Deneubourg J L, Goss S, Pasteels J M. In: Biological Motion, Lecture Notes in Biomathematics. Alt W, Hoffman G, editors. Berlin: Springer; 1990. pp. 533–547. [Google Scholar]
- 23.Winston M. The Biology of the Honey Bee. Cambridge, MA: Harvard Univ. Press; 1987. [Google Scholar]
- 24.Collins A, Rinderer T E. J Chem Ecol. 1985;11:333–338. doi: 10.1007/BF01411419. [DOI] [PubMed] [Google Scholar]


