

Abstract
The process by which oligodendrocyte progenitors differentiate into mature oligodendrocytes is complex and incompletely understood in part because of the paucity of oligodendrocyte precursors cell lines that can be studied in culture. We have developed a non-immortalized rat oligodendrocyte precursor line, called OL-1, which behaves in a fashion consistent with developing oligodendrocytes in vivo. This OL-1 line provides a model for the study of oligodendrocyte development and offers an alternative to the CG-4 cell line. When OL-1 cells are propagated in conditioned growth media, they have morphology consistent with immature oligodendrocytes and exhibit A2B5 antigen positive and myelin basic protein-negative immunoreactivity. Withdrawal of conditioned growth media and culture in serum-free medium results in OL-1 cell maturation, manifested by a shift to myelin basic protein-positive immunoreactivity, A2B5 antigen-negative immunoreactivity, decreased NG2 mRNA expression, increased expression of proteolipid protein mRNA, and increased expression of CNP protein. In addition, the expression of proteolipid protein and its splicing variant DM-20 exhibit a pattern that is similar to brain proteolipid protein expression during development. When OL-1 cells are exposed to Insulin-like growth factor-I, there are significant increases in proteolipid protein mRNA expression ( p < 0.05), the number of cell processes ( p < 0.05), and cell number ( p < 0.05). Treatment with the caspase inhibitors Z-DEVD-FMK and Z-VAD-FMK (inhibitors of caspases 3, 6, 7, 8, 10 and 1, 3, 4, respectively), Insulin-like growth factor-I, or both, results in a similar increase in cell number. Because Insulin-like growth factor-I does not substantially increase the BrdU labeling of OL-1 cells, these data collectively indicate that Insulin-like growth factor-I increases OL-1 cell number predominately by promoting survival, rather than stimulating proliferation. This non-immortalized oligodendrocyte precursor cell line, therefore, exhibits behavior consistent with the in vivo development of oligodendrocytes and provides an excellent model for the study of developing oligodendrocytes.
Keywords: Oligodendrocyte culture, Oligodendrocyte development, Myelin, Insulin-like growth factor-I, IGF-I, Apoptosis, Cell survival
1. Introduction
The sequential events occurring during oligodendrocyte lineage development, while well described both morphologically and by the expression of specific molecular markers, are complex and incompletely understood. Oligodendrocyte precursor cells are characterized by the expression of NG2 proteoglycan (NG2) (Nishiyama et al., 1996), A2B5 antigen (A2B5) (Raff et al., 1983; Rao et al., 1998; Lee et al., 2000), and the platelet-derived growth factor receptor alpha (PDGFRα) (McKinnon et al., 1990). After exiting the cell cycle, oligodendrocyte precursor cells develop into pro-oligodendrocytes that are characterized by an increase in myelinating processes. This is accompanied by decreased expression of NG2, A2B5, and PDGFRα (Hall et al., 1996) and the onset of O4 antigen expression (O4). As pro-oligodendrocytes differentiate into mature oligodendrocytes, O4 expression decreases and galactocerebroside (GalC), 2′,3′-cyclic nucleotide-3′-phosphodiesterase, proteolipid protein (PLP), and myelin basic protein (MBP) expression increases.
The coordinated expression of several key genes, such as sonic hedgehog, PAX-6, nkx-2.2, olig-1, olig-2, and sox-10, in CNS likely specifies the development of the oligodendrocyte lineage. In addition, a number of growth factors appear important. There is evidence that platelet-derived growth factor (PDGF), fibroblast growth factor-2, (FGF-2), and insulin-like growth factor-I (IGF-I) influence oligodendrocyte lineage cell proliferation and survival. Both PDGF and FGF-2 are mitogenic to A2B5 + OPCs (Noble et al., 1988; Raff et al., 1988; Richardson et al., 1988; Gard and Pfeiffer, 1993; Calver et al., 1998; Fruttiger et al., 1999), and FGF-2 has been shown to prevent maturation of cultured GalC + pro-oligodendrocytes into mature oligodendrocytes (Gard and Pfeiffer, 1993). Furthermore, when cultured in the combination of PDGF and FGF-2, OPCs grow indefinitely in culture without further differentiation as judged by a lack of O4 expression (Bogler et al., 1990). IGF-I appears to enhance OPC survival (Barres et al., 1993), but also appears to promote differentiative events (McMorris and Dubois-Dalcq, 1988). In primary glial cell culture, IGF-I stimulates an increase in oligodendrocyte number by inhibiting OPC apoptosis (Ye and D’Ercole, 1999), actions that appear to be mediated through the phosphatidylinositol 3-kinase pathway (Vemuri and McMorris, 1996). In such cultures, IGF-I also stimulates oligodendrocyte development and myelination (McMorris et al., 1986; McMorris and Dubois-Dalcq, 1988; Mozell and McMorris, 1991; Ye and D’Ercole, 1999).
A better understanding of oligodendrocyte development and myelination is central to developing modalities to treat demyelinating disorders. While in vivo systems provide a more physiologic model, the existence of multiple neural cell types hinders the characterization of signaling specifically in oligodendrocyte lineage cells. Pure cultures of oligodendrocytes and their precursors address this problem. A number of cell culture models of oligodendrocyte development have been described, including immortalized cell lines (Jung et al., 1995; Richter-Landsberg and Heinrich, 1996; Verity et al., 1993; Matsushita et al., 2005), primary cell culture (McCarthy and de Vellis, 1980), and an OPC cell line (Louis et al., 1992). Immortalized cell lines are less attractive because their behavior has been fundamentally altered by immortalization. While study of primary cell cultures is appealing, the labor and expense of preparing them in sufficient quantity for multiple experiments makes them less than optimal. The study of non-immortalized cells offers an alternative method. We report here a non-immortalized rat oligodendrocyte precursor line, called OL-1. Like the CG-4 cell line, OL-1 cells behave similar to primary cultured oligodendrocytes. They can be propagated in culture to generate large numbers of OPCs that can be induced to differentiate into mature oligodendrocytes. Using OL-1 cells, we show that IGF-I promotes OPC maturation and increased OPC number, as judged by increases in myelin gene expression, the number of cell processes, and cell survival. The OL-1 cell line, therefore, provides an alternative non-immortalized cell culture model for the study of oligodendrocyte development.
2. Experimental procedures
2.1. Generation of the OL-1 oligodendrocyte precursor cell line
2.1.1. Isolation of oligodendrocyte progenitors
Oligodendrocyte precursors were prepared and isolated from P2 rat brains according to a modified method derived from McCarthy and de Vellis (1980). P2 rats were sacrificed and brains placed in tissue culture dishes on ice containing cold Dulbecco’s Modified Essential Media (DMEM), 20 mM Hepes, and 50 μg/mL gentamycin. Meninges, cerebellum, and olfactory bulbs were discarded. Remaining tissue was pooled, rinsed with buffer [Hanks Balanced Salt Solution with phenol red and Ca2+/Mg2+ (Invitrogen, Carlsbad, CA) containing 5.5 mM Cysteine (Sigma–Aldrich, St. Louis, MO), 2 mM EDTA, 20 mM Hepes], and transferred to a conical tube. Remaining liquid was aspirated and papain solution with DNAse [10–20 U papain (Sigma–Aldrich, St. Louis, MO) with 0.25 mg DNAse (Worthington Biochemical, Lakewood, NJ) per mL buffer] was added and incubated for 1 h with intermittent trituration. After brains were dissociated, cool DMEM with 0.1% BSA and 50 μg/mL gentamycin was added and cells divided into two 50 mL conical tubes. Cells were filtered through 250, 150, and then 75 mesh conical filters followed each time by a wash with DMEM/BSA/Gentamycin. Tubes were brought up to 50 mL with DMEM/BSA/Gentamycin and centrifuged at 1000 rpm for 7 min.
Poly-D-lysine (PDL) (Sigma–Aldrich, St. Louis, MO)-coated flat bottom T75 flasks without a canted neck (BD Biosciences, San Jose, CA) were prepared by adding a 2–10 μg/mL PDL solution in sterile water for 1–2 h, followed by aspiration, and air drying. Washed cells were plated at a ratio of one brain per flask in 10% fetal calf serum in DMEM containing high glucose, 20–25 mM Hepes, pyruvate, 2 mM glutamine, and 10 ug/mL gentamycin), termed here Complete Medium (CM) and cultured at 37 °C.
Once adequate monolayers formed, flasks were capped tightly and placed on a rotary shaker-incubator at 180 rpm and 37 °C for 2–3 h. Media containing microglia was removed, replaced with fresh CM and equilibrated for 2 h at 37 °C. The flasks were placed back on the rotary shaker-incubator at 220–250 rpm and 37 °C. After shaking overnight, the medium containing oligodendrocyte progenitors was removed, and cells pelleted at 1000 rpm for 7 min. The pellet was resuspended in 30 mL of CM, split into 3 × 10 cm Petri dishes (Fisher Scientific, Pittsburgh, PA), and allowed to settle for 2 h at 37 °C. After settling, the plates were gently agitated to bring the oligodendrocyte progenitors into suspension, while the microglia remained attached. The media containing progenitors was removed, pooled, and spun down at 1000 rpm for 7 min at 4 °C.
This pellet was re-suspended in 10 mL of a solution termed Conditioned Growth Media (CGM; described below) and 450,000–500,000 cells were plated in each PDL-coated 10 cm tissue culture dish and cultured at 37 °C. CGM is composed of 30% B104-conditioned media and 70% serum free-defined media (SFM) [25 μg/mL transferrin (Sigma–Aldrich, St. Louis, MO), 30 nM triiodothyronine (Calbiochem, San Diego, CA), 20 nM hydrocortisone (Sigma–Aldrich, St. Louis, MO), 20 nM progesterone (Sigma–Aldrich, St. Louis, MO), 10 nM biotin (Invitrogen, Carlsbad, CA), 1× trace elements (Cellgrow, medium B, 1000× stock), 30 nM selenium (Sigma–Aldrich, St. Louis, MO), 1 μg/mL putrescine (Sigma–Aldrich, St. Louis, MO), 0.1% BSA (Fraction V; Sigma–Aldrich, St. Louis, MO), 5 U/mL penicillin/streptomycin), 10 μg/mL insulin]. B104-conditioned media was generated by culturing sub-confluent B104 neuroblastoma cells with SFM for 2 days. After 2 days, B104-conditioned media is collected, sterile filtered, and stored frozen at −20 °C.
The cells were expanded in CGM for approximately 4 days. Media was changed every 2 days. After the cells were grown to sub-confluence, they were passaged (see next section) to a PDL-coated 24-well dish and serially diluted to an approximate density of 10,000, 5000, 2500, 1250, 625, and 312 cells per well and expanded in CGM for 4 days. Culture dilutions that had visible numbers of astrocyte-like cells were discarded (typically dishes with >625 cells per well). Those cultures without visible astrocyte-like cells (usually dishes with 625 and 312 cells per well) were pooled and further expanded for 15 passages in the presence of CGM. The resulting cell population of OL-1 cells was composed predominately of bipolar cells with a minority of multipolar cells without visible traces of astrocyte-like or mature oligodendrocyte-like cells.
2.1.2. Management of the OL-1 cell line
Undifferentiated OL-1 cells were propagated in CGM at 37 °C in a CO2 incubator. Once cells were grown to sub-confluence, they were passaged. After CGM was aspirated and cells washed with papain buffer, cells were incubated with papain (1–2 U/mL) at 37 °C. After 2 min, cool wash buffer (DMEM, 0.1% BSA, 20 mM Hepes, 5 U/mL penicillin/streptomycin) was added and cells were detached from culture dishes by trituration. After spinning at 1000 rpm at 4 °C for 7 min, the supernatant was removed. Cells were re-suspended in 30 mL of CGM, seeded into 3 PDL-coated plates, and incubated at 37 °C.
2.2. Characterization of the OL-1 oligodendrocyte precursor cell line
2.2.1. OL-1 cell morphology and glial gene expression
Undifferentiated OL-1 cells are propagated in CGM. Withdrawal of CGM and addition of SFM promotes OL-1 cell maturation and results in decreased proliferation. To characterize the morphology and glial gene expression of both undifferentiated and differentiated OL-1 cells, as well as to define the time course of OL-1 cell morphological changes during maturation, OL-1 cells were expanded in CGM for 3 passages and plated into sterile PDL-coated 12-well tissue culture plates (Falcon) at a concentration of 60,000 cells/well. Twelve-well plates were then cultured for 24 h in CGM at 37 °C in a CO2 incubator to allow cells to attach and stabilize. CGM was then removed and replaced with either: (1) fresh CGM or (2) SFM (10 μg/mL insulin). Plates were cultured for 48 h and collected at the following times: (1) CGM at time 0 h; (2) CGM and SFM at 24 h; (3) CGM and SFM at 48 h. At the time of collection, quadruplicate OL-1 cell cultures were photographed, promptly passaged, re-suspended in phosphate buffered saline (PBS), counted with a hemocytometer, quickly frozen in liquid nitrogen, and stored at −80 °C until analysis. Both CGM and SFM contain levels of insulin (10 μg/mL) that would be expected to maximally activate both the insulin and IGF1-R, thus providing tonic insulin and IGF-I effects. Because, insulin at a concentration of 10 μg/mL also stimulates the type I IGF receptor (IGF1-R), the cell surface receptor that mediates IGF-I signaling, we used SFM that contained insulin at a physiological concentration (5 ng/mL) in all experiments examining IGF-I actions. At this concentration, insulin does not interact significantly with the IGF1-R. SFM containing 5 ng/mL insulin is termed low insulin SFM hereafter.
To characterize the effects of IGF-I on OL-1 cell maturation and glial gene expression, OL-1 cells were expanded in CGM for three passages and plated into PDL-coated 12-well tissue culture plates at a concentration of 60,000 cells/well in CGM and cultured for 24 h at 37 °C. CGM was then removed and replaced with either: (1) low insulin SFM (5 ng/mL insulin) or (2) low insulin SFM with 100 ng/mL IGF-I. Plates were cultured for 48 h and collected at the following times: (1) CGM at time 0 h; (2) low insulin SFM and low insulin SFM with 100 ng/mL IGF-I at 24 h; low insulin SFM and low insulin SFM with 100 ng/mL IGF-I at 48 h. At the time of collection, quadruplicate OL-1 cell cultures were photographed, promptly passaged, re-suspended in phosphate buffered saline (PBS), counted with a hemocytometer, quickly frozen in liquid nitrogen, and stored at −80 °C until further analysis.
To quantify the effect of IGF-I on OL-1 cell maturation morphologically, the number of OL-1 cell processes per cell was evaluated. OL-1 cells were expanded in CGM and plated into PDL-coated 12-well tissue culture plates at a concentration of 60,000 cells/well. Plates were then cultured for 24 h in CGM at 37 °C to allow cells to attach and stabilize. CGM was then removed from all wells and replaced with either low insulin SFM or low insulin SFM with 100 ng/mL IGF-I. Plates were cultured for 48 h and the number of OL-1 cell processes determined at 24 and 48 h. OL-1 cell process number was determined by randomly visualizing cells from each treatment group and counting the number of cell processes that extended from each OL-1 cell body. A total of 10 cells per treatment group were evaluated and mean number of processes per cell determined. Comparisons between the IGF-I treated and SFM treated group were made using a Student’s t-test.
2.2.2. RNA extraction, reverse transcription, and quantitative real-time PCR
Total RNA was extracted from collected samples using Trizol reagent (Invitrogen, Carlsbad, CA) per the manufacturer’s protocol and stored at −80 °C until further analysis. cDNA was generated utilizing a 20 μL reverse transcription (RT) reaction with the following final concentrations of reagents in the RT reaction mixture: 10 U/μL Superscript II RNAse H Reverse Transcriptase (Invitrogen, Carlsbad, CA), 2 U/μL RNAsin (Promega, Madison, WI), 1 mM dNTP-Mix (Qiagen, Valencia, CA), 5 μM random decamers (UNC nucleic acid core facility), 5 mM DTT (Invitrogen, Carlsbad, CA), and 1× first strand buffer (Invitrogen, Carlsbad, CA). The RNA load for each RT reaction was normalized for cell number. Reactions were carried out at 37 °C for 60 min followed by 3 min at 95 °C on a GeneAmp PCR System 2400 (Perkin Elmer, Boston, MA). RT reaction products were stored at −20 °C until further analysis.
The relative expression of OL-1 cell markers was quantified using quantitative real-time PCR (qRT-PCR). Gene transcripts were quantified using the LightCycler qRT-PCR system (Roche Applied Science, Indianapolis, IN) and analyzed using LightCycler software version 3.5 (Roche Applied Science, Indianapolis, IN). Primer sequences (Table 1) were designed so that qRT-PCR products crossed exon–exon splice junctions so as to eliminate the possibility of amplifying genomic DNA. PLP primers were designed to amplify both PLP and DM-20 cDNA transcript isoforms. When amplifying PLP cDNA a 616bp qRT-PCR product is generated, and when amplifying DM-20, a 511bp qRT-PCR product is generated. qRT-PCR analysis using these primers, therefore, yields the sum of both PLP and DM-20 expression. Twenty microliter qRT-PCR reactions were carried out with the following final concentrations of reagents: 3 μL cDNA, 1× QuantiTect SYBR Green Master Mix (Qiagen, Valencia, CA), 1 μM primer A, 1 μM primer B). After an initial denaturation step (95 °C for 20 min), amplification was performed over 40–45 cycles of denaturation (94 °C for 30 s), annealing (55 °C for 60 s), elongation (72 °C for 60 s), and fluorometric detection (78 °C for 5 s). To minimize variability, reagents were prepared as master mixes, aliquoted into individual tubes, and cDNA added to each reaction. Gene transcripts of 18S ribosomal RNA were quantified and used to normalize the load of cDNA in each sample. Reaction specificity was monitored by performing a melting curve analysis at the end of each reaction. Because, the melting curve of a PCR product is dependent upon its GC content, sequence, and length, specific amplification products can be distinguished from non-specific ones by examination of the melting curve (Dhar et al., 2002; Ririe et al., 1997). In addition, all samples were analyzed by electrophoresis utilizing a 1.5% agarose gel to confirm that the actual sizes of qRT-PCR products were the same as their predicted sizes. To further confirm specificity, qRT-PCR products were extracted from agarose gels using a QIAquick gel extraction kit (Qiagen, Valencia, CA) and sequenced by the University of North Carolina Automated DNA Sequencing Facility. Sequencing reactions were performed using the chain terminator method utilizing the ABI PRISM BigDye Terminator Cycle Sequencing Ready Reaction Kit with AmpliTaq DNA Polymerase, FS (Applied Biosystems, Foster City, CA). DNA sequences were compared by BLAST analysis to the online rat GenBank mRNA sequences (http://www.ncbi.nlm.nih.gov/) for each marker of interest. The CT for each marker was normalized to 18S by subtracting the CT 18S from CT marker. The effect of treatment (ΔCT) was calculated by subtracting the 18S-normalized CT at the beginning of the experiment (time 0) from the 18S-normalized ΔCT at the end of the experiment (48 h). The expression of PLP relative to DM-20 was carried out in a semi-quantitative fashion by the electrophoresis of PLP/DM-20 qRT-PCR products on a 1.5% agarose gel and visualization with ethidium bromide staining.
Table 1.
Primer sequences for OL-1 cell markers
| Marker | Nucleotide sequence (5′ → 3′) | Orientation | Size (bp) |
|---|---|---|---|
| 18S | Classic 18S PCR primer pair (Ambion) | Forward/reverse | 488 |
| NG2 | GACCCTCGTCACCTGCTCTACC
GCGCTGAGATGCTGGCACACTGGCTAGG |
Forward
Reverse |
387 |
| GFAP | CTAGCCCTGGACATCGAGAT
CTGAGAGAGCTCAGCGGTTA |
Forward
Reverse |
503 |
| PLP/DM20 | GAAAAGCTAATTGAGACCTA
GAGCAGGGAAACTAGTGTGG |
Forward
Reverse |
616/511 |
2.2.3. Western blot analysis
OL-1 cells were collected at 0 and 48 h after withdrawal of CGM and culture in SFM, washed with PBS, and lysed with a protein extract buffer (20 mM Tris–HCl, pH 7.5, 1% NP-40, 137 mM NaCl, 1 mM CaCl2, 1 mM EDTA, and freshly added 0.5 mM PMSF and 2.5 mg/mL of each aprotinin, leupeptin and antipain). Total protein was collected by centrifugation at 12,000 rpm for 5 min at 4 °C. Protein concentration was determined using a BCA protein kit (Pierce, Rockford, IL) and bovine serum albumin as a standard. Aliquots of total protein (10–30 μg) were separated on 12.5% polyacrylamide gels and transferred onto PVDF nylon membranes (Amersham, Arlington Heights, IL). Membranes were incubated with specific antibody. Antibody concentration used is as follows: 2′,3′-Cyclic nucleotide 3′-phosphodiesterase (CNP) (1:300, Chemicon International, Temecula, CA), Neurofilament (NF) (1:500, Chemicon), glial fibrillary acidic protein GFAP (1:2000, Chemicon), β-actin (1:500, Sigma), Specific immunoreactivity was visualized using an ECL kit (Amersham), according to the manufactures protocol.
2.2.4. Immunohistochemistry
To further characterize the nature of both undifferentiated and differentiated OL-1 cells, immunohistochemical staining for the immature and mature oligodendrocyte-specific cell surface markers, A2B5 and myelin basic MBP, respectively, was carried out. OL-1 cells were expanded in CGM for three passages and plated into sterile PDL-coated Lab-Tek chamber slides (Nalge Nunc, Rochester, NY) at a concentration of 20,000 cells/well. The chamber slides were then cultured for 24 h in CGM at 37 °C in a CO2 incubator to allow cells to attach and stabilize. After the stabilization period, one-third of the chamber slides were collected for analysis. The remaining slides were cultured at 37 °C in SFM to promote maturation and then collected at 24 and 48 h for analysis. OL-1 cells were fixed with 4% paraformaldehyde for 10 min at 25 °C followed by washing 3× with PBS. Cells were then treated with 3% H2O2 for 3 min at 25 °C and washed with PBS 3× to quench endogenous peroxidase activity. Primary antibody was prepared at a concentration of 1:25 (mouse anti-A2B5 IgM; Chemicon, Temecula, CA) or 1:200 (rabbit anti-MBP IgG; Chemicon, Temecula, CA) in PBS/0.1% Triton X-100 (TX-100) and applied for 2 h at 25 °C. Cells were washed 3× with PBS and then secondary antibody (rhodamine-conjugated goat anti-mouse IgM or fluorescein-conjugated goat anti-rabbit IgG; Jackson, ImmunoResearch Laboratories, West Grove, PA) was prepared at a concentration of 1:200 in PBS/0.1% TX-100 and applied for 1 h at 25 °C followed by washing with PBS 3×. Images were visualized with an Olympus BX-60 fluorescent microscope and images acquired using the Spot Jr. Digital Acquisition System (Diagnostic Instruments, Sterling Heights, MI).
2.2.5. Cell number
To determine the effect of IGF-I on OL-1 cell number, OL-1 cells were propagated in CGM and passaged to sterile PDL-coated 12-well tissue culture plates. Cells were cultured for 3 h in CGM at 37 °C in a CO2 incubator to allow cells to attach and stabilize. CGM was removed and OL-1 cells were cultured for 24 h at 37 °C in low insulin SFM or low insulin SFM with 100 ng/mL IGF-I. Cell number was determined at 3, 6, 12, 18, and 24 h by MTT (3-(4,5-dimethylthiazol-2-yl)-2,5-diphyneltetrazolium bromide) assay (Denizot and Lang, 1986) according to the manufacturers protocol (Sigma). Briefly, 0.5 mg/mL MTT was added to OL-1 cell cultures for 3 h prior to the end of each culture period followed by withdrawal of culture media and addition of 0.1N HCl in anhydrous isopropanol (MTT solvent). Optical absorbance was measured at 570 and 630 nm using a Beckman spectrophotometer (model DU-65). The difference between OD 570 and OD 630 (Δ570–630) was determined. The Δ570–630 values closely correlated with cell number.
2.2.6. Caspase inhibitor studies
To determine if the IGF-I-induced increase in OL-1 cell number is mediated through inhibition of apoptosis, OL-1 cells were propagated in CGM and passed to sterile PDL-coated 12-well tissue culture plates. Cells were then cultured for 3 h in CGM at 37 °C in a CO2 incubator to allow cells to attach and stabilize. CGM was removed and OL-1 cells were cultured for 24 h in low insulin SFM, low insulin SFM with caspase inhibitors Z-VAD-FMK or Z-DEVD-FMK (inhibitors of caspases 3, 6, 7, 8, 10 and 1, 3, 4, respectively), low insulin SFM with 100 ng/mL IGF-I, or low insulin SFM with both 100 ng/mL IGF-I and caspase inhibitor (Z-VAD-FMK or Z-DEVD-FMK). Cell number was determined at 24 h by MTT assay.
2.2.7. Proliferation studies
To determine if the IGF-I-induced increase in OL-1 cell number is mediated through increased proliferation, OL-1 cells were propagated in CGM and passaged to sterile PDL-coated 12-well tissue culture plates. Cells were then cultured for 3 h in CGM at 37 °C in a CO2 incubator to allow cells to attach and stabilize. CGM was removed and OL-1 cells were cultured for 3, 6, 12, 18 and 24 h at 37 °C in CGM, low insulin SFM, or low insulin SFM with 100 ng/mL IGF-I. Cell proliferation was determined by BrdU labeling. Briefly, 5 μg/mL BrdU was added to OL-1 cell cultures for 3 h prior to the end of each culture period. This was followed by fixation in 4% paraformaldehyde, treatment with 3% H2O2 and 2N HCl, and blocking with 5% milk protein in PBS 0.1% TX-100. BrdU labeled cells were identified with monoclonal antibody against BrdU (1:200; Boehringer Mannheim, Indianapolis, IN). Antibody-antigen complexes were detected using the EnVision + Peroxidase system (Dako North America, Carpinteria, CA). Labeled cells were visualized under a microscope and 200 cells counted to determine the BrdU labeling index expressed as a percentage of total cells.
2.2.8. Statistical analyses
Comparisons between treatment groups were made using a Student’s t-test. Statistical analyses were performed using STATA statistical analysis software (StatCorp, College Station, TX).
3. Results
3.1. OL-1 cells exhibit morphologic and immunologic changes consistent with developing oligodendrocytes
OL-1 cells, when propagated at 37 °C in CGM, proliferate and display immature morphology consistent with that of oligodendrocyte precursors (Fig. 1, panels A and B). Cells are predominantly bipolar and tri-polar, display a small ovoid cell body, and their processes display relatively few branches. Following withdrawal of CGM, culture of OL-1 cells in SFM promotes maturation of the cells over a 48 h period (Fig. 1, panels C and D). During the maturation process, the cell bodies shifted from an ovoid to a more rounded appearance and additional processes formed with an increased number of branches. The mature cells are stellate and display multiple processes that are highly branched. When cultured in sufficient density they have a morphology, including sheet-like processes, that is consistent with that of mature oligodendrocytes generated using primary cell culture techniques (Fig. 2).
Fig. 1.

Representative photomicrographs of OL-1 cells following withdrawal of conditioned growth media. (Panel A) OL-1 oligodendrocyte precursor cells (OPCs) after propagation in conditioned growth media (CGM) display immature features, including ovoid cell body and bipolar-tripolar shapes; (Panel B) OL-1 cells grown in CGM for 24 h display increased cell density and retention of immature morphology; (Panels C and D) OL-1 cells grown in SFM for 24 and 48 h, respectively, display a progression to mature oligodendrocyte morphology, including round cell body and multi-polar appearance.
Fig. 2.

MBP immunohistochemistry demonstrating sheet-like appearance of mature OL-1 cells. OL-1 cells cultured for 48 h in SFM showing mature multipolar cells that are strongly MBP positive and exhibit a sheet-like appearance.
To further characterize the OL-1 cell expression of oligodendrocyte-specific developmental markers, OL-1 cells propagated in CGM (immature) or SFM for 24 h (mature) were immunostained for A2B5 (an oligodendrocyte precursor marker) and MBP (a mature oligodendrocyte marker). OL-1 cells cultured in CGM displayed strong A2B5 immunoreactivity with little to no immunoreactivity to MBP, whereas OL-1 cells cultured in SFM for 24 h displayed strong MBP immunoreactivity with little to no immunoreactivity to A2B5 (Fig. 3).
Fig. 3.
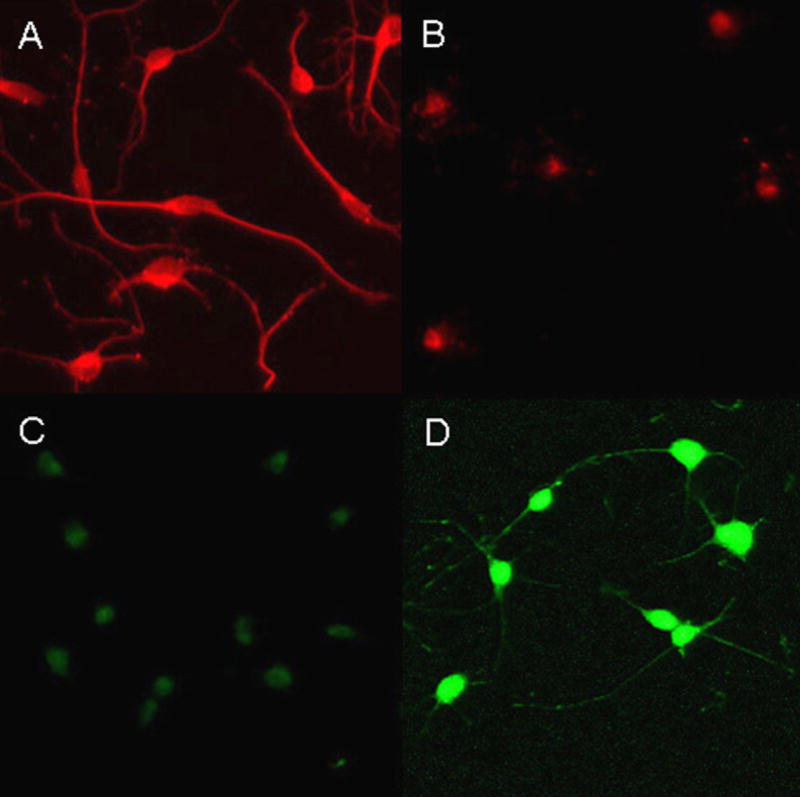
A2B5 and MBP immunoreactivity of immature and mature OL-1 cells. (Panel A) OL-1 cells cultured in CGM showing immature bipolar cells that strongly immunostain with antibody to A2B5; (Panel B) OL-1 cells cultured for 24 h in SFM did not exhibit A2B5 immunostaining; (Panel C) OL-1 cells cultured in CGM were MBP negative; (Panel D) OL-1 cells cultured for 24 h in SFM showing more mature multipolar cells that are strongly MBP positive.
3.2. Proteolipid protein (PLP/DM-20), NG2 proteoglycan (NG2) mRNA and 2′,3′-cyclic nucleotide 3′-phosphodiesterase (CNP) protein are expressed in a developmentally specific fashion during OL-1 cell maturation
To investigate whether OL-1 cells express oligodendrocyte-specific markers as they undergo morphological development, we utilized qRT-PCR in conjunction with RT to examine the expression of NG2 (an oligodendrocyte precursor cell specific marker), PLP/DM-20 (a mature oligodendrocyte cell specific marker), and GFAP (an astrocyte cell specific marker) during OL-1 cell propagation and maturation. OL-1 cells were propagated in CGM or SFM for 48 h. Expression of NG2, PLP/DM-20, and GFAP mRNA were determined at the beginning and end of the experiment, and results are reported as the change in CT (ΔCT) from the beginning of the experiment. OL-1 cells cultured in SFM showed a significant decrease in NG2 mRNA expression ( p < 0.05), a significant increase in PLP/DM-20 mRNA expression ( p < 0.05), and a significant decrease in GFAP mRNA expression ( p < 0.05; Fig. 4). OL-1 cells propagated in CGM did not exhibit a significant change in NG2 and PLP/DM-20 mRNA expression and exhibited a significant increase in GFAP mRNA expression ( p < 0.05; Fig. 4). To confirm the specificity of the reactions, qRT-PCR products were gel-purified and sequenced. Comparison of the NG2, PLP/DM-20, and GFAP qRT-PCR product DNA sequences to the online rat GenBank mRNA sequences confirmed their match with the respective genes of interest (data not shown).
Fig. 4.

Relative expression of oligodendrocyte lineage cell specific markers in OL-1 cells. Following withdrawal of CGM and culture in SFM for 48 h, expression of NG2 (oligodendrocyte precursor cell specific marker), PLP/DM-20 (mature oligodendrocyte cell specific marker), and GFAP (astrocyte cell specific marker) were determined by RT followed by qRT-PCR. Relative expression is reported as the mean change in cycle number (n = 3) at 48 h from the beginning of the experiment (ΔCT). NG2 expression was significantly decreased, PLP/DM-20 expression significantly increased, and GFAP expression significantly decreased when OL-1 cells were propagated in SFM (*p < 0.05). OL-1 cells propagated in CGM displayed no significant change in NG2 and PLP/DM-20 expression and a significant increase in GFAP expression (*p < 0.05).
In addition, Western blot analysis was carried out to evaluate the expression of oligodendrocyte-specific proteins during OL-1 cell maturation. CNP (a mature oligodendrocyte cell specific protein), NF (a neural cell specific protein), and GFAP (an astrocyte cell specific protein) protein expression were determined at 0 and 48 h following withdrawal of CGM and culture in SFM. OL-1 cells exhibited increased CNP protein expression and decreased GFAP protein expression during their maturation over a 48 h period (Fig. 5). NF was not significantly expressed by OL-1 cells.
Fig. 5.

Expression of oligodendrocyte specific proteins during OL-1 cell maturation. Western blot analysis evaluating the expression of CNP, NF, and GFAP in OL-1 cells at 0 and 48 h following withdrawal of CGM and addition of SFM. CNP protein expression is increased and GFAP protein expression is decreased during OL-1 cell maturation. NF is not significantly expressed by OL-1 cells.
3.3. Immature OL-1 cells express both PLP and DM-20 equally, whereas, mature OL-1 cells express predominately PLP
To determine the relative expression of PLP compared to DM-20 in immature and mature OL-1 cells, PLP/DM-20 qRT-PCR products (generated from the analysis of immature and mature OL-1 cells) were analyzed by agarose gel electrophoresis. Immature OL-1 cells expressed similar quantities of both PLP and DM-20. In contrast, mature OL-1 cells expressed a greater proportion of PLP compared to immature OL-1 cells (Fig. 6).
Fig. 6.

Representative gel showing PLP and DM-20 expression in immature and mature OL-1 cells. The left lane labeled CGM shows PLP/DM-20 PCR products from immature OL-1 cells generated by propagation in CGM, while the right lane labeled SFM shows PLP/DM-20 PCR products from mature OL-1 cells generated by culture in SFM. Note predominance of PLP mRNA expression in mature OL-1 cells, compared to immature OL-1 cells.
3.4. IGF-I promotes OL-1 cell maturation and PLP/DM-20 expression
To evaluate the effect of IGF-I on OL-1 cellular maturation, the number of OL-1 processes was determined 24 and 48 h following IGF-I treatment (Fig. 7 shows these morphological changes). OL-1 cells treated with IGF-I displayed a significantly greater number cell processes per cell at 24 and 48 h (8.7 ± 1.16 and 8.8 ± 1.32, respectively; p < 0.05) compared to OL-1 cells treated with SFM alone (6.0 ± 1.70 and 5.9 ± 0.74).
Fig. 7.

Representative photomicrographs of OL-1 cells following IGF-I treatment. (Panels A and B) OL-1 cells grown 24 and 48 h, respectively, in low insulin SFM without IGF-I displaying sequence of progression to mature oligodendrocyte morphology; (Panels C and D) OL-1 cells grown 24 and 48 h, respectively, in low insulin serum free media with 100 ng/mL IGF-I. Note that with IGF-I there is an increase in cell number and cells display an increase in the number of cell processes.
Next, to investigate the effect of IGF-I on the expression of NG2, PLP/DM-20, and GFAP, OL-1 cells were cultured in low insulin SFM or low insulin SFM with 100 ng/mL IGF-I for 48 h and the expression of NG2, PLP/DM-20, and GFAP determined at the beginning and end of the experiment using qRT-PCR in conjunction with RT. The effect of treatment was expressed as the change in CT (ΔCT) from the beginning of the experiment. OL-1 cells cultured in low insulin SFM with IGF-I showed significantly greater PLP/DM-20 mRNA expression than OL-1 cells propagated in low insulin SFM alone ( p < 0.05; Fig. 8). Although there was a trend toward less NG2 and GFAP mRNA expression in OL-1 cells treated with IGF-I compared to cells cultured in low insulin SFM alone, these differences were not significant (Fig. 8).
Fig. 8.

Relative expression of oligodendrocyte lineage cell specific markers in OL-1 cells during IGF-I treatment. Following withdrawal of CGM and culture in low insulin SFM with 100 ng/mL IGF-I for 48 h, expression of NG2 (oligodendrocyte precursor cell specific marker), PLP/DM-20 (mature oligo-dendrocyte cell specific marker), and GFAP (astrocyte cell specific marker) were determined by RT followed by qRT-PCR. Relative expression is expressed as the mean change in cycle number (n = 3) at 48 h from the beginning of the experiment (ΔCT). OL-1 cell PLP/DM-20 expression was significantly greater with IGF-I treatment (IGF) compared to OL-1 cells propagated in low insulin SFM (*p < 0.05). There was no significant change in NG2 and GFAP expression with IGF-I treatment compared to culture in low insulin SFM.
3.5. IGF-I treatment increases cell number during OL-1 cellular maturation primarily by inhibiting apoptosis
To determine the effect on IGF-I on cell number, OL-1 cells were cultured for 24 h at 37 °C in low insulin SFM or low insulin SFM with 100 ng/mL IGF-I and cell number determined by MTT assay at 3, 6, 12, 18, and 24 h. OL-1 cell number was significantly greater during treatment with IGF-I at 6, 12, 18, and 24 h compared to treatment with low insulin SFM. Furthermore, IGF-I treatment significantly increased OL-1 cell number by 12 h compared to the beginning of the experiment ( p < 0.05), and this effect persisted at 18 ( p < 0.05) and 24 h ( p < 0.05; Fig. 9). In contrast, when cultured in low insulin SFM, OL-1 cell number was significantly decreased compared to the beginning of the experiment at 6 h ( p < 0.05), and this effect also persisted at 12 ( p < 0.05), 18 ( p < 0.05), and 24 h ( p < 0.05; Fig. 9).
Fig. 9.

OL-1 cell number following withdrawal of conditioned growth media (CGM) and treatment with IGF-I. Following withdrawal of CGM, OL-1 cells were treated with either low insulin SFM or low insulin SFM with 100 ng/mL IGF-I for 24 h. Cell numbers are expressed as the mean percentage (n = 8) of the 3 h low insulin (no IGF-I) SFM control. OL-1 cell number was significantly greater with IGF-I treatment at 6, 12, 18, and 24 h compared to treatment with low insulin SFM (*p < 0.05). IGF-I treatment also increased OL-1 cell number compared to the beginning of the experiment 12, 18, and 24 h (*p < 0.05). When treated with low insulin SFM, OL-1 cell number was significantly lower than the beginning of the experiment at 6, 12, 18, and 24 h (*p < 0.05).
To investigate the mechanism by which IGF-I increases cell number, we evaluated the effect of the caspase inhibitors Z-DEVD-FMK and Z-VAD-FMK (inhibitors of caspases 3, 6, 7, 8, 10 and 1, 3, 4, respectively) on OL-1 cell number. OL-1 cells were cultured for 24 h in low insulin SFM alone, low insulin SFM with inhibitors, low insulin SFM with 100 ng/mL IGF-I without inhibitor, and low insulin SFM with 100 ng/mL IGF-I and inhibitors. Cell number was determined at 24 h by MTT assay. Treatment with Z-DEVD-FMK, increased OL-1 cell number significantly ( p < 0.05), compared to the beginning of the experiment and there was a trend toward further increases in cell number with increasing concentrations of inhibitor (Fig. 10, panel A). There was also a significant increase in OL-1 cell number compared to the beginning of the experiment with Z-VAD-FMK treatment ( p < 0.05); however, this effect was lost at inhibitor concentrations greater than 20 μM (Fig. 10, panel B). Concurrent treatment with caspase inhibitors and IGF-I did not increase OL-1 cell number to the extent of IGF-I treatment alone (Fig. 10, panels A and B).
Fig. 10.

Ol-1 cell number following treatment with IGF-I and caspase inhibitors. (Panel A) OL-1 cells treated with low insulin SFM, low insulin SFM with 100 ng/mL IGF-I with and without the caspase inhibitor Z-DEVD-FMK, and with low insulin SFM with increasing concentrations of caspase inhibitor. Z-DEVD-FMK inhibits caspases 3, 6, 7, 8, and 10. (Panel B) OL-1 cells were treated with low insulin SFM, low insulin SFM with 100 ng/mL IGF-I with and without the caspase inhibitor Z-VAD-FMK, and with low insulin SFM with increasing concentrations of caspase inhibitor. Z-VAD-FMK inhibits caspases 1, 3, and 4. OL-1 cell number is expressed as the mean percentage (n = 3) of the untreated control. OL-1 cell number was significantly increased from control following IGF-I treatment (*p < 0.05). Treatment with caspase inhibitors also increased OL-1 cell number (*p < 0.05) but to a lesser degree than IGF-I treatment. Combined treatment with caspase inhibitors and IGF-I increased OL-1 cell number (*p < 0.05) comparable to that of IGF-I treatment.
To investigate whether proliferation plays a significant role in IGF-I-stimulated increases in cell number, BrdU incorporation into OL-1 cells was determined during IGF-I exposure. OL-1 cells were cultured for 24 h at 37 °C in CGM, low insulin SFM, or low insulin SFM with 100 ng/mL IGF-I, and BrdU labeling determined at 3, 6, 12, 18, and 24 h. BrdU positive cells were expressed as a percentage of total cells. Propagation of OL-1 cells in CGM resulted in sustained BrdU labeling ranging from 44 to 56%. IGF-I exposure increased the percentage of BrdU labeled OL-1 cells compared to low insulin SFM treatment at 3, 6, 18, and 24 h (Fig. 11). IGF-I treatment, however, resulted in a progressive decline in the percentage of BrdU labeled cells from 47% at the beginning of the experiment to 14% at 24 h compared to CGM (Fig. 11).
Fig. 11.

BrdU labeled OL-1 cell number following IGF-I exposure. OL-1 cells were exposed to conditioned growth media, low insulin SFM, or low insulin SFM with 100 ng/mL IGF-I for a 24 h period. BrdU was added to cultures for a 3 h period prior to cell harvest at 3, 6, 12, 18, and 24 h. BrdU labeled and total OL-1 cell numbers were determined at 3, 6, 12, 18, and 24 h. BrdU positive cells are expressed as a mean percentage (n = 2) of total cells and error bars represent each of two duplicates. OL-1 cells propagated in CGM exhibited sustained levels of BrdU labeling ranging from 44 to 56%. During IGF-I treatment, although BrdU labeling was slightly increased compared to SFM, there was a progressive reduction in BrdU labeling from 47% at the beginning of the experiment to 14% at 24 h.
4. Discussion
A non-immortalized oligodendrocyte precursor cell line, OL-1, is described that shares the characteristics of primarily cultured oligodendrocyte progenitors and provides a model of in vivo oligodendrocyte development. Study of OL-1 cells facilitates investigation into oligodendrocyte lineage signaling mechanisms. Only one such cell line, CG-4, has been reported, and thus OL-1 cells offer an alternative culture model for the study of either OPCs, mature oligodendrocytes, or OPCs undergoing differentiation. Our findings that IGF-I actions on OL-1 cells parallels its actions on OPCs in vivo and in vitro, namely promotion of differentiation and survival, strongly supports the value of this cell line as an investigational model.
OL-1 cells can be propagated in culture to obtain large numbers of cells and can be cryopreserved for future use. OL-1 cells have morphology consistent with immature oligodendrocytes and withdrawal of CGM promotes their development into mature oligodendrocytes. As OL-1 cells mature, their number decreases and there is a shift from the expression of immature cell markers (A2B5 and NG2) to mature cell markers (MBP and PLP/DM-20). Furthermore, immature OL-1 cells express PLP and DM-20, whereas, mature OL-1 cells predominantly express PLP. With exposure to IGF-I, OL-1 cells develop an increased number of processes, increased PLP/DM-20 expression, and exhibit increased cell survival. Concurrent treatment of OL-1 cells with IGF-I and caspase inhibitors Z-DEVD-FMK and Z-VAD-FMK (inhibitors of caspases 3, 6, 7, 8, 10 and 1, 3, 4, respectively) and BrdU studies indicate that the IGF-I-stimulated increases in cell number are mediated primarily through increased survival. Thus, OL-1 cells exhibit morphologic progression and changes in cell markers consistent with developing oligodendrocytes, and OL-1 cells exposed to IGF-I exhibit responses consistent with developing oligodendrocytes in vivo (de Vellis, 1990; Richardson, 2001).
The OL-1 line was developed by first generating mixed glial cultures from P2 rat brains according to the method of McCarthy and de Vellis (1980) followed by separation and expansion of oligodendrocyte precursors in CGM. The method is similar to that used by Louis et al. (1992) during the generation of the CG-4 cell line (an oligodendrocyte precursor cell line similar to OL-1) with a few differences. First, we used fetal calf serum during the initial generation of the mixed glial cultures in contrast to the calf serum used by Louis et al. (1992). This difference in the serum used may explain why most of the lines generated by Louis et al. prior to CG-4 died after a limited number of passages, because fetal calf serum likely contains greater quantities of trophic factors and/or distinct factors that support and/or facilitate OPCs propagation. Second, by using serial dilutions to isolate and subsequently expand OPCs, OL-1 cells are derived from a pool of precursors rather than a single cell. We suspect that this reduced the possibility of the selection of cells with aberrant characteristics.
When OL-1 cells are propagated in CGM they exhibit morphology consistent with immature oligodendrocytes (bipolar shapes and ovoid cell body). A2B5 immunoreactivity is strong and MBP immunoreactivity is absent. Under these conditions, OL-1 cells fail to mature and do not express markers of mature oligodendrocyte function. Expansion of OL-1 cells in CGM, thus provides a means of generating large numbers of oligodendrocyte precursors for study. After withdrawal of CGM, OL-1 cells develop rounded cell bodies and dramatically increased numbers of cell processes with complex branching patterns. During this process they exhibit decreased A2B5 immunoreactivity and NG2 mRNA expression, increased MBP immunoreactivity, PLP/DM-20 mRNA expression, and CNP protein expression, and their number decreases. Immature OL-1 cells express DM-20 and PLP mRNA in roughly equal proportions, while mature OL-1 cells express predominately PLP mRNA. These findings are consistent with the behavior of developing oligodendrocytes both in vivo and in vitro (de Vellis, 1990; Richardson, 2001) and the O2A-like oligodendrocyte precursor cell line CG-4 developed by Louis et al. (1992). OL-1 cells propagated in CGM under the conditions in our experiments resulted in significant increases in GFAP expression. However, the cells propagated in CGM were significantly overgrown at the end of the experiment (48 h; data not shown). During propagation of the OL-1 cell line in CGM, therefore, great care was taken to not allow the cells to overgrow.
The maturation of OL-1 cells into mature oligodendrocytes over a 48 h period following withdrawal of CGM and culture in SFM is consistent with the maturation time of other OPC culture systems reported in the literature including CG-4 cells (Louis et al., 1992) and O2A cells (Raff et al., 1983). Although significant maturation occurs within the first 24 h of culture in SFM, OL-1 cells mature substantially further when culture is continued to 48 h and even further when continued to 72 h. More important than their time to maturation are the findings that: (1) OL-1 cell maturation is predictably and tightly controlled by CGM withdrawal and the addition SFM and (2) the rate and homogeneity of phenotypic maturation is consistent among multiple experiments. To evaluate the utility of the OL-1 cell line as a model for the study of the IGF-I actions during oligodendrocyte development, we exposed OL-1 cells to IGF-I during their maturation into oligodendrocytes. Exposure to IGF-I promoted increased numbers of cell processes, increased PLP/DM-20 expression, and increased OL-1 cell number. This is consistent with IGF-I actions on developing oligodendrocytes and myelin in vivo (Beck et al., 1995; Carson et al., 1993; D’Ercole et al., 1994; Murphy et al., 1993; Ye et al., 1995; Ye et al., 2002). Exposure of OL-1 cells to caspase inhibitors also produced increases in OL-1 cell number, but to a lesser degree than IGF-I. Concurrent treatment with caspase inhibitors and IGF-I produced increases in OL-1 cell number equivalent to that observed with IGF-I. These data indicate that the effect of IGF-I on OL-1 cell number is at least in part mediated through inhibition of apoptosis. The observation that caspase inhibitor treatment did not completely replicate the effect of IGF-I could be explained by: (1) incomplete inhibition of the caspase activity by Z-DEVD-FMK and Z-VAD-FMK, (2) the actions of caspases other than those inhibited by Z-DEVD-FMK and Z-VAD-FMK on IGF-I anti-apoptotic action, (3) increased proliferation, and/or (4) other mechanisms involved in IGF-I mediated cell survival.
To determine whether IGF-I-stimulated increases in cell number are mediated by stimulation of cell proliferation, we assessed BrdU incorporation in OL-1 cells. As expected, OL-1 cells propagated in CGM exhibited sustained and high levels of BrdU incorporation, while OL-1 cells propagated in SFM displayed a progressive decline in BrdU incorporation. Although exposure to IGF-I resulted in slightly greater BrdU incorporation, progressive decreases in BrdU incorporation similar to cells cultured in SFM were observed. This suggests that while the IGF-I stimulated increases in OL-1 cell number may in part be explained by increased proliferation, IGF-I effects are predominantly mediated through increases in cell survival. BrdU uptake, however, has been reported to occur as part of the apoptotic process (Kuan et al., 2004), and thus, IGF-I’s sole action on OL-1 cell number may be anti-apoptotic. These data are consistent with previous in vitro studies (Barres et al.,1993; Vemuri and McMorris, 1996) and collectively support the notion that IGF-I stimulated increases in cell number during OL-1 cell maturation are mediated by inhibition of apoptosis.
In conclusion, we have established a non-immortalized oligodendrocyte precursor cell line that develops into mature oligodendrocytes in vitro following withdrawal of CGM and culture in SFM. The behavior of OL-1 cells during maturation is consistent with oligodendrocyte precursors and developing oligodendrocytes, as well as with the CG-4 cell line. With exposure to IGF-I, OL-1 cells develop increased number of cell processes, increased PLP/DM-20 expression, and enhanced cell survival consistent with in vivo IGF-I actions on developing oligodendrocytes and myelin. OL-1 cells may also be easily propagated in vitro to provide the large numbers of cells needed for experiments. Cells may be cryopreserved and stored for use in future experiments. Thus, the OL-1 cell line provides an excellent alternative cell culture model for the study of oligodendrocyte development.
Acknowledgments
This work was supported by NIH grants NS038891 and NS048868 (to AJD).
References
- Barres BA, et al. Multiple extracellular signals are required for long-term oligodendrocyte survival. Development. 1993;118(1):283–295. doi: 10.1242/dev.118.1.283. [DOI] [PubMed] [Google Scholar]
- Beck KD, et al. Igf1 gene disruption results in reduced brain size, CNS hypomyelination, and loss of hippocampal granule and striatal parvalbumin-containing neurons. Neuron. 1995;14(4):717–730. doi: 10.1016/0896-6273(95)90216-3. [DOI] [PubMed] [Google Scholar]
- Bogler O, et al. Cooperation between two growth factors promotes extended self-renewal and inhibits differentiation of oligodendrocyte-type-2 astrocyte (O-2A) progenitor cells. Proc Natl Acad Sci USA. 1990;87(16):6368–6372. doi: 10.1073/pnas.87.16.6368. [DOI] [PMC free article] [PubMed] [Google Scholar]
- Calver AR, et al. Oligodendrocyte population dynamics and the role of PDGF in vivo. Neuron. 1998;20(5):869–882. doi: 10.1016/s0896-6273(00)80469-9. [DOI] [PubMed] [Google Scholar]
- Carson MJ, et al. Insulin-like growth factor I increases brain growth and central nervous system myelination in transgenic mice. Neuron. 1993;10(4):729–740. doi: 10.1016/0896-6273(93)90173-o. [DOI] [PubMed] [Google Scholar]
- D’Ercole AJ, et al. Brain growth retardation due to the expression of human insulin like growth factor binding protein-1 in transgenic mice: an in vivo model for the analysis of igf function in the brain. Brain Res Dev Brain Res. 1994;82(12):213–222. doi: 10.1016/0165-3806(94)90164-3. [DOI] [PubMed] [Google Scholar]
- de Vellis J. Developmental and hormonal regulation of gene expression in oligodendrocytes. Ann NY Acad Sci. 1990;605:81–89. doi: 10.1111/j.1749-6632.1990.tb42383.x. [DOI] [PubMed] [Google Scholar]
- Denizot F, Lang R. Rapid colorimetric assay for cell growth and survival Modifications to the tetrazolium dye procedure giving improved sensitivity and reliability. J Immunol Meth. 1986;89(2):271–277. doi: 10.1016/0022-1759(86)90368-6. [DOI] [PubMed] [Google Scholar]
- Dhar AK, Roux MM, Klimpel KR. Quantitative assay for measuring the Taura syndrome virus and yellow head virus load in shrimp by real-time RT-PCR using SYBR Green chemistry. J Virol Meth. 2002;104(1):69–82. doi: 10.1016/S0166-0934(02)00042-3. [DOI] [PMC free article] [PubMed] [Google Scholar]
- Fruttiger M, et al. Defective oligodendrocyte development and severe hypomyelination in PDGF-A knockout mice. Development. 1999;126(3):457–467. doi: 10.1242/dev.126.3.457. [DOI] [PubMed] [Google Scholar]
- Gard AL, Pfeiffer SE. Glial cell mitogens bFGF and PDGF differentially regulate development of O4 + GalC-oligodendrocyte progenitors. Dev Biol. 1993;159(2):618–630. doi: 10.1006/dbio.1993.1269. [DOI] [PubMed] [Google Scholar]
- Hall A, Giese NA, Richardson WD. Spinal cord oligodendrocytes develop from ventrally derived progenitor cells that express PDGF alpha-receptors. Development. 1996;122(12):4085–4094. doi: 10.1242/dev.122.12.4085. [DOI] [PubMed] [Google Scholar]
- Jung M, et al. Lines of murine oligodendroglial precursor cells immortalized by an activated neu tyrosine kinase show distinct degrees of interaction with axons in vitro and in vivo. Eur J Neurosci. 1995;7(6):1245–1265. doi: 10.1111/j.1460-9568.1995.tb01115.x. [DOI] [PubMed] [Google Scholar]
- Kuan CY, et al. Hypoxia-ischemia induces DNA synthesis without cell proliferation in dying neurons in adult rodent brain. J Neurosci. 2004;24(47):10763–10772. doi: 10.1523/JNEUROSCI.3883-04.2004. [DOI] [PMC free article] [PubMed] [Google Scholar]
- Lee JC, Mayer-Proschel M, Rao MS. Gliogenesis in the central nervous system. Glia. 2000;30(2):105–121. doi: 10.1002/(sici)1098-1136(200004)30:2<105::aid-glia1>3.0.co;2-h. [DOI] [PubMed] [Google Scholar]
- Louis JC, et al. CG-4, a new bipotential glial cell line from rat brain, is capable of differentiating in vitro into either mature oligodendrocytes or type-2 astrocytes. J Neurosci Res. 1992;31(1):193–204. doi: 10.1002/jnr.490310125. [DOI] [PubMed] [Google Scholar]
- Matsushita T, et al. A novel oligodendrocyte cell line OLP6 shows the successive stages of oligodendrocyte development: late progenitor, immature and mature stages. Neuroscience. 2005;136(1):115–121. doi: 10.1016/j.neuroscience.2005.07.011. [DOI] [PubMed] [Google Scholar]
- McCarthy KD, de Vellis J. Preparation of separate astroglial and oligodendroglial cell cultures from rat cerebral tissue. J Cell Biol. 1980;85(3):890–902. doi: 10.1083/jcb.85.3.890. [DOI] [PMC free article] [PubMed] [Google Scholar]
- McKinnon RD, et al. FGF modulates the PDGF-driven pathway of oligodendrocyte development. Neuron. 1990;5(5):603–614. doi: 10.1016/0896-6273(90)90215-2. [DOI] [PubMed] [Google Scholar]
- McMorris FA, Dubois-Dalcq M. Insulin-like growth factor I promotes cell proliferation and oligodendroglial commitment in rat glial progenitor cells developing in vitro. J Neurosci Res. 1988;21(2–4):199–209. doi: 10.1002/jnr.490210212. [DOI] [PubMed] [Google Scholar]
- McMorris FA, et al. Insulin-like growth factor I/somatomedin C: a potent inducer of oligodendrocyte development. Proc Natl Acad Sci USA. 1986;83(3):822–826. doi: 10.1073/pnas.83.3.822. [DOI] [PMC free article] [PubMed] [Google Scholar]
- Mozell RL, McMorris FA. Insulin-like growth factor I stimulates oligodendrocyte development and myelination in rat brain aggregate cultures. J Neurosci Res. 1991;30(2):382–390. doi: 10.1002/jnr.490300214. [DOI] [PubMed] [Google Scholar]
- Murphy LJ, Barron D, Seneviratne C. Hormonal regulation of insulin-like growth factor binding protein-1 expression and the development of transgenic mouse models to study IGFBP-1 function. Adv Exp Med Biol. 1993;343:279–291. doi: 10.1007/978-1-4615-2988-0_27. [DOI] [PubMed] [Google Scholar]
- Nishiyama A, et al. Co-localization of NG2 proteoglycan and PDGF alpha-receptor on O2A progenitor cells in the developing rat brain. J Neurosci Res. 1996;43(3):299–314. doi: 10.1002/(SICI)1097-4547(19960201)43:3<299::AID-JNR5>3.0.CO;2-E. [DOI] [PubMed] [Google Scholar]
- Noble M, et al. Platelet-derived growth factor promotes division and motility and inhibits premature differentiation of the oligodendrocyte/type-2 astrocyte progenitor cell. Nature. 1988;333(6173):560–562. doi: 10.1038/333560a0. [DOI] [PubMed] [Google Scholar]
- Raff MC, et al. Platelet-derived growth factor from astrocytes drives the clock that times oligodendrocyte development in culture. Nature. 1988;333(6173):562–565. doi: 10.1038/333562a0. [DOI] [PubMed] [Google Scholar]
- Raff MC, Miller RH, Noble M. A glial progenitor cell that develops in vitro into an astrocyte or an oligodendrocyte depending on culture medium. Nature. 1983;303(5916):390–396. doi: 10.1038/303390a0. [DOI] [PubMed] [Google Scholar]
- Rao MS, Noble M, Mayer-Proschel M. A tripotential glial precursor cell is present in the developing spinal cord. Proc Natl Acad Sci USA. 1998;95(7):3996–4001. doi: 10.1073/pnas.95.7.3996. [DOI] [PMC free article] [PubMed] [Google Scholar]
- Richardson WD. Oligodendrocyte development. In: Jessen KR, Richardson WD, editors. Glial Cell Development. 2. Oxford University Press; 2001. [Google Scholar]
- Richardson WD, et al. A role for platelet-derived growth factor in normal gliogenesis in the central nervous system. Cell. 1988;53(2):309–319. doi: 10.1016/0092-8674(88)90392-3. [DOI] [PubMed] [Google Scholar]
- Richter-Landsberg C, Heinrich M. OLN-93: a new permanent oligodendroglia cell line derived from primary rat brain glial cultures. J Neurosci Res. 1996;45(2):161–173. doi: 10.1002/(SICI)1097-4547(19960715)45:2<161::AID-JNR8>3.0.CO;2-8. [DOI] [PubMed] [Google Scholar]
- Ririe KM, Rasmussen RP, Wittwer CT. Product differentiation by analysis of DNA melting curves during the polymerase chain reaction. Anal Biochem. 1997;245(2):154–160. doi: 10.1006/abio.1996.9916. [DOI] [PubMed] [Google Scholar]
- Vemuri GS, McMorris FA. Oligodendrocytes and their precursors require phosphatidylinositol 3-kinase signaling for survival. Development. 1996;122(8):2529–2537. doi: 10.1242/dev.122.8.2529. [DOI] [PubMed] [Google Scholar]
- Verity AN, et al. Expression of myelin protein genes and other myelin components in an oligodendrocytic cell line conditionally immortalized with a temperature-sensitive retrovirus. J Neurochem. 1993;60(2):577–587. doi: 10.1111/j.1471-4159.1993.tb03188.x. [DOI] [PubMed] [Google Scholar]
- Ye P, Carson J, D’Ercole AJ. In vivo actions of insulin-like growth factor-I (IGF-I) on brain myelination: studies of IGF-I and IGF binding protein-1 (IGFBP-1) transgenic mice. J Neurosci. 1995;15(11):7344–7356. doi: 10.1523/JNEUROSCI.15-11-07344.1995. [DOI] [PMC free article] [PubMed] [Google Scholar]
- Ye P, D’Ercole AJ. Insulin-like growth factor I protects oligodendrocytes from tumor necrosis factor-alpha-induced injury. Endocrinology. 1999;140(7):3063–3072. doi: 10.1210/endo.140.7.6754. [DOI] [PubMed] [Google Scholar]
- Ye P, et al. Myelination is altered in insulin-like growth factor-I null mutant mice. J Neurosci. 2002;22(14):6041–6051. doi: 10.1523/JNEUROSCI.22-14-06041.2002. [DOI] [PMC free article] [PubMed] [Google Scholar]