Abstract
Vocal tract shaping patterns based on articulatory fleshpoint data from four speakers in the University of Wisconsin X-ray microbeam (XRMB) database [Westbury, UW-Madison, 1994] were determined with a Principal Component Analysis (PCA). Midsagittal cross-distance functions representative of approximately the front six centimeters of the oral cavity for each of eleven vowels and vowel-vowel sequences were obtained from the pellet positions and the hard palate profile for the four speakers. A PCA was independently performed on each speaker’s set of cross-distance functions representing static vowels only, and again with time-dependent cross-distance functions representing vowels and VV sequences. In all cases, results indicated that the first two orthogonal components (referred to as modes) accounted for more than 97% of the variance in each speaker’s set of crossdistance functions. In addition, the shape of each mode was shown to be similar across the speakers suggesting that the modes represent common patterns of vocal tract deformation. Plots of the resulting time-dependent coefficient records showed that the four speakers activated each mode similarly during production of the vowel sequences. Finally, a procedure was described for using the time-dependent mode coefficients obtained from the XRMB data as input for an area function model of the vocal tract.
I. INTRODUCTION
The structure of the vocal tract and the acoustic characteristics produced by it are well known to be speaker-dependent. There seem to exist, however, vocal tract shaping patterns for vowel production that are common across speakers. The purpose of this study was to determine whether these common shapes could be revealed from spatially sparse articulatory fleshpoint data of the oral portion of the vocal tract and, if so, to exploit this commonality in order to develop a means by which time-dependent changes of the vocal tract shape can be realistically simulated with an area function model.
The use of factor analysis for determining displacement patterns of the midsagittal tongue shape was established by Harshman et al. (1977). They found that only two factors (patterns) accounted for a large amount of the variance in the tongue shape during vowel production. When appropriately weighted and superimposed on the mean shape, these two factors could be used to reconstruct the configuration of the tongue for ten English vowels. At nearly the same time Shirai and Honda (1977) demonstrated that the tongue configuration could be described by two empirically-determined displacement patterns. Subsequent studies of tongue shape using either factor or principal component analyses have similarly concluded that two shaping patterns can generally describe the midsagittal tongue shape during vowel production in various languages (Johnson et al. 1993; Nix et al. 1996; Hoole, 1999; Zheng et al. 2003; Iskarous, 2005). In each study, the shaping patterns more or less conform to the view that one pattern captures the forward and upward movement of the tongue, while a second pattern describes upward and backward motion.
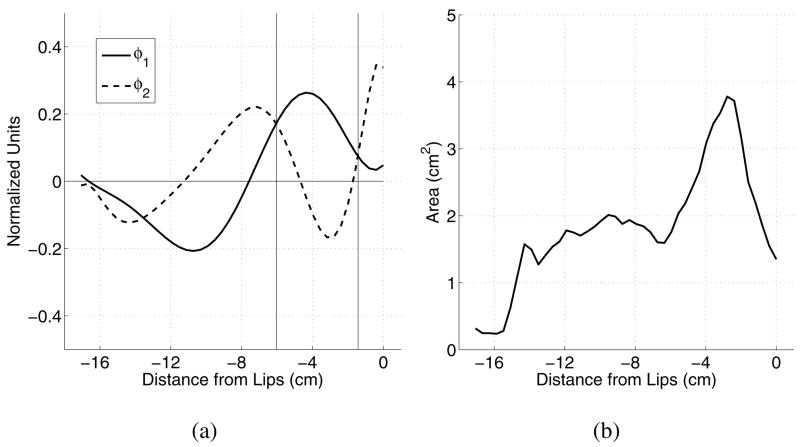
Similar analyses of vocal tract area functions have indicated that the shape of the airspace, extending from glottis to lips, can also be efficiently described by only a few canonical patterns. Story (2005b) showed that sets of 11 vowel area functions from six speakers could each be represented by two principal components, referred to as modes1, and a mean area function. The shape of each mode was highly correlated across the six speakers, whereas, the mean area functions tended to be more speaker-specific. These results were similar to the earlier findings of Story and Titze (1998) for 10 vowel area functions of one speaker. As an example, two modes, based on the ten vowel area functions of Story et al. (1996), are shown in Figure 1 (note that the origin is assumed to be at the lips, hence, the negative numbers on the x-axis indicate a leftward direction.) When superimposed on the mean area function with a positive weighting coefficient, the first mode φ1 would have the effect of expanding the oral cavity portion of the vocal tract while constricting the pharynx; a negative coefficient would have the opposite effect. The region near lips, however, would be left nearly unchanged by either a positive or negative coefficient. This suggests that a large negative weighting on φ1 may produce a vocal tract shape representative of an [i], whereas a positive weighting would produce a shape similar to an[ɔ] (i.e. an expanded oral cavity but relatively small opening at the lips). A positively weighted second mode φ2 would impose expansions in the lip and mid-tract regions, and constrictions from 1 to 5 cm posterior to the lips and just above the glottis. This roughly produces an [æ]-like vowel, whereas a negative weighting would approximate more of an [o]-like vowel.
FIG. 1.
Modes and mean area function determined from a 10-vowel set of area functions for an adult male (from Story et al. (1996)) shown as a function of the distance from the lips; a negative sign is used because of the leftward orientation of the glottis to the lips. (a) Modes φ1 (solid) and φ2; the vertical lines denote points at which the modes intersect in the front half of the vocal tract; and (b) Mean area function.
Recently, Mokhtari et al. (2007) have performed a principal component analysis on area functions of the Japanese vowels [i, e, ɑ, o, ɯ] obtained with MRI from one male speaker. They found that the first two components accounted for over 97% of the variance in the five-vowel set, and their spatial variation along the vocal tract length was remarkably similar to those shown in Fig. 1 (and in Story, 2005b) that were derived from American English vowels. A second principal component analysis was performed on the original five “still” vowels, but augmented with a set of 35 area functions obtained with a 3D cine-MRI technique over the time course of the vowel transition utterance [ɑiɯeo]. Although the variance accounted for by each component was slightly different, their shapes were essentially the same as in the PCA of the five-vowel set, indicating a robust existence of the component shapes over time.
The modes (or factors, components, etc.) are, in a strict sense, statistical constructs that explain certain levels of variance in collections of articulatory postures and reduce the dimensionality of the original data set. Whereas a significant compression of data may be reason enough to utilize a technique such as PCA, there is no a priori reason to expect that the resulting basis functions would reveal information that could be interpreted specifically as articulatory or phonetic in nature. Nonetheless, the particular shapes of the modes, components, and factors reported in a succession of studies all seem to describe essentially the same type of basic tongue and vocal tract shaping patterns for vowels, as described previously. Although such common patterns could potentially be interpreted as an artifact of the particular statistical methods applied to similar types of data (i.e., articulatory data for vowel production), such cross-speaker and cross-linguistic commonalities have led to the suggestion that these patterns may capture some surface aspects of underlying muscle synergies and biomechanical constraints utilized during speech production (e.g., Kelso et al. 1986; Fowler and Saltzman, 1993; Maeda, 1991; Hoole, 1999; Perrier et al. 2000; Story 2005a). Limited physiological evidence supporting this view has been reported by Maeda and Honda (1994), but certainly further studies are needed to establish whether a relation between the planning and execution of speech production movements and the kinematic patterns described by the mode shapes actually exists. In the least, however, it is well established that a mode-based model of the area function allows for an efficient representation of a wide variety of realistic vocal tract shapes, and provides a means by which to investigate the relation between the area function and resulting acoustic characteristics.
The shaping patterns provided by a set of modes are ultimately of most use if they can parsimoniously explain the time-dependent changes that occur in the vocal tract during continuous (connected) speech. Their time dependence may then be interpreted as a type of “activation signal” of a particular synergy of various portions of vocal tract. There is some evidence that this may be the case. Maeda (1991) demonstrated that the time-dependent weighting of statistically-derived articulatory parameters (similar to factors but guided a priori with respect to individual articulators), could produce realistic vocal tract shapes. Later, Bouabana and Maeda (1998) used a novel multi-pulse LPC technique for determining the temporal variation of their statistical patterns. Iskarous (2005) has also recently shown that a weighted combination of two tongue shaping patterns provides a reasonable description of tongue configuration over the time course of articulatory transitions.
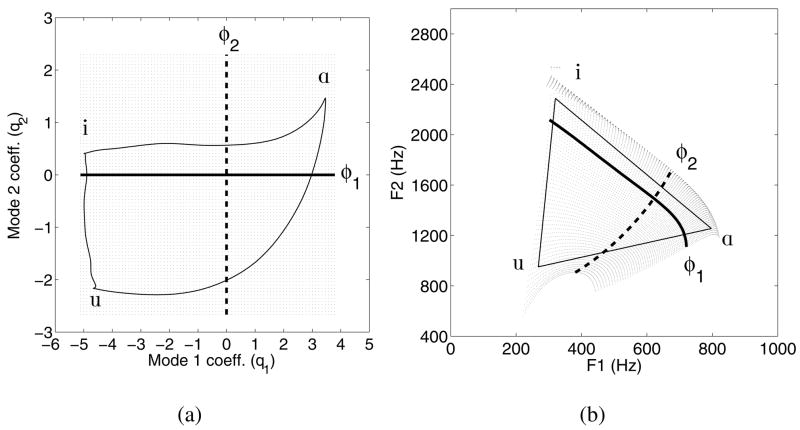
From the perspective of the area function representation of the vocal tract, the mode shapes shown previously in Fig. 1, as well as those for the six speakers in Story (2005b), have been used as the basis for generating one-to-one (or nearly so) mappings between the first two formant frequencies and the weighting coefficients of the modes. Shown in Figure 2a is an 80×80 grid of weighting coefficients for the modes in Fig. 1. Any point within this grid can be used to generate an area function according to,
FIG. 2.
Mapping between the mode coefficients (q1 and q2) in (a) and formant frequencies (the F1 and F2) in (b). The dark solid line and the dashed line in (a) indicate the range of coefficient values for each of the two modes, respectively; the [F1,F2] pairs produced by the coefficients (via an area function) along each line are shown in (b) by the same line styles. The curved light lines in the left plot are the coefficient variations that correspond to the triangular, hypothetical [F1, F2] trajectory for [iɑui] shown on the right.
| (1) |
where x is, in this case, the distance from the lips, Ω(x) is the mean diameter function, φ1(x) and φ2(x) are the modes, and q1 and q2 are the weighting coefficients. Since the principal component analysis was performed on the equivalent diameters of each cross-sectional area within the area function sets, the squaring operation and scaling by π/4 are needed to convert diameter to area. F1 and F2 formant frequencies calculated for each area function defined by the 6400 points in Fig. 2a, are plotted as a grid in Fig. 2b. With the exception of the upper left corner, there is only one formant pair in Fig. 2b associated with each coefficient pair in Fig. 2a. The acoustic effect of each mode in isolation (i.e., when q1 or q2 is equal to zero) is indicated by the solid dark line (φ1) and dashed line (φ2). Both these individual mode lines and the grids show that the coefficient space is warped as it is transformed into the formant space by the nonlinear relation between the area function and acoustic resonances, but a nearly one-to-one relation between them is maintained.
It is noted that this approach to parameterizing the vocal tract area function shares some similarities with the methods reported by Schroeder (1967) and Mermelstein (1967). Based on purely acoustic considerations of perturbing the shape of a uniform tube (closed at one end), both authors showed that the area function could be represented as the sum of a Fourier series, which serves as the basis function set, and a constant area from glottis to lips. In both studies, the many-to-one nature of the mapping between formant frequencies and the area function was apparent when both even and odd terms of the Fourier series were used; i.e., since the even terms are related to the zeroes in the spectrum they do not change the formant frequencies (poles) but do alter the shape of the area function. In comparison, the mode-based representation given by Eqn. 1 also generates an area function as the sum of a constant tract shape, Ω(x), with the sum of a set of scaled basis functions, q1φ1(x) + q2φ2(x). The difference is that the constant tract shape is nonuniform along the length of the vocal tract and the basis functions are the empirically-based modes. The relation between the two mode coefficients (or more precisely, the area functions generated by them) and the first two formant frequencies is limited to being essentially one-to-one because of the natural constraints that are imposed when extracting the modes from an empirically-based set of area functions. Thus, a Fourier series representation of the area function can be considered to be based on the theoretically-derived acoustical possibilities of deforming a uniform tube, whereas Eqn. (1) is based on the empirically-derived kinematic possibilities of deforming the neutral vocal tract shape. Theoretical acoustic studies of a nonuniform, but neutral, vocal tract shape may eventually be able to bridge these two representations, perhaps by determining an acoustic origin for the mode shapes.
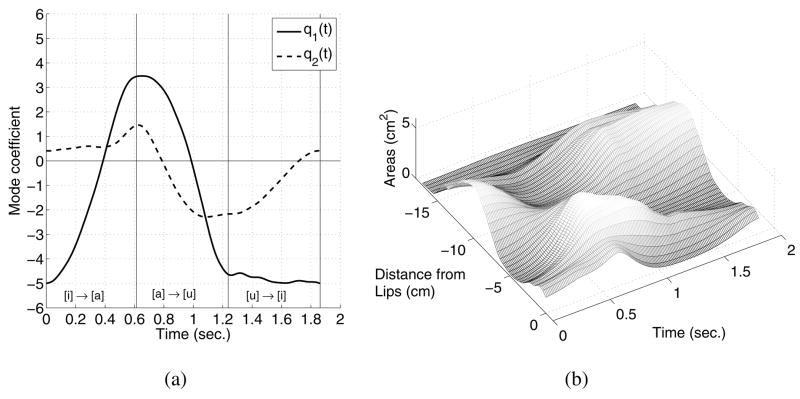
The mapping shown in Fig. 2 has served as a means by which time-dependent weighting coefficients for each mode may be obtained from time-varying formant frequencies (Story and Titze, 1998; 2002). As an example, the triangle superimposed on the formant space in Fig. 2b is a hypothetical trajectory for the vowel transition [iɑui]. The corresponding coefficient trajectory is shown as the solid line superimposed on the coefficient space in Fig. 2a. Note that some curvature is imposed on each leg of the triangle as it is transformed from the formant to coefficient space. The coefficient trajectory is shown alternatively in Figure 3a as two functions of time, q1(t) and q2(t); the vertical lines indicate the points in time that correspond to the corners of the triangle. The q1(t) and q2(t) can then be used as input “signals” in a time-dependent version of Eqn. (1) (Story, 2005a), which will produce an area function that varies continuously over the time course of the utterance. The resulting time-varying area function is shown in Fig. 3b.
FIG. 3.
(a) Time-dependent mode coefficients for [iɑui] (b)Time-dependent area function generated by the coefficients in (a) and a time-dependent version of Eqn. (1).
The representation of the area function by linear combinations of modes has been shown to be a useful approach for modeling and studying the change in vocal tract shape over the time course of speech utterances (Story, 2005a). The coefficient-to-formant mapping has also proved to be an effective technique for transforming formant frequency data to time-varying area functions. There still remains a question, however, as to whether the area function perturbations derived via the mapping are representative of actual vocal tract shape changes produced by a real speaker. The answer to this question would ideally be explored by comparing the time-varying area function determined with the mapping (e.g., Fig. 2) to that obtained with 3D time-dependent MRI, similar to that used by Mokhtari et al. (2007). There are, however, much larger amounts of articulatory flesh-point data in existence that can potentially be a source of information about the time-dependence of articulatory modes.
In the present study, a PCA was applied to data from the University of Wisconsin’s x-ray microbeam (XRMB) database (Westbury, 1994). Coordinates of the XRMB fleshpoint pellets, along with the outline of the hard palate, were used to approximate the shape of the vocal tract in terms of a midsagittal cross distance function, extending posteriorly from the lips to approximately the soft palate. Although cross-sectional area is the acoustically-relevant quantity for defining the vocal tract shape, a transformation from cross-distance to area tends to be speaker dependent (Sundberg et al. 1987; Baer et al. 1991). Without information concerning such a transformation for each speaker in the XRMB database, and having only fleshpoint data (as opposed to a midsagittal x-ray projection), conversion from distance to area would likely impose a high degree of error. Furthermore, in previous studies (e.g., Story and Titze, 1998; Story, 2005b; & Mokhtari et al. 2007), the PCA was performed on the square root of the area (or equivalent diameter), a quantity that is dimensionally similar to the cross-distance. Another potential limitation is that since the placement of the pellets was limited to the oral cavity, the cross-distance functions, as well as the subsequent “modes” determined with the PCA, strictly describe only the oral portion of the vocal tract. If, however, the shapes of the modes within the oral cavity exhibit features similar to those derived from whole-tract area functions (e.g., Fig. 1) it may be speculated that the pharyngeal (missing) part of the XRMB-based modes would be similar to the pharyngeal portion of the wholetract modes.
The specific aims were 1) to determine and compare mode shapes for four speakers based on eleven vowels each, and again when vowel-to-vowel sequences were included; 2) to compare the mode coefficients determined over the time course of vowel-vowel sequences across speakers; and 3) to demonstrate the use of time-varying coefficients extracted from XRMB data as input signals for an area function model of the vocal tract. The method, results, and some discussion for each 8 aim are presented in separate, consecutive sections.
II. MODES FOR FOUR SPEAKERS
The initial goal of this part of the study was to develop a method for extracting a midsagittal representation of the oral portion of the vocal tract airspace from XRMB data. This method was applied to data of isolated vowels and vowel-vowel sequences produced by four speakers. The collections of midsagittal cross-distance functions were then individually subjected to a principal component analysis in order to derive mode shapes and corresponding mode coefficients for each speaker.
A. Speakers and speaking tasks
The four speakers chosen from the XRMB database are listed in Table I. Although chosen somewhat arbitrarily, these speakers were included because 1) their data contained no mistracked pellets and 2) three of the speakers (JW56, JW12, JW61) produced vowel-to-vowel sequences that were not specified in the original protocol, and thus, inadvertently generated additional information concerning the vocal tract shape that was not available in other speakers’ data.
TABLE I.
Speakers from the XRMB database chosen for this study. All were native speakers of American English.
| Speaker | Sex | Age (yrs.) | Dialect base |
|---|---|---|---|
| JW26 | F | 24 | Verona, WI |
| JW56 | F | 22.3 | Edina, MN |
| JW12 | M | 21.1 | Marinette, WI |
| JW61 | M | 20.4 | Middleton, WI |
For each speaker, the XRMB data chosen for analysis consisted of eleven vowels spoken in isolation. These were targeted to be /i ɪ e æ ʌ ɑ ɔ o ʊ u /. A series of vowel-vowel (VV) sequences was also analyzed. The XRMB protocol specified these to be /iu/, /iɑ/, /uɑ/, /ɑu/, /ɑi / and /ui/, but JW56 mistakenly produced [oɑ] in addition to the other six VVs, JW12 substituted [ue] in place of /uɑ/, and JW61 produced [iui] instead of the target /ui/. Although many other instances of vowels and VVs embedded within connected speech (i.e. words, sentences, etc.) could also be included in the present analysis, it was decided that the influence of a consonant environment should be avoided at this point to facilitate the most direct comparison to previous vowel-based analyses of area function data.
B. Cross-distance functions from XRMB data
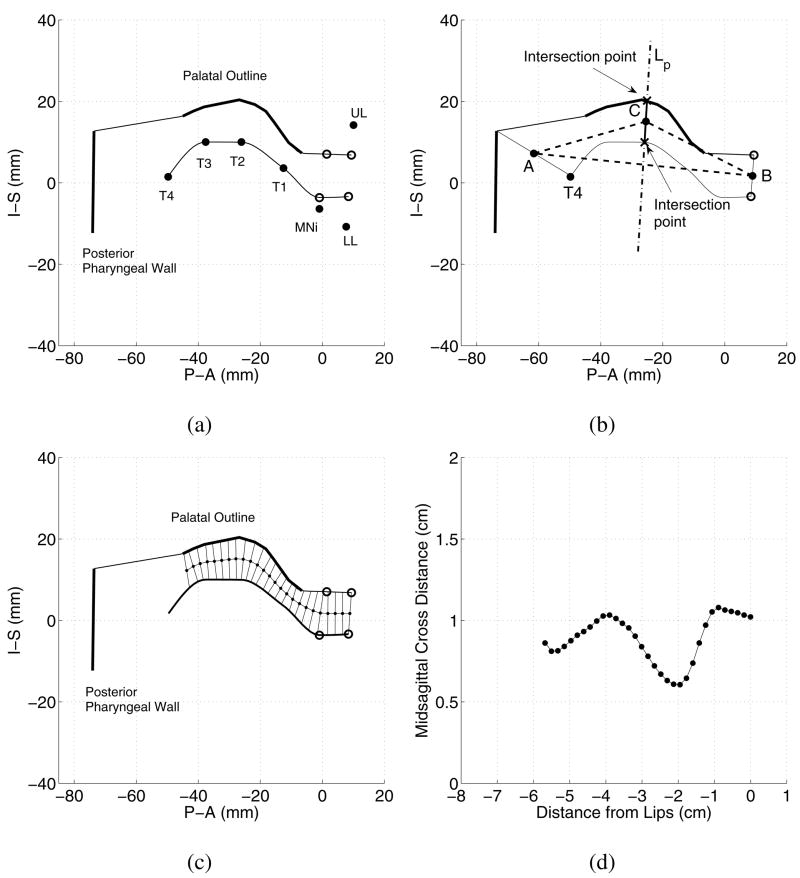
The XRMB data consist of time-dependent displacements of pellets attached to the tongue, jaw, and lips, where the sampling interval is 6.866 milliseconds. As an example, the positions of the pellets on the tongue (T1–T4), incisor (MNi), lower lip (LL), and upper lip (UL) are shown in Fig. 4a for a specific time frame representative of JW26’s [ɪ] vowel. Also shown is the palatal outline and an approximation of the posterior pharyngeal wall for this speaker2. To extract a representation of the vocal tract shape, a method was developed by which a midsagittal cross-distance function can be determined from a two-dimensional vocal tract profile for any time frame of data produced by a given speaker.
FIG. 4.
Demonstration of determining a cross-distance function from XRMB data. (a) Sagittal view of a time frame representative of JW26’s [ɪ] vowel. A superior and inferior vocal tract boundary are generated based on the tongue points (T1–T4), palatal outline, pharyngeal wall, and four “phantom” points (open circles) related to the mandible and lips. (b) Bisection method of determining initial centerline points and cross-distances. (c) Result of of multiple iterations of the bisection technique. The lines extending across the vocal tract are perpendicular to the centerline and comprise the cross-distance measurements. (d) Cross-distance function.
Although the tongue pellets (T1–T4) provide a reasonable approximation of the inferior air–tissue boundary, the placement of the mandibular (MNi) pellet at the buccal surface of the central incisor and the lip pellets on the vermillion border do not. Hence, the first step in the process was to generate four phantom pellet locations, from the actual pellet and palatal outline data, that reasonably approximated the airspace boundaries. These phantom points are shown as the open circles in Fig. 4a. The two most anterior points are determined by a correction function applied to the upper and lower lip pellet positions such that they would be brought into contact during production of bilabial consonant. The Euclidean distance between points UL and LL during the [m] of [eɯɑ] (from a VCV speaking task) was used to define a correction factor. Using the slope and y-intercept calculated from the UL and LL coordinates, the lip phantom points were found by moving downward and upward, respectively, by one-half the correction factor along a line between UL and LL. The mean of the coordinate values of the upper lip phantom point and the most anterior point on the palatal outline were used to generate the upper, posterior phantom pellet. The lower, posterior phantom point was determined by adding one half the distance measured between pellet MNi and the tip of the lower incisor to the y-component of MNi. Defining this last point was the most problematic because so little information exists in the XRMB data to describe the shape of the vocal tract between the T1 pellet and the lips. Other possibilities that were considered included using MNi without any correction factor, correcting MNi with the full distance to the tip of the lower incisor, or eliminating the influence of MNi completely. Based on visual inspection, each method appeared to capture a reasonable tract shape for some, but not all, vowels. Thus, the particular choice is a compromise that could be used for a wide range of vocal tract shapes.
The next step was to estimate the superior and inferior boundaries of the vocal tract. The inferior boundary was generated by a piecewise cubic interpolation (Fritsch and Carlson, 1980; specifically the “pchip” algorithm available in Matlab, Mathworks, 2006) fit through the four points on the tongue (T1–T4) and the two lower phantom points. In contrast to a cubic spline, this type of interpolation reduces the possibility of overshoot and oscillation, hence, the curve is prevented from assuming unnatural or impossible shapes such as passing through the hard palate. The superior vocal tract boundary was similarly generated by interpolating through all of the points comprising the palatal outline and the two superior phantom points; this boundary was also extended linearly from the most posterior palatal outline point to the superior point of the pharyngeal wall approximation. Both boundaries are shown as thin solid lines in Fig. 4a.
The final step consisted of measuring the distance from the inferior to superior boundaries at consecutive points along the centerline of vocal tract. The centerline was determined with an iterative bisection technique (e.g., Hoffman et al., 1992) that is initiated with two seed points as shown in Fig. 4b. The mid-point, B, between the two lip phantom points served as the anterior seed, while the mid-point, A, between T4 and the most superior pharyngeal wall coordinate was set to be the posterior seed. A line, AB, was then fit between the two seed points and bisected with another line, Lp, perpendicular to it. An approximate location of the intersection of Lp with the superior boundary was found by detecting the zero-crossing point of a curve formed by their difference. A more precise location of the intersection point was calculated analytically by finding the roots of a first-order polynomial where Lp and a linearized portion of the superior boundary around the approximated intersection were set equal to each other. The intersection point of Lp with the inferior boundary was determined by the same process. Next, the mid-point, C, of a line connecting the inferior and superior intersection points was determined and the Euclidean distance between these two points was calculated. This produces a new point along the vocal tract centerline and the midsagittal cross-distance at that point. The entire process is continued iteratively between each two known consecutive points within the centerline until a desired number of iterations are completed as is shown in Fig. 4c. Typically for each frame, 33 centerline points3 are calculated, however, any points located posterior to the palatal outline (including the initial posterior seed point) are eliminated because a cross-distance measurement in this region is inaccurate (i.e., there is no measured superior boundary in this region). Hence, the actual number of measured cross-distances will generally be fewer than 33; for example, in Fig. 4c, there are 25 cross-distances shown. The cross-distance measurements corresponding to the midsagittal view shown in Fig. 4c are plotted as a function of the distance from the lips4 in Fig. 4d. For purposes of applying the principal component analysis described in the next section, each “cross distance function” was resampled with a cubic spline so that it contained 33 elements separated by equal length intervals.
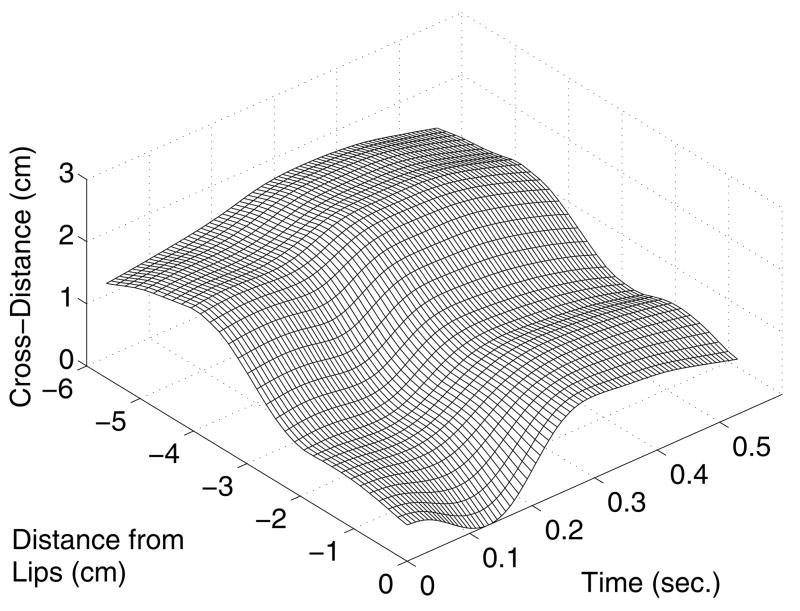
This process can be performed over a sequence of consecutive XRMB time frames which results in a time-dependent cross-distance function. Although the present study is concerned primarily with vowels, an example is shown in Figure 5 for the sequence of cross-distance functions measured for JW26’s production of [emɑ] (the VCV utterance from which the lip correction was derived). The lips are located at 0 cm on the x-axis and the variation of the cross-distance extends posteriorly about 5.5 cm. The bilabial closure for the [m] can be seen at 0.14 seconds at which point the cross-distance becomes zero at the lips.
FIG. 5.
Temporal variation of the cross-distance function measured over the course of [əmɑ] spoken by JW26. Note the bilabial closure for [m] occurs at 0.14 seconds.
C. Formant frequency analysis and frame identification
Each XRMB pellet coordinate file has an accompanying audio signal. For the files containing both the isolated vowels and VV sequences, this audio signal was read into the PRAAT (Boersma and Weenink, 2006) software system and used to identify sequences of time frames that specifi- cally corresponded to voiced vowel production (i.e., periods of time for which formant frequencies could be measured). Formant frequencies were then estimated over the course of each time-frame sequence with PRAAT’s formant analysis module, which utilizes Burg’s method (as described by Anderson, 1978). Depending on the particular speaker and vowel or VV transition, formant analysis parameters were manually adjusted so that the formant contours of F1, F2, and F3 were aligned with the centers of their respective formant bands in a simultaneously-displayed wide-band spectrogram. The window size was set so that the time interval between consecutive formant values was identical to the sampling interval of the pellet coordinates (6.866 ms). All time-dependent formant values were transferred to Matlab matrix form in order to be used in conjunction with the midsagittal cross-distance algorithm described in the previous section.
D. Modes from cross-distance functions
Modes were calculated by subjecting a given set of cross-distance functions, determined by the method described in Section II.B, to a principal component analysis similar to that described in the Introduction for vocal tract area functions. For each of the four speakers’ XRMB data, modes were calculated twice. In the first case, modes were calculated for single time frames corresponding to the mid-point of the duration of each of the eleven isolated vowels. These modes were considered to be most comparable to those reported for MRI-based area functions since they too were based on isolated vowel productions. In the second case, modes were calculated for sets of cross-distance functions corresponding to time-dependent portions (i.e., many time frames) of both isolated vowels and VV sequences. Although all of the time-frames identified as “voiced” (i.e., Section II.C) could potentially be used in a PCA, consecutive frames over which there was little acoustic change (e.g. 10–30 ms of sustained /i/ prior to a transition to an /ɑ/) would include redundant information that may bias the results. To avoid this possibility, beginning and ending portions of the formant contours for each vowel and VV transition were trimmed so that what remained were formant frequencies that varied from one frame to the next by approximately 1 Hz/ms or more. Cross-distance functions associated with these remaining time frames were included in the subsequent analysis. It is noted that, even though the vowels were produced in isolation, there were changes in the formant frequencies over time. Hence they are considered to be time-dependent as well as the VV sequences.
In either case, modes were calculated for a particular speaker by setting a collection of cross-distance vectors in matrix form as D(i, n), where i is an index that indicates a distance from the lips and n denotes a specific data frame. A speaker’s D(i, n) can be represented by a mean and variable part,
| (2) |
where Ω(i) is the mean cross-distance vector over D(i, n) and α(i, n) is the variation superimposed on Ω(i) to produce a specific cross-distance vector. The PCA was carried out by calculating the eigenvectors of a covariance matrix formed with α(i, n). This results in the following representation of the original cross-distance matrix,
| (3) |
where φk(i) are M-element (M = 33) eigenvectors (modes), and qk(n) are weighting coefficients for each mode at particular data frame n. N is the number of data frames considered in the analysis. For the vowel-only cases, N = 11, but for the time-dependent cases N = 256, 417, 311, 225 for JW26, JW56, JW12, and JW61, respectively. It is also noted that when vowels and VV sequences are both included in the PCA, qk(n) represents time-dependent mode coefficients and could be alternatively written as qk(t) where t = (n)(0.006866) seconds.
E. Mode shapes
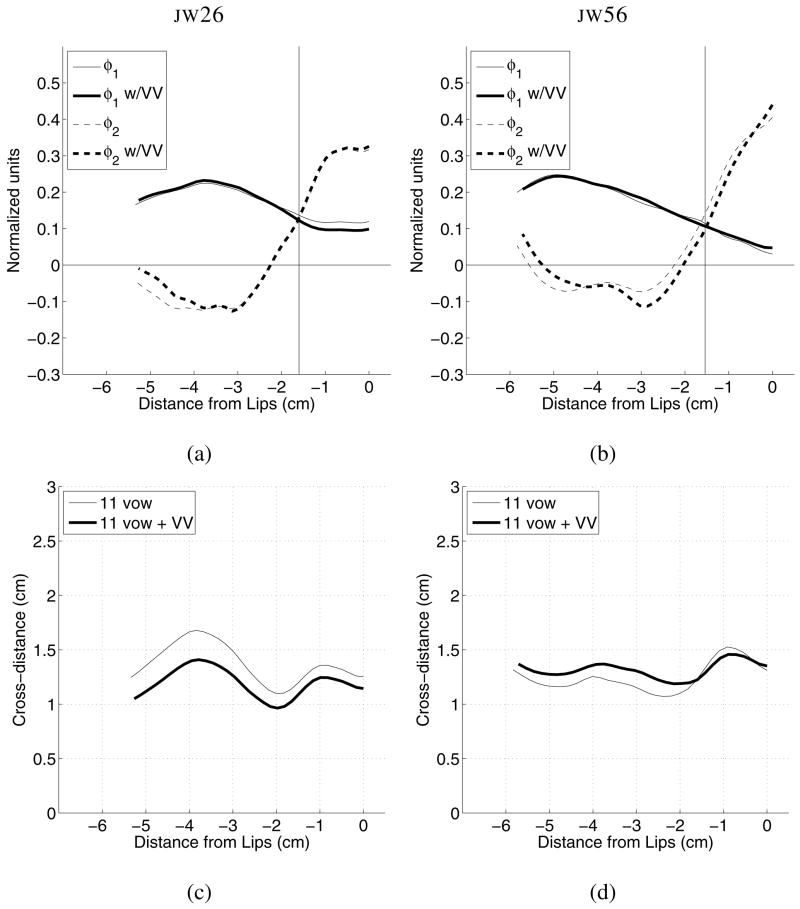
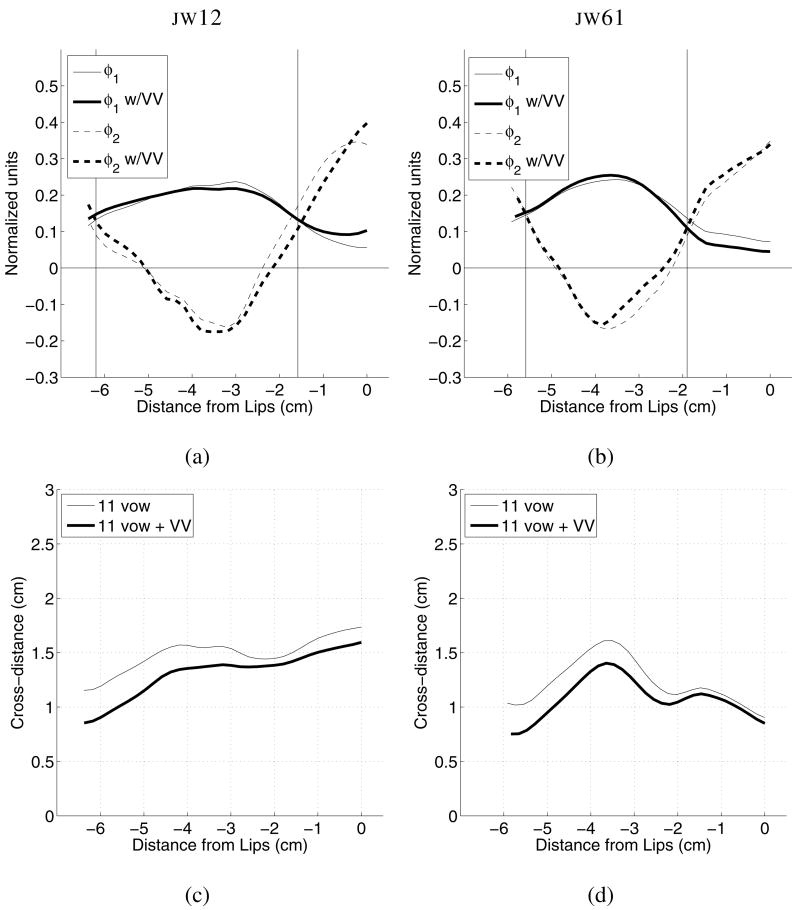
The two most significant modes calculated for each female speaker are shown in Figs. 6a and 6b, and the mean cross-distance functions are plotted in Figs. 6c and 6d. In each plot, the thin lines (solid or dashed) are based on the eleven vowel set, whereas, the thick lines are based on the time-dependent vowels and VV sequences. The modes and mean cross-distance functions for the male speakers, JW12 and JW61, are similarly shown Fig. 7. For all four speakers, there are only minor differences in the mode shapes calculated for the eleven vowel set relative to those determined from the time-dependent vowel and VV sets. For the mean cross-distance functions, the shapes are nearly the same regardless of whether they were based on the eleven vowel or time-dependent set. For three of the four speakers, the eleven vowel mean maintains a slightly larger cross-distance along the length of oral cavity. This suggests that using a large number of data frames tends to reduce the magnitude of the mean cross-distance function perhaps because more centralized vocal tract shapes are included in the PCA.
FIG. 6.
Modes, φ1 and φ2, and mean cross-distance functions, Ω, for female speakers JW26 and JW56. The vertical lines indicate points at which φ1 and φ2 intersect; these are comparable to vertical lines shown in Fig. 1a. (a) φ1 and φ2 for JW26, (b) φ1 and φ2 for JW56, (c) Ω for JW26, and (d) Ω for JW56.
FIG. 7.
Modes, φ1 and φ2, and mean cross-distance functions, Ω, for male speakers JW12 and JW61. The vertical lines indicate points at which φ1 and φ2 intersect; these are comparable to vertical lines shown in Fig. 1a. (a) φ1 and φ2 for JW12, (b) φ1 and φ2 for JW61, (c) Ω for JW12, and (d) Ω for JW61.
Although there are speaker-specific differences between the modes of the four speakers, their effect on the vocal tract shape in the oral cavity is similar. When superimposed on their respective mean cross-distance functions, all speakers’ φ1 would create an expansive effect with a positive weighting coefficient and a constrictive effect when the coefficient is negative. Also for all speakers, a positively-weighted second mode φ2 would produce an expansion near the lips, followed posteriorly by a constriction; opposite effects would be produced by a negative weighting. For all but JW26, φ2 extends far enough in the posterior direction that an additional zero-crossing is revealed which would allow for an expansive effect at distances −5 cm or more from the lips.
In Table II are the percentages of variance accounted for by each speaker’s modes. In all cases, the first mode φ1 accounted for nearly 87% or more of the total variance, whereas the second mode φ2 accounted for as much as 15.9% in JW56’s eleven-vowel set and as little as 6.9% for the eleven-vowel set of JW12. The first and second modes combined to account for 97% or more of the variance in the vocal tract cross-distance function for vowel production in all cases. In comparison to the modes calculated for area function sets in Story and Titze (1998) and Story (2005b), the variance accounted for by φ1 is about 20% higher in the present study, whereas φ2 accounts for approximately 10% percent less variance than in those studies. Mokhtari et al. (2007), however, reported that the first two modes in their study accounted for about 88% and 8.5% of the variance, respectively, which is quite similar to those in Table II. When the cross-distance functions in either the eleven-vowel static sets or the time-dependent sets are reconstructed by using only two modes in Eqn. 3 (i.e. k = [1, 2]), there are some differences relative to the original cross-distance functions. To assess the magnitude of these differences, a correlation coefficient and RMS error value were calculated for each frame of data in both the eleven vowel and time-dependent VV sets. The mean values of these two measures over all data frames are listed in Table III for each speaker. The mean correlation coefficients range from 0.92 to 0.97, whereas, the RMS error values range from 0.056 cm to 0.101 cm. Both measures indicate a reasonably good match regardless of speaker and type of data set used.
TABLE II.
Percentage of variance accounted for by each mode for four speakers. The “vowel” and “w/VV” labels indicate the PCA based on eleven vowels only and the time-dependent case including VV sequences, respectively. JW26 and JW56 are the female speakers and JW12 and JW61 are the males.
| JW26 | JW56 | JW12 | JW61 | |||||
|---|---|---|---|---|---|---|---|---|
| Mode | 11 vowel | w/VV | 11 vowel | w/VV | 11 vowel | w/VV | 11 vowel | w/VV |
| φ1 | 86.9 | 89.8 | 83.1 | 87.7 | 90.2 | 90.6 | 88.7 | 88.0 |
| φ2 | 11.9 | 8.7 | 15.9 | 10.4 | 6.9 | 7.1 | 9.4 | 9.3 |
| Total | 98.8 | 98.5 | 99.0 | 98.1 | 97.1 | 97.7 | 98.1 | 97.3 |
TABLE III.
Mean correlation coefficients (R̄) and RMS error (Ē) of the original cross-distance functions relative to those reconstructed with only two modes. The “vowel” and “w/VV” labels again indicate the PCA based on eleven vowels only and the time-dependent case including VV sequences, respectively.
| JW26 | JW56 | JW12 | JW61 | |||||
|---|---|---|---|---|---|---|---|---|
| 11 vowel | w/VV | 11 vowel | w/VV | 11 vowel | w/VV | 11 vowel | w/VV | |
| R̄ | 0.96 | 0.92 | 0.97 | 0.95 | 0.92 | 0.96 | 0.92 | 0.94 |
| Ē (cm) | 0.059 | 0.066 | 0.056 | 0.079 | 0.101 | 0.070 | 0.067 | 0.065 |
With regard to their effect on vocal tract shape in the oral cavity, the modes calculated for the four speakers are similar to those obtained from the MRI-based area functions previously shown in Fig. 1a (see also Story, 2005b; Mokhtari et al. 2007). For comparison purposes, the vertical lines in Figs. 1a, 6a, 6b, 7a, and 7b mark the points at which φ1 and φ2 intersect each other in the oral cavity. The exact locations of the intersection points will depend on the vocal tract structure and speaking habits of a speaker. But for these four cases the most anterior intersection point occurs between 1–2 cm behind the lips. The second intersection point occurs 5–6.2 cm posterior to the lips in Figs. 1a, 7a, and 7b, whereas for JW26 and JW56 φ1 and φ2 are suggestive that, if data were available at more posterior locations, they would also intersect each other like those of JW12 and JW61, perhaps between about 6–7 cm behind the lips.
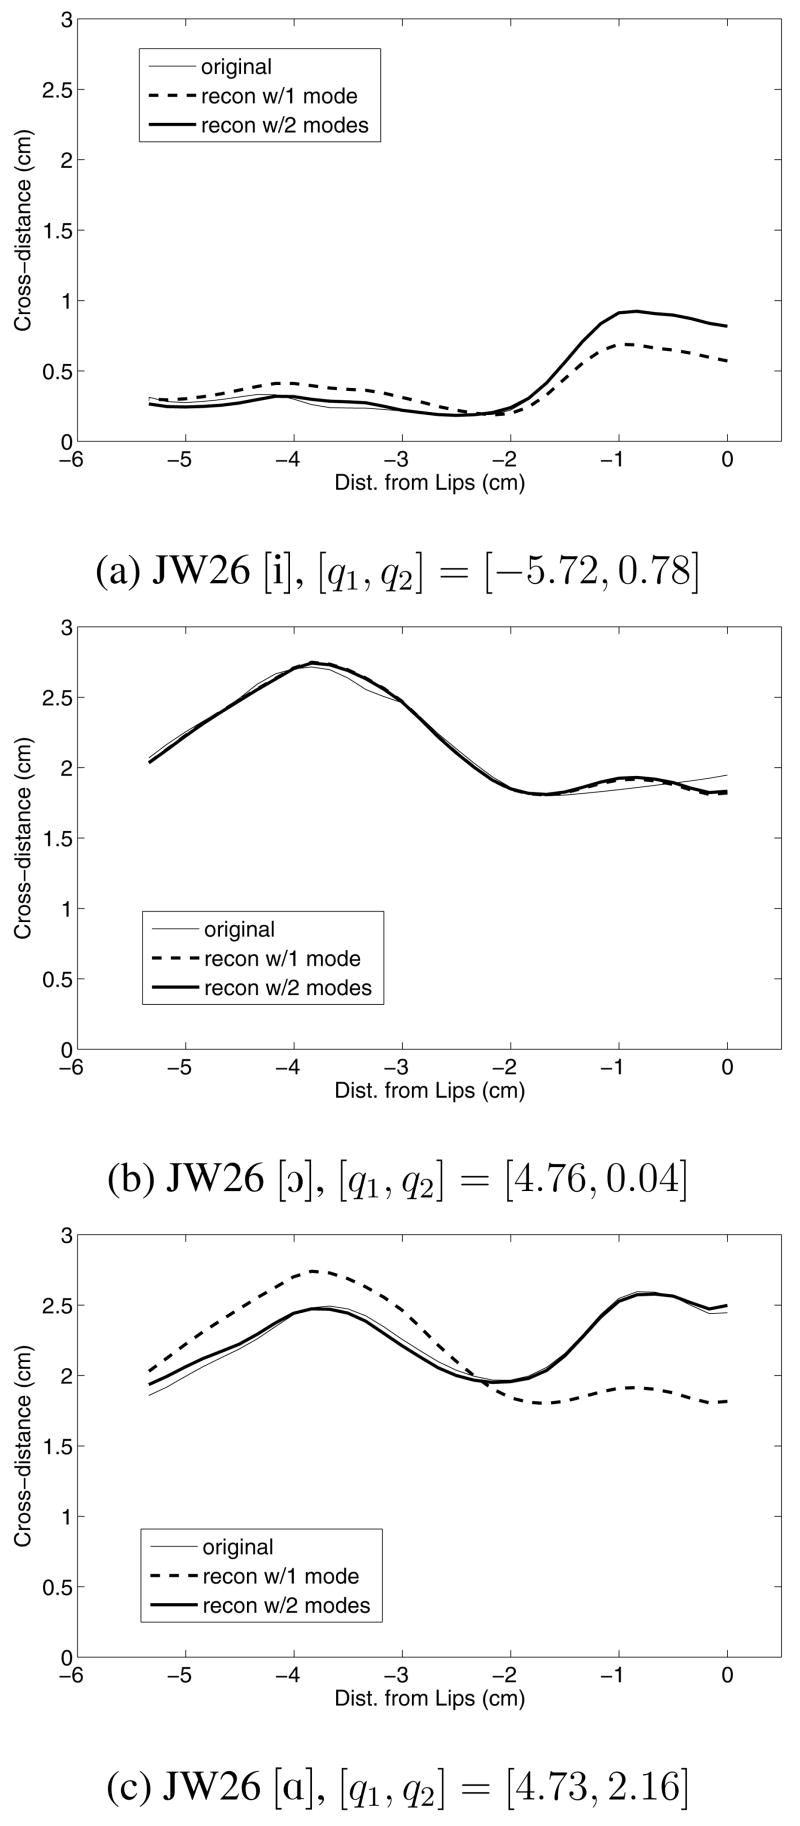
In Fig. 1a it can be observed that the most anterior positive peak in φ1 occurs about 1 cm farther from the lips than the most anterior negative peak (or valley) in φ2. A similar difference is also apparent for the modes of JW56 (Fig. 6b), but is much smaller for the other three speakers. This is consistent with Story (2005b) and Mokhtari et al. (2007) where this portion of the φ1 and φ2 modes were typically offset by less than a centimeter. It would seem that such an offset, or phase difference, would be desirable to prevent positive weightings of each mode from cancelling each other in the oral cavity. Although the mode coefficients will be discussed in more detail in subsequent sections, an example is shown in Fig. 8 of reconstructions of three of JW26’s vowels based on one and two modes, respectively (using Eqn. 3). The [i] vowel (Fig. 8a) was reconstructed with mostly the contribution of a large negative coefficient for φ1, but the small, positively valued φ2 coefficient was needed to slightly reduce the cross-distance along a portion of tract length from −2 to −5 cm and increase it near the lips. The cross-distance function for [ɔ] (Fig. 8b) is almost completely reconstructed by a contribution from only the φ1 coefficient; the difference between the one mode and two mode reconstruction is hardly visible in the plot. The [ɑ] vowel (Fig. 8c) required nearly the same value of the φ1 coefficient as for [ɔ], but additionally needed a fairly large positive value of the φ2 coefficient to reduce the cross-distance along the length from −2.5 to −5.5 cm, and increase it at the lips. These reconstructions show that, even though the φ1 and φ2 would appear to cancel each other in the palatal region (when both q1 and 2 are positive), the magnitude 16 of the coefficients are scaled so that they efficiently contribute to producing the original shape.
FIG. 8.
Reconstructions of three vowels from JW26. The q1 and q2 coefficients used to reconstruct each cross-distance function are shown below the plots. In each plot the thin solid line denotes the original cross-distance function, the dashed thick line is the reconstruction with only one mode, the thick solid line is the reconstruction with two modes. (a) vowel [i], (b) vowel [ɔ] and (c) vowel[A].
F. Mode weighting coefficients
1. Isolated vowels
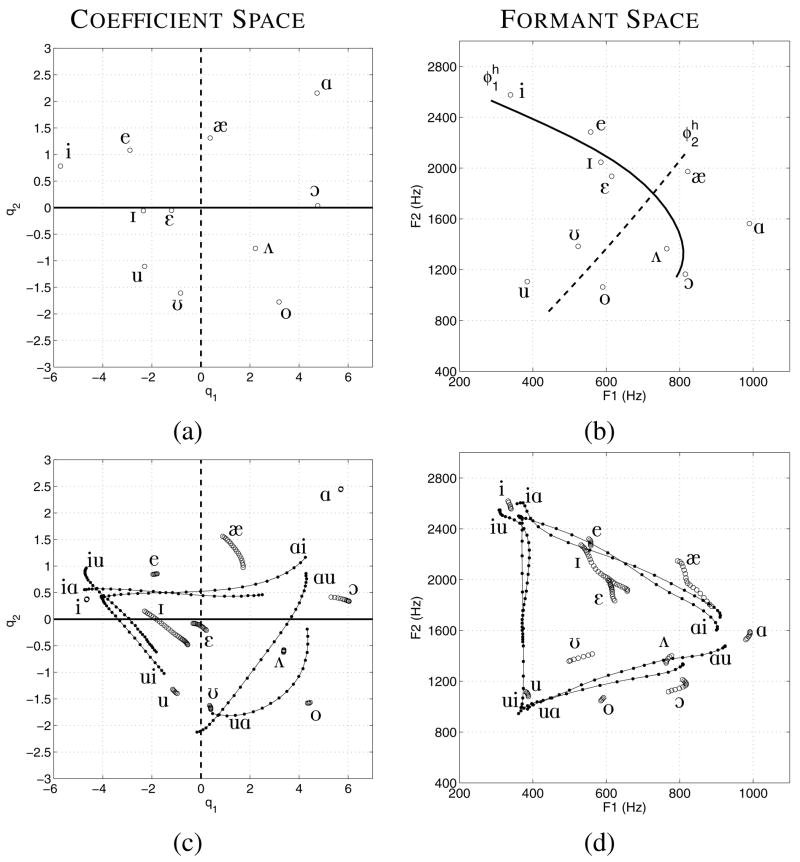
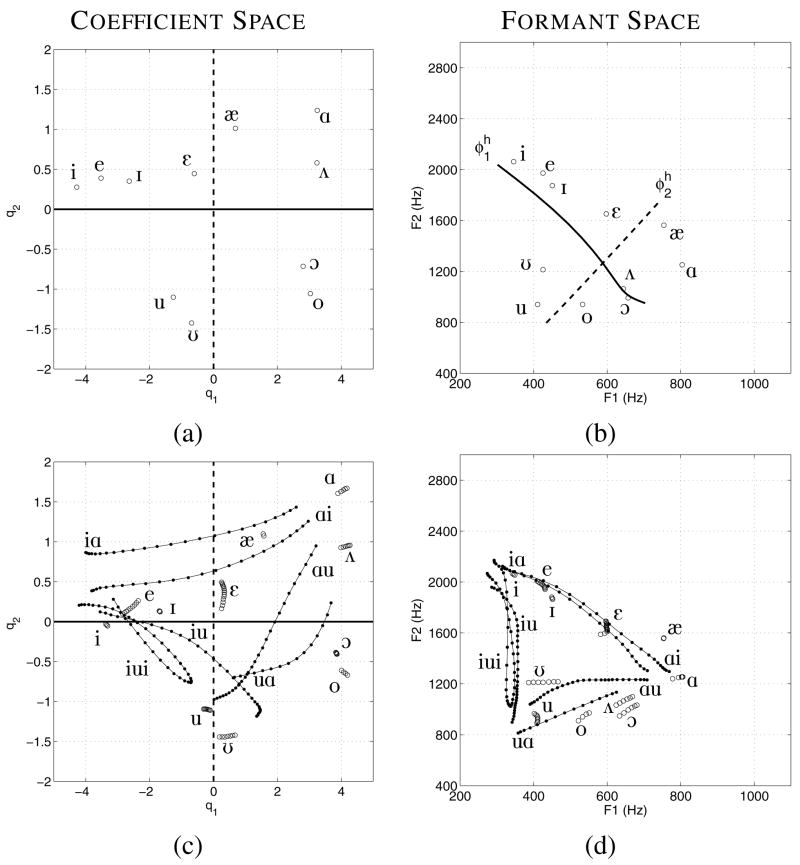
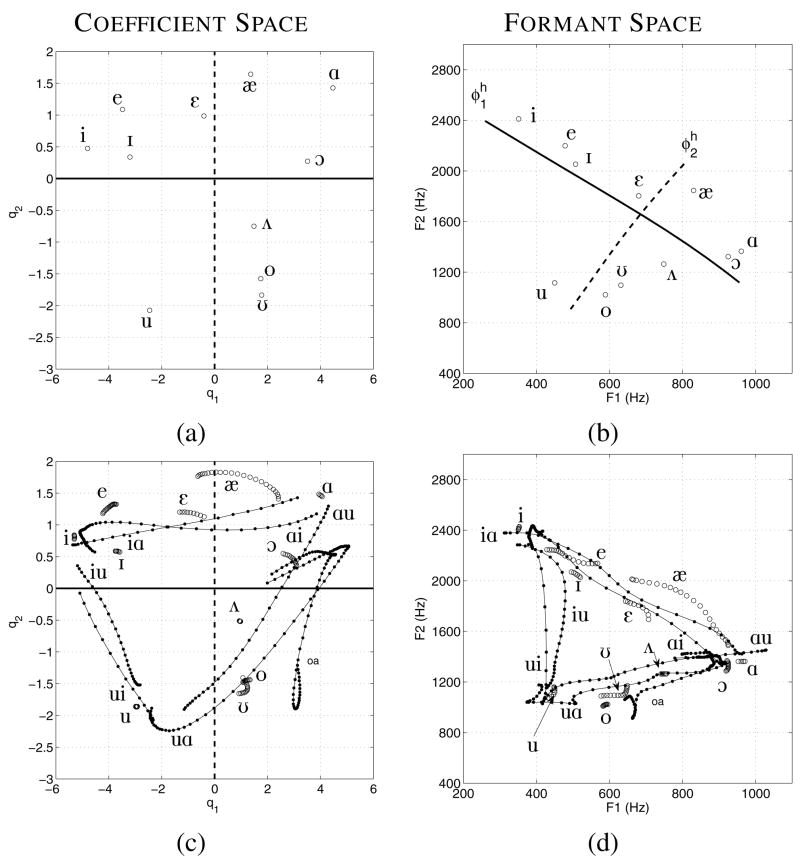
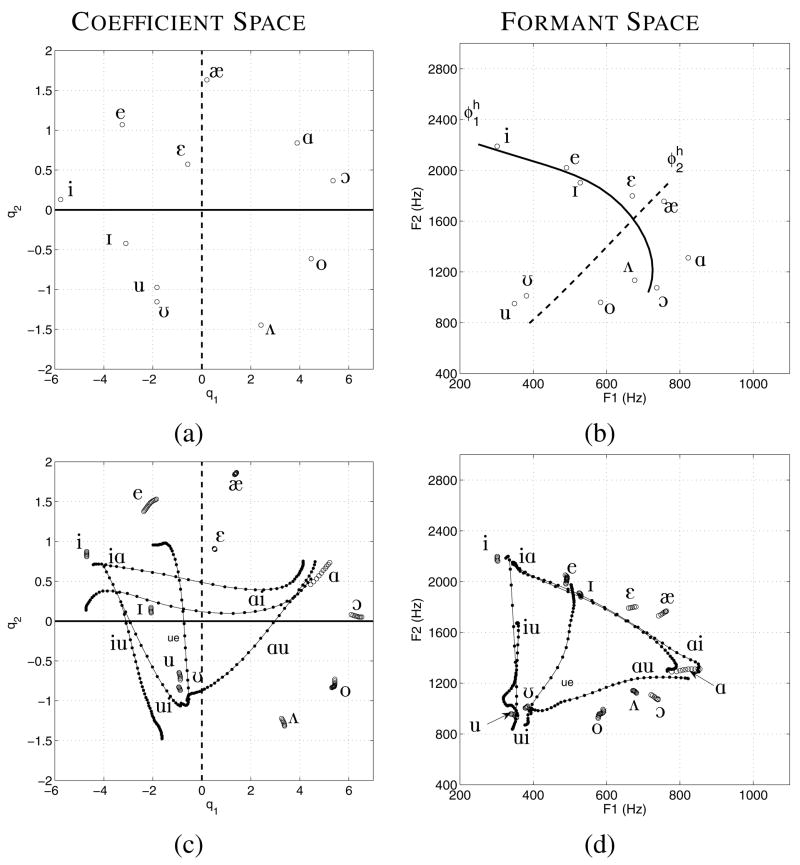
The φ1 and φ2 weighting coefficients (q1 and q2) for the static (single frame) eleven vowels of each of the four speakers are plotted against each other in Figs. 9a–12a. In each plot, the solid horizontal line and the dashed vertical line indicate the range of q1 and q2 values, respectively. The coefficients determined for each target vowel are plotted and labeled with IPA symbols. Although the location of the coefficient pairs for each vowel is speaker-dependent, there is a general structure to the coefficient space that is similar across speakers. For instance, the [q1, q2] coefficient pairs for the vowels [i] and [e] are always in the upper left quadrant (with the exception of JW26, [ε] also resides in this quadrant), [æ] and [ɑ] are in the upper right, [o] in the lower right, and [u] in the lower left. Other vowels such as [ɪ ¼ ɔ ʊ] do shift quadrant affiliations depending on the speaker.
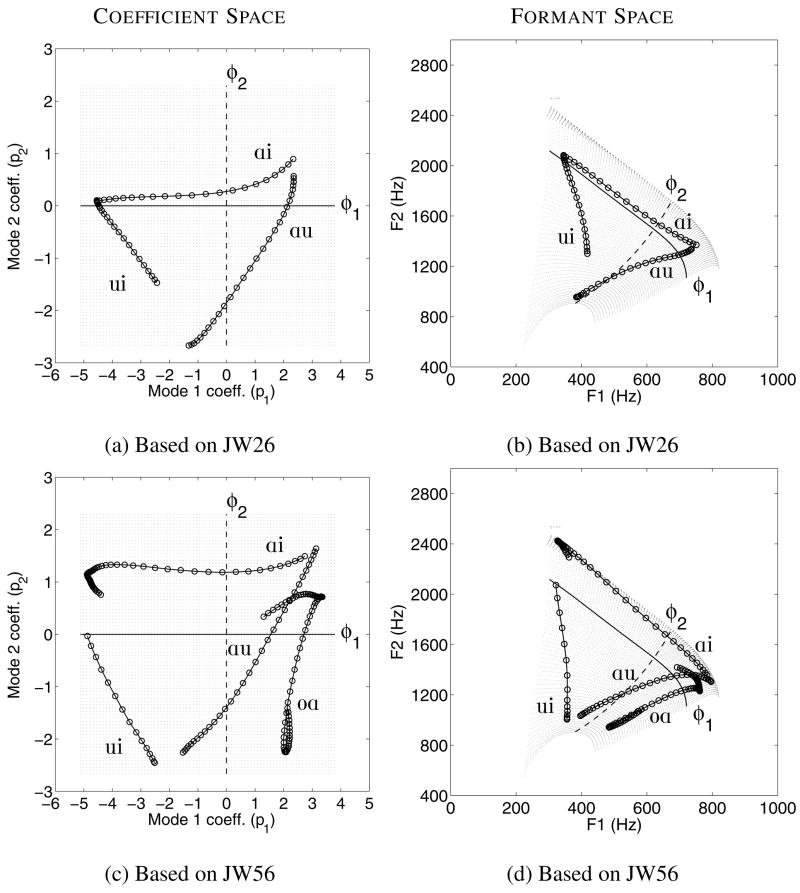
FIG. 9.
Coefficient and formant spaces for JW26 based on principal component analysis and formant frequency measurements. (a) [q1, q2] space based on single data frames of the isolated vowels, (b) [F1, F2] space for isolated vowels, (c) [q1, q2] space based on time-dependent vowels and VV sequences, and (d) [F1, F2] space corresponding to the vowels and VVs in (c). In (c) and (d) the time-dependent vowels are represented as a series of open circles whereas the VV sequences are shown with solid dots connected by lines. The IPA labels for each VV are located, when practical, near the beginning of the transition.
FIG. 12.
Coefficient and formant spaces for JW61 based on principal component analysis and formant frequency measurements. The (a), (b), (c), and (d) subplots are denoted the same as in Fig. 9.
The first and second formant frequencies that were measured for each vowel (one time frame/vowel) are plotted in Figs. 9b–12b. To be comparable to Fig. 2, the solid and dashed lines shown in each plot are hypothetical formant characteristics that may be produced by each mode in isolation (labeled and ), and would correspond to the solid and dashed lines shown in each speaker’s coefficient space (see Figs. 9a–12a). These were created manually by estimating a path through the formant space whose proximity to the vowels was similar to that in the coefficient space. For example, in Fig. 9b the line (solid) passes below [i] and [e], above [ʊ] and [ε], and then curves downward where it terminates slightly to the left of [ɔ]. The path of this line is similar to the φ1 line shown in Fig. 2b which also begins slightly below the typical location of an [i] vowel in the upper left corner, and then curves downward and away from the [ɑ] as it approaches the right side of the [F1,F2] space. The hypothetical lines for the other speakers in Figs. 10b–12b similarly pass through the formant space of the vowels, although their shape and the location of each formant pair is speaker dependent, as were the coefficient pairs. In general, as the φ1 weighting coefficient is varied from its most negative to positive values, vocal tract shapes are generated along a continuum roughly from a high front vowel like [i] to a low-mid back vowel such as [ɔ]. As Figs. 9a–12a indicate, this means that an [ɑ] vowel would be generated with contributions from both modes as discussed in Section II.E, and that a coefficient trajectory extending from [i] to [ɑ] would necessarily have an upward tilt or curvature. This result is consistent with the mapping shown in Fig. 2 as well as with the results reported by Story (2005b) where the largest positive and negative coefficients for φ1 were always affiliated with [ɔ] and [i], respectively. Accounting for a difference in the polarity of the modes, Mokhtari et al. (2007) also reported that the coefficients for [ɑ] were both large.
FIG. 10.
Coefficient and formant spaces for JW56 based on principal component analysis and formant frequency measurements. The (a), (b), (c), and (d) subplots are denoted the same as in Fig. 9.
For each speaker, the φ2 lines in the coefficient space and the hypothetical lines in the formant space suggest that the second mode influences the vocal tract shape along a continuum from a low front vowel such as [æ] on the positive weighting side, to a mid or high back vowel (e.g. [o (A u] on the negative side. It is the negative coefficients for φ2, however, that are the most variable with regard to a specific vowel affiliation. This again is consistent with the results in Story (2005b) where the largest negative coefficient for φ2 was, depending on the speaker, associated with [u], [ʊ] and [ʌ].
2. Time-dependent vowels and VV sequences
Shown in part (c) of Figs. 9–12 are the mode coefficients based on the sets of cross-distance functions containing time-varying portions of the eleven isolated vowels and the VV sequences. In each case, the axes have been set to be identical to the coefficient space in part (a) of each figure. For many of the isolated vowels, the coefficients form a short trajectory indicating a continous change in the vocal tract shape during production of the vowel5 as determined during the formant analysis. Each of these trajectories is shown as a series of open circles and is labeled with the IPA symbol appropriate for the particular vowel target. Each VV trajectory is indicated by a series of solid dots connected by a line, and IPA symbols have been placed, when practical, near the beginning of the trajectory. For example, in Fig. 9c, [ɑu] is the label for the trajectory that begins at [q1, q2] = [4, 0.8] and then extends downward and to the left. In comparison to part (a) of each figure, the coefficient trajectories for the isolated vowels are located at slightly different absolute positions within the [q1, q2] space, but their locations relative to each other are nearly the same as for the PCA of the isolated vowels based on single data frames. This result is not unexpected considering that the shape of the modes in both cases was nearly the same for all four speakers.
In part (d) of Figs. 9–12 are the formant frequency trajectories that correspond to each coefficient trajectory in part (c), and are labeled in the same manner. For example, the [F1,F2] trajectory for [ɑu] in Fig. 9d, which begins at about [930, 1470] Hz and then slopes downward and to the left before terminating at [360, 950] Hz, corresponds to the [ɑu] coefficient trajectory that was described in the previous paragraph. Comparison of the (c) and (d) parts of the figures for each speaker gives some indication of the relation that may exist between the acoustic domain and the mode coefficient domain. For all four speakers, the [iɑ], [ɑu], and [ui] formant trajectories, as well as their reverse-order counterparts [ɑi], [iu] and [uɑ], form a triangle in the [F1,F2] space. The coefficient trajectories that correspond to each leg of the formant triangles also form somewhat of triangular shape, albeit rotated and distorted. This is similar to the relation of the [F1,F2] triangle shown previously in Fig. 2b, to the curved coefficient trajectories in Fig. 2a, indicating that a similar mapping may also exist for the four speakers in the present study.
For JW26 (Fig. 9), it can be observed that both the [iɑ] and [ɑi] coefficient trajectories traverse much of the q1 range, while q2 is nearly constant at a value of around 0.5 except near the “ɑ” end of [ɑi] where q2 rises to about 1.1; note that a similar rise in q2 for an [ɑ] is also present in Fig. 2a. Above each of these trajectories are those for the [e] and [æ] vowels, and below them are [ɪ] and [ε]. Similarly, in the [F1,F2] plot (Fig. 9d), both [e] and [æ] are above [iɑ] and [ɑi] for at least part of their trajectories, whereas [ɪ] and [ε] are again below. Although these vowel trajectories appear much closer to the VVs than in the coefficient space, the mapping shown in Fig. 2 suggests that [F1,F2] pairs in this portion of the formant space would be highly compressed relative to their corresponding [q1, q2] pairs. It is also observed that the isolated [ɑ] vowel occupies a location in the upper right part of the coefficient space (Fig. 9c) that appears quite distant from the “ɑ” endpoints of the [ɑi], [iɑ], [ɑu], and [uɑ] trajectories. The location of [ɑ] in the formant space (Fig. 9d), however, is also distant from the endpoints of the VV trajectories, primarily because of a higher F1. Again referring to Fig. 2, it is noted that increasing F1 in this region of the formant space would require an increase of both the q1 and q2 coefficients, much like that observed for this speaker. The other VV sequences and vowels also, more or less, conform to the general structure of the mapping in Fig. 2. For example, [ɔ] and [o] are located to the right of the [uɑ] and [ɑu] trajectories in the coefficient space and are apparently mapped to a location below these same trajectories in the formant space due to the downward curvature of the q1 continuum when transformed to formant frequencies. In addition, the “u” endpoints of the [ɑu], [uɑ], [ui] and [iu] trajectories, as well as the [ʊ] and [u] vowels, are relatively distant in the coefficient space but are brought together by the upward curvature of [F1,F2] pairs in the lower part of the formant space (i.e., vocal tract shapes defined by distant q1 coefficients and a large negative q2 would produce formant pairs that are much closer to each other than if q2 were large and positive.)
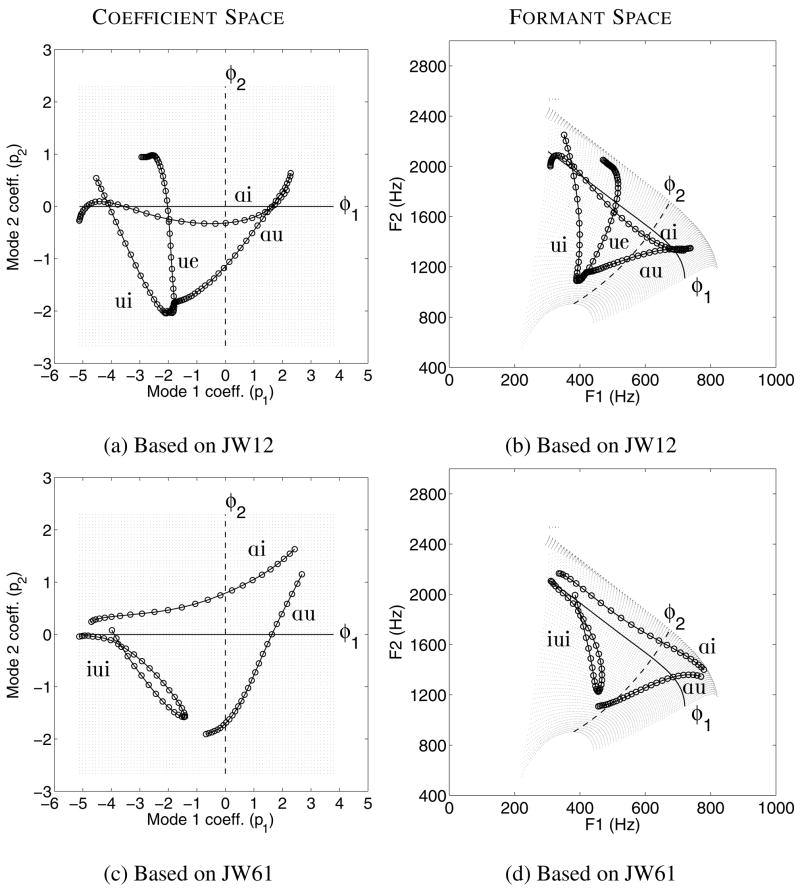
The coefficient plot for JW56 (Fig. 10c) indicates trajectories with characteristics similar to the previous speaker. That is, [iɑ] and [ɑi] primarily traverse the q1 range, [ɑu] and [uɑ] are represented along diagonals of decreasing q1 and q2 or vice versa, and [ui] and [iu] are produced along diagonals of decreasing q1 and increasing q2 or vice versa. Each of these trajectories corresponds to an [F1,F2] trajectory in Fig. 10d that is a “leg” of a triangle in the vowel space. The [q1, q2] coefficients for the [ɑ] vowel are somewhat separated from the endpoints of the nearest VV sequences, but this distance is again maintained in the formant space. The [æ] exhibits a fairly long trajectory above the [iɑ] and [ɑi] sequences which is also maintained and similarly located in the formant space. The [ε] trajectory, however, is located just above these same VV sequences in the coefficient space but appears just below them in the formant space. A unique feature of this speaker’s coefficient and formant plots is the presence of the extra [oɑ] transition. In the coefficient space, this trajectory begins at [q1, q2] = [3.1, −1.2], moves almost directly downward before changing course and moving upward to [q1, q2] = [4.5, 0.5]. The trajectory then makes a sharp turn toward the center of the plot and terminates at [q1, q2] = [2.1, 0.2]. The corresponding [F1,F2] trajectory also exhibits similar behavior when considered relative to the presumed nonlinear mapping between the coefficients and formant pairs.
For JW12 (Fig. 11), the [q1, q2] and [F1,F2] trajectories are similar to those of the other speakers, however, because this speaker is male the formant space is shifted downward and to the left. The compression of the [F1,F2] pairs corresponding to the upper part of the coefficient space is readily apparent for the [iɑ, ɑi, e, ɪ, ε, æ] trajectories. In particular, the distance between the [iɑ] and [ɑi] trajectories in the coefficient space (Fig. 11c) is almost completely eliminated in the formant space (Fig. 11d). It can also be noted that, unlike the previous two speakers, the coefficient trajectory for [ɑ] is located in close proximity to the nearest VV endpoints, and this proximity is maintained in the formant space. Unique to this speaker is the [ue] transition that begins near [q1, q2] = [−0.5, −1] and traverses upward before terminating at about [q1, q2] = [−2, 1] which is directly below the isolated vowel [e]. With the exception of the end portion, this transition consists almost entirely of an increase in q2 while q1 is nearly constant at about −1.0. The corresponding [F1,F2] trajectory moves from the “u” region of the formant space, across the middle portion, and terminates just below, and to the right of the trajectory for [e]. This is the only VV transition across all four speakers to possess these characteristics and indicates that the q2 range, extending from negative to positive values, does indeed represent a traversal across the formant space in which both F1 and F2 tend to increase (although more for F1). A seemingly anomolous result is the location of the coefficient pair representing [ʌ]. For the previous two speakers, the [ʌ] coefficients were in a more central position (i.e., small values of both q1 and q2) as would be expected for this vowel, but here they are located in a region more likely to be an [o]. In fact, based on the locations of the [F1,F2] pairs for [ʌ] and [o] (Fig. 11d), it would appear that the IPA labels for the [ʌ] and [o] coefficients were interchanged. These were, however, subsequently verified to be correct. Thus it must be concluded that either the speaker produced the [ʌ] in an unusual manner, or the two modes were not able to adequately represent the tract shape for this vowel.
FIG. 11.
Coefficient and formant spaces for JW12 based on principal component analysis and formant frequency measurements. The (a), (b), (c), and (d) subplots are denoted the same as in Fig. 9.
The coefficient and formant spaces for the final speaker, JW61 (Fig. 12), demonstrate similar overall characteristics to those of the previous three speakers, but with idiosyncratic variations. For example, this speaker produced an [iui] transition in place of the prescribed [ui] spoken by the others. This trajectory begins in the coefficient space near the [i] vowel at [q1, q2] = [−4.2, 0.2], moves downward and to the right before reversing direction at [q1, q2] = [−0.7,−0.8], and then ends at [q1, q2] = [−3.1, 0.3]. It is noted that the turn-around point in the middle of this trajectory does not extend as far into the negative q2 and positive q1 regions as the [u] and [ʊ;] vowels or the [iu], [uɑ], and [ɑu] VVs. This is also demonstrated by the [F1,F2] trajectory for [iui] (Fig. 12d) whose extent in the decreasing F1 direction is well short of the other u’s. There are some aspects of this speaker’s results that are difficult to reconcile in terms of a possible mapping as in Fig. 2. For instance, the coefficients for [æ] are located between the [iɑ] and [ɑi] trajectories, but positioned above them (upward and to the right) in the formant space. Furthermore, the [e] and [ε] trajectories are located below these same VV sequences in the coefficient space, but between them in the formant space. In contrast, the proximity of the [e] coefficient trajectory to that of the [i] is well preserved in the formant space.
In summary, the PCA based on time-dependent vowel and VV sequences produced coefficient trajectories that, with some noted exceptions, appear to be related to their corresponding formant trajectories in much the same way as the coefficient-to-formant mapping shown in Fig. 2, and those reported in Story and Titze (1998), Story (2005b), and Mokhtari et al. (2007). Without access to the area function for the entire vocal tract it is not possible to know exactly the characteristics of this mapping for the four speakers. But the results do suggest that coordination of changes to the vocal tract shape across speakers can be described by similar time-dependent, linear combinations of modes that are superimposed on a mean, or neutral, tract configuration.
III. TRANSFORMATION FROM XRMB MODE COEFFICIENTS TO A TIME-VARYING AREA FUNCTION
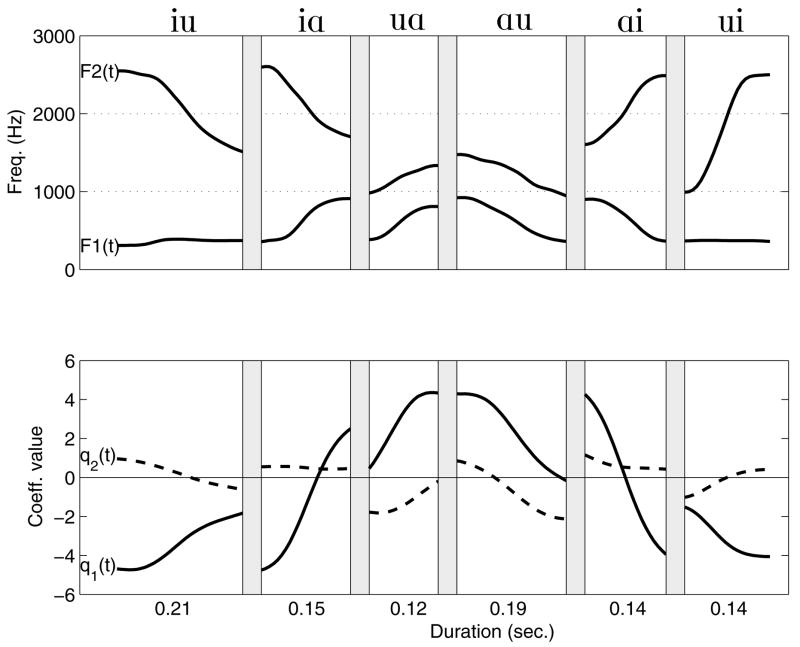
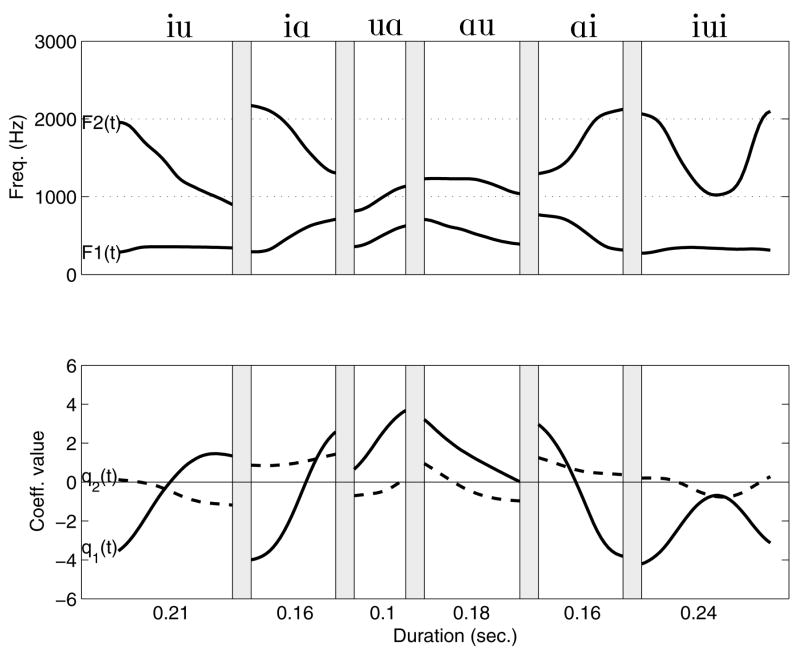
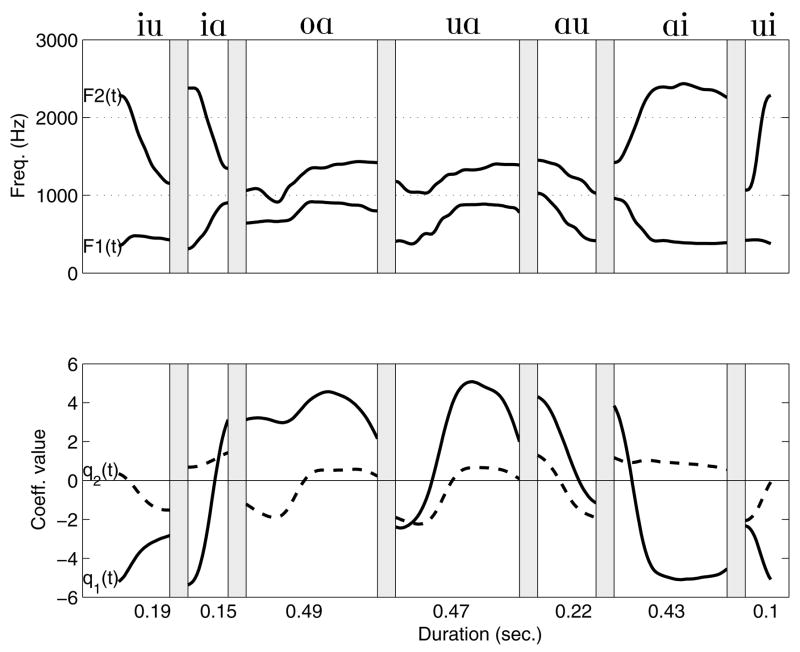
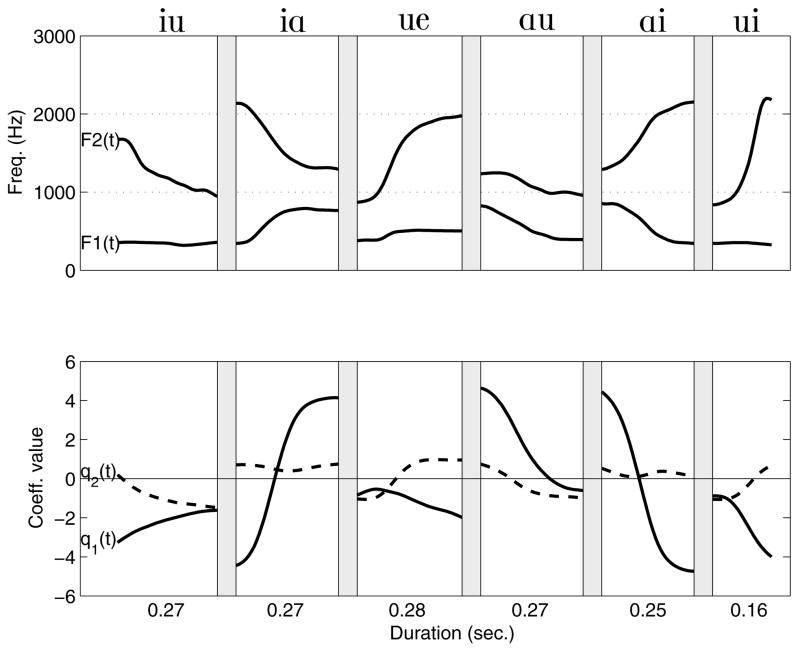
Each of the trajectories plotted previously in Figs. 9c–12c represented mode weighting coefficients for a sequence of XRMB data frames over the time course of a spoken utterance. Shown in the lower panels of Figs. 13–16 are these same trajectories for each of the four speakers, but plotted against time as coefficient contours (i.e., q1(t) and q2(t)), much like those shown in Fig. 3a for the area function-based modes. The duration of each vowel sequence is shown along the xaxis, however, the time scale is different for each speaker. In addition, the time-aligned F1 and F2 contours are plotted in the upper panels of each figure. The gray vertical bars represent periods of time where there was either silence or no change in the formant frequencies (as defined in Section II.C) and, to conserve space for plotting, have been made to be the same length regardless of their duration.
FIG. 13.
F1 and F2 formant frequencies (top), and mode coefficients (bottom) shown over the time course of six vowel sequences for JW26. The areas with white background indicate time periods where formant frequencies could be estimated from the audio signal, whereas, gray areas denote periods of silence between the production of the vowel sequences.
FIG. 16.
F1 and F2 formant frequencies (top), and mode coefficients (bottom) shown over the time course of six vowel sequences for JW61.
It is perhaps easier in these figures to observe the similarities of the coefficient contours across speakers than in the trajectories discussed in the previous section. For example, the [iu] vowel sequence is defined by a gradually decreasing q2(t) and an increasing q1(t) for all four speakers, whereas, [ui] is produced by just the opposite (for JW61 in Fig. 16, this refers to the “ui” part of the [iui]). Also, in all four cases, q1(t) increases over the time course of [iɑ] and similarly decreases during [ɑi], while q2(t) remains nearly constant or exhibits only a slight change. In Figs. 13, 14, and 16, the [uɑ] transition is characterized by a gradual increase of both the q1(t) and q2(t) coefficients, whereas, they both decrease over the course of the [ɑu] sequences. Fig. 15 would have presumably indicated the same time-dependent behavior for [uɑ] but the speaker produced [ue] instead, which is characterized by a rapid increase in q2(t) and a small, gradual decrease of q1(t).
FIG. 14.
F1 and F2 formant frequencies (top), and mode coefficients (bottom) shown over the time course of six vowel sequences for JW56.
FIG. 15.
F1 and F2 formant frequencies (top), and mode coefficients (bottom) shown over the time course of six vowel sequences for JW12.
Because the spatial patterns represented by the XRMB-based modes have been shown to be essentially the same as those derived from area function data of the entire vocal tract, the temporal variation of the mode coefficients determined for an utterance in the XRMB database, such as the vowel sequences shown in Figs. 13–16, may be expected to be the same as if they were, in fact, based on data of the entire vocal tract. This means that the pharyngeal portion of each speaker’s vocal tract would be assumed to vary in the manner as that prescribed by the whole-tract modes. Because of the similarity of the mode shapes across speakers, it can be further hypothesized that q1(t) and q2(t) describe a series of articulatory events that could be superimposed on any speaker’s vocal tract. Hence, they should be applicable as input “signals” for a mode-based, area-function model of the vocal tract, as described by Eqn (1) (Story 2005a; 2005b), regardless of the speaker on which it is based. Since each speaker’s coefficient ranges are somewhat different (e.g., Figs. 2a, 9c-12c; Story 2005a), however, a transformation must be applied to any particular set of time-varying coefficients to convert them from one speaker’s range to another.
A. Speaker-to-speaker coefficient transformation
The first step in the transformation consists of normalizing an XRMB speaker’s time-dependent coefficients, q1(t) and q2(t), by their possible range of coefficient values. The range of the coefficients can be computed for each of the two modes as,
| (4) |
where and are the maximum and minimum coefficient values for each of the two modes obtained for a particular speaker’s mode analysis (i.e., PCA of time-dependent vowels and VVs). The range can then be used to normalize the time-varying modal coefficients by,
| (5) |
for which the Nk(t) are constrained to vary from 0 to 1.0.
The next step is to convert the Nk(t) into a range of values appropriate for the speaker on which the area function model is based. To avoid confusion, the variable p will be used to denote the new (second) speaker’s coefficient values. The range of the second speaker’s mode coefficients are calculated as,
| (6) |
The transformation of the normalized time-varying coefficients to those appropriate for the area function model is carried out with the following operation,
| (7) |
The new coefficients pk(t) can now be used to generate a continuously-changing area function with a time-dependent version of Eqn. (1),
| (8) |
where x is the distance from the lips6, Ωp(x), φ1p(x), and φ2p(x) are mean diameter function, first mode, and second mode, respectively, for the area function model. The squaring operation and multiplication by π/4 are necessary to convert from equivalent diameters to areas.
B. Coefficient and formant trajectories produced by an area function model
Using Eqns. (4)–(7), the coefficient contours for the latter three vowel sequences from each of the four XRMB speakers (Figs. 13–16), and [oɑ] and [ue] from JW56 and JW12, respectively, were transformed to be appropriate for an area function model based on the modes, neutral vocal tract shape, and coefficient ranges shown previously in Figs. 1 and 2.7 The transformed coefficient trajectories are shown in Figs. 17a, 17c, 18a, and 18c. Although they appear nearly identical to the original trajectories in Figs. 9c-12c, the actual coefficient values and the ranges of the coefficients now conform to the coefficient space depicted by the grid, and the φ1 and φ2 lines shown in the background (i.e., same grid as in Fig. 2a). Thus, the trajectory shapes produced by the four speakers are preserved, but they now “fit” into a different speaker’s coefficient space.
FIG. 17.
Coefficient and formant trajectories of vowel sequences for female speakers JW26 and JW56 relative to an area function model. The coefficient trajectories are transformed versions of those in Figs. 9c and 10c (via Eqns. 4–7). The formant trajectories were calculated from area functions generated by Eqn. 9. The background grids in (a) and (c) represent the possible coefficient space based on the area function model, whereas the grids in (b) and (d) result from the coefficient-to-formant mapping. The solid and dashed lines represent the effects of each mode in isolation.
FIG. 18.
Transformed coefficient and formant trajectories of vowel sequences for male speakers JW12 and JW61 relative to an area function model. The coefficient trajectories are transformed versions of those in Figs. 11c and 12c (via Eqns. 4–7). The formant trajectories were calculated from area functions generated by Eqn. 9. Further description of the figure is the same as Fig. 17.
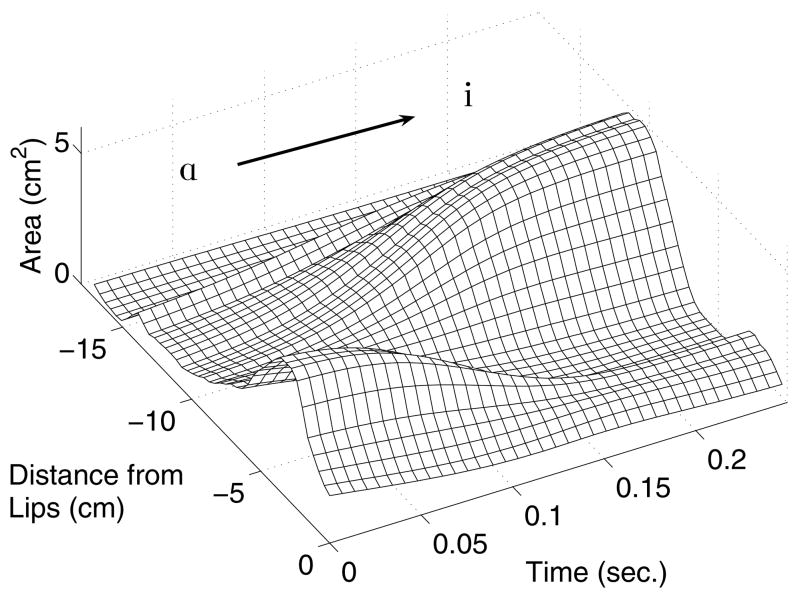
Time-varying area functions Vp(x, t) were generated for each of the vowel sequences with Eqn. (8). The implementation of this equation in the present study produced a 44-element area function at each point in time, where each element had a length of approximately 0.4 cm, and is representative of an adult male vocal tract. An example is shown in Fig. 19 for the [ɑi] of JW12 where the x-axis is shown as the distance from the lips to the glottis, the y-axis corresponds to the temporal duration for this vowel sequence in Fig. 15, and the z-axis indicates the cross-sectional area.
FIG. 19.
Time-varying area function for JW12’s [ɑi] generated with Eqn. 11.
Frequency response functions were calculated at every time sample within a vowel sequence (i.e., for Vp(x, t1), Vp(x, t2),…) with a frequency-domain algorithm based on cascaded “ABCD” matrices (Sondhi and Schroeter, 1987; Story, Laukkanen, and Titze 2000). This calculation included energy losses due to yielding walls, viscosity, heat conduction, and radiation. Formant frequencies were determined by finding the peaks in the frequency response functions. The resulting [F1,F2] trajectories for each vowel sequence are plotted in Figs. 17b, 17d, 18b, and 18d. Also shown in the background of each subplot is an [F1,F2] grid and φ1 and φ2 lines. Together these represent the mapping of the coefficient space, and the trajectories therein, into the acoustic ([F1,F2]) domain of the area function model.
As expected, in all cases the formant trajectories for [ɑu], [ɑi], and [ui] (or [iui]) trace out a triangle representative of the three target vowels contained in the sequences. It is noted that the variation in the p2 dimension during [ɑi] production is largely reduced in the formant space because this region is compressed relative to the coefficient space. Also for each speaker, the diagonal nature of the [ɑu] coefficient trajectory is preserved in the formant space, however, the curvature near the two ends of each trajectory is altered by the transformation to the acoustic domain. In contrast, the shapes of the [ui] and [iui] coefficient trajectories are fairly well preserved throughout their duration because there is less compression of the [F1,F2] pairs in this part of the formant space. The production of these vowel sequences suggests that the time-dependent coefficients extracted from XRMB data can serve as activation “signals” for an area function model of the entire vocal tract based on an arbitrary speaker.
IV. SUMMARY AND DISCUSSION
A method was described in Section II for obtaining cross-distance functions from XRMB data and deriving vocal tract modes from them. For each of the four speakers, modes were determined twice. In the first case, only eleven cross-distance functions representing the shape of target vowels were subjected to a PCA. This was done to replicate, as closely as possible, the type of analyses previously reported for MRI-based area functions. A second PCA was performed on a much larger set of cross-distance functions that represented time-dependent vocal tract shapes produced during vowels and vowel sequences. Although only the oral part of the vocal tract was represented, the mode shapes obtained for the four speakers, in both the static and time-dependent cases, exhibit similar spatial characteristics (in the oral portion) to those previously reported for area functions of the entire vocal tract. Specifically, it was found that the mode which accounts for the most variance (φ1) describes an expansion or constriction within the mid-portion of the oral cavity, depending on whether the weighting coefficient is positive or negative, respectively, but has a smaller effect on the region near the lips. The second most significant mode (φ2) is positively valued near the lips, then becomes negative in the mid-portion of the oral cavity. When multiplied by a positive weighting coefficient, this mode would simultaneously create an expansion at the lips and a constriction within the oral cavity, whereas a negative weighting would produce opposite spatial effects. Based on the coefficient and formant spaces shown in Figs. 9–12, the isolated effect of each mode roughly corresponds to continua from [i] to [ɔ] for φ1 and from [ʊ, o, u] to [æ] for φ2. Other analyses of sets of area functions have produced similar results. In Story (2005b), the largest negative coefficient for φ1 was associated with the vowel [i] for each of six speakers, whereas, the largest positive coefficient was associated with [ɔ]. This presumably occurs because the shape of φ1 creates an expansion or constriction within the oral cavity, but not at the lips. In contrast, production of an [ɑ] vowel may need a wider opening at the lips and, hence, would require at least some contribution of a positively weighted φ2. Mokhtari et al.’s (2007) analysis of Japanese vowels also indicated that an [ɑ] vowel would require contributions of both components.
Although factor analysis and principal components analysis of tongue shape only (e.g. Harshman et al. 1977; Nix et al. 1996; Hoole 1999) have produced shaping patterns that are somewhat similar to those of the present study as well as to those based on area function sets, they cannot be directly compared because they only account for configuration of the tongue, rather than the shape of the airspace extending from the lips to some posterior location (i.e., soft palate for the present study and to the glottis for area functions). In Harshman et al. (1977) the first factor was associated with an [i] to [o] continuum, whereas, the second factor indicated a change from [ɑ] to [u]. This is different from the effect of the modes shapes derived in the present study and from PCA of area functions. A careful examination of Fig. 7 in Harshman et al. (1977), however, suggests that the coefficient space they derived is rotated by about 45 degrees with respect those shown in Figs. 9–12 of this study. Perhaps the use of a representation of the vocal tract shape, rather than tongue configuration, has the effect of shifting the mode coefficients in a systematic way. In any case, the mode shapes presented in the present study can be considered vocal tract shaping patterns that have a systematic relation to the [F1,F2] space.
A natural consequence of performing the PCA on a data set containing time-dependent crossdistance functions is that the mode weighting coefficients are also time-dependent, and effectively parameterize the variation of the tract shape over consecutive time frames throughout a series of spoken vowels and vowel sequences. Plots of the resulting coefficient trajectories and con- tours (Figs. 9–12 & Figs. 13–16) revealed that they continuously vary over the time course of an utterance, suggesting that the vocal tract shape can be represented by time-dependent linear combinations of two modes. Comparison of the coefficient and formant trajectories for each speaker’s time-dependent vowels and vowel sequences indicated a possible relation similar to that demonstrated in Fig. 2. That is, the trajectories in the coefficient space appear to be nonlinearly warped as they are transformed into the formant space, while a one-to-one relation between formant pairs and coefficient pairs is more or less preserved. There were some noted exceptions (e.g. [e] for JW56) that violate the notion of a one-to-one mapping but these are not unexpected considering the sparse spatial data on which the cross-distance functions are based. It also possible that a speaker could modify some aspect of the pharyngeal cavity to affect formant frequencies that does not conform to the hypothesized shape of the modes throughout the entire vocal tract. With only oral cavity data, the methods used in this study are insensitive to the structure of the pharynx and, hence, would not indicate any such change. Nonetheless, taken as a whole, the coefficient and formant trajectories across the four speakers do suggest a relation between them of the type shown in Fig. 2 for an area-function based mapping. Although there were idiosyncratic differences, it can be further noted that the time-dependent shape of the coefficient contours for each mode were similar across speakers during production of the vowel sequences. This suggests that, like the mode shapes themselves, the time-dependent mode coefficients are, to a degree, common across speakers. The same analysis, however, would need to be carried out for additional speakers in order to more formally assess their inter–speaker commonality.
In Section III a normalization procedure was described for transforming the coefficient trajectories of one speaker into the coefficient space of another. This transformation was used to convert the time-dependent coefficients of three vowel sequences spoken by each of the four XRMB speakers (as well as two additional sequences for JW56 and JW12), into the coefficient space appropriate for an area function model. Time-varying formant frequencies were calculated for the continuously-changing area function generated with these coefficients, along the time course of the vowel sequences. The resulting formant trajectories were shown to be reasonable representations of the vowel sequences, however, the vowel space in which they now existed was representative of the male speaker on which the area function model was based. Thus, even though XRMB data strictly capture information only about the oral cavity, time-dependent mode coefficients extracted by the methods described in this study can be used to drive a model of the entire vocal tract shape. Furthermore, the common nature of the modes essentially has a speaker-normalization effect such that coefficient contours from one speaker can be used to move the vocal tract shape of another speaker. This is effectively a speaker-to-speaker transformation; that is, the temporal patterns of articulatory movement of one speaker can be superimposed on the vocal tract structure of another.
The results of this study are intended to provide a new tool for studying the articulatory-acoustic relation in speech and to augment the previously developed formant-to-coefficient or cepstral-to-coefficient techniques discussed in the Introduction (i.e., Story and Titze, 1998; Mokhtari et al. 2007). The advantage is that the time-dependent coefficients are obtained directly from articulatory data rather than via a transformation from an acoustic domain to an articulatory domain. Thus, the temporal patterns of the mode coefficients are known to be representative of actual articulation.
There are, however, some limitations of the study. First it is noted that the time-dependence of the modes has been demonstrated only for portions of utterances where there is both continuous change in the vocal tract shape and vocal fold vibration (i.e., voicing). This was done so that the PCA would be balanced with respect to a range of vocal tract shapes corresponding to [F1,F2] pairs distributed widely over the formant space. But methods could also be developed to extract the time-dependence of the mode coefficients during periods of silence, providing a view of a speaker’s actions in preparation for an utterance as well as those that occur during its execution. This may potentially be carried out by performing a PCA on thousands of cross-distance functions from data frames over the time course of a long utterance without regard for whether voiced speech sounds are produced (i.e. silent pauses and unvoiced portions would be included). The result would provide time-dependent mode coefficients over all portions of an utterance and not just those identified with voiced segments. Whether the collection of cross-distance functions used in such a technique would be sufficiently balanced so as to not bias the PCA would need to be investigated. Alternatively, a database lookup approach could also be devised in which the results of a PCA, such as those demonstrated in the present study, are used to create a database of thousands of cross-distance functions based on incremental combinations of the mode coefficients extending throughout their respective ranges. Then a cross-distance function extracted from any time frame could be matched to the best fit in the database and the associated coefficients would be assigned to this particular frame.
Another limitation is that all of the methods and results were based on vowels and vowellike utterances. Including consonants will require deriving additional modes that represent a wide range of vocal tract occlusions (or near occlusions), or developing a technique similar to that proposed by Story (2005a) where consonants are considered to be constrictions superimposed on an underlying vowel substrate. Also limiting is that there does not yet exist a set of MRI-based area functions and XRMB data from the same speaker. Such information could be used to further verify the results of this study.
V. CONCLUSION
In conclusion, the results show that statistically-derived modes are commonly shaped across speakers, as are their weighting coefficients for vowels and time-dependent vowel sequences. Because these results were based on articulatory data, this means that linear combinations of the modes can provide a reasonably accurate description of the vocal tract shape over time. As with any statistical method that reduces the dimensionality of a data set, the interpretation of the resulting dimensions must be based on their observed function. In the present study, it is clear that, in isolation, the first vocal tract mode φ1 is related to moving F1 and F2 in opposite directions, whereas, the second mode φ2 moves F1 and F2 in the same direction. When combined, the two modes can apparently position the two formants over a wide range of the possible [F1,F2] vowel space. Whether the concept of modes is directly related to the planning and control of speech production cannot be answered by these results. But, they do describe an efficient system for deforming the vocal tract shape that directly affects the first two formant frequencies in a systematic manner, and allows for time-varying mode coefficients to be extracted from the data of one speaker and applied to an area function model of another.
Acknowledgments
This research was supported by NIH grant number R01-DC04789. A preliminary version of this work was presented at the 2006 Conference on Motor Speech in Austin, TX. The author would like to thank two anonymous reviewers for their thorough critiques of earlier versions of this paper. Anubhav Swami is acknowledged for assistance on an early version of the iterative bisection algorithm.
Footnotes
By analogy to the natural orthogonal modes of a dynamical system, Story and Titze (1998) referred to the principal components as “orthogonal modes.”
According to Westbury (1994), the outline of the hard palate for a given speaker was determined from measurement of a dental cast of the oral cavity, or by recording the x-y coordinates of a tongue pellet as the speaker drew it slowly along the palatal midline. The pharyngeal wall outline was determined from the initialization scan taken prior to the acquiring x-y pellet data. It consists of only two points; the line connecting them is intended to represent the “dorsal-most surface bounding the pharynx.”
Because of the successive bisections needed for this method, the choices for the “desired” number of iterations are limited to 2n + 1 where n = [1, 2, 3, 4, 5, 6,…]. This translates to [3, 5, 9, 17, 33, 65,…] possible iterations. For this study the choice was always 33 iterations (n = 5).
Vocal tract area functions are often plotted as a function of the distance from the glottis. For the XRMB data, however, the lips are the only terminating end of the vocal tract that is available. Hence, the cross-distances for a given tract shape are plotted as a function of the distance from the lips. The negative x-axis is used so that the orientation of a crossdistance function is the same as that of an area function plotted relative to the distance from the glottis.
In the XRMB protocol, the speakers produced “citation vowels” for which they were instructed to speak slowly and clearly. Had they been produced as long, sustained vowels they may have been less likely to exhibit trajectory-like behavior.
x could also be the distance from the glottis, depending on how the area function is structured. Distance from the lips is maintained here to coincide with the midsagittal crossdistance functions. In Story (2005a) and other studies, x is assumed to be the distance from the glottis.
Modes, neutral tract shape, and coefficient ranges for any of the six speakers reported in Story (2005b) or from other studies (e.g., Mokhtari et al. 2007) could also be used to define the structure of the area function model prescribed by Eqn. (1).
References
- Anderson N. Modern Spectrum Analysis. IEEE Press; 1978. On the calculation of filter coefficients for maximum entropy spectral analysis, in Childers; pp. 252–255. [Google Scholar]
- Baer T, Gore JC, Gracco LC, Nye PW. Analysis of vocal tract shape and dimensions using magnetic resonance imaging: vowels. J Acoust Soc Am. 1991;90:799–828. doi: 10.1121/1.401949. [DOI] [PubMed] [Google Scholar]
- Boersma P, Weenink D. PRAAT, Version 4.4.07. 2006 www.praat.org.
- Bouabana S, Maeda S. Multi-pulse LPC modeling of articulatory movements. Speech Comm. 1998;24:227–248. [Google Scholar]
- Fowler CA, Saltzman EL. Coordination and coarticulation in speech production. Language and Speech. 1993;36(23):171–195. doi: 10.1177/002383099303600304. [DOI] [PubMed] [Google Scholar]
- Fritsch FN, Carlson RE. Monotone piecewise cubic interpolation. SIAM J Numerical Analysis. 1980;17:238–246. [Google Scholar]
- Harshman R, Ladefoged P, Goldstein L. Factor analysis of tongue shapes. J Acoust Soc Am. 1977;62(3):693–707. doi: 10.1121/1.381581. [DOI] [PubMed] [Google Scholar]
- Hoffman EA, Gnanaprakasam D, Gupta KB, Hoford JD, Kugelmass SD, Kulawiec RS. VIDA: An enviroment for multidimensional image display and analysis. SPIE Proc. Biomed. Image Proc. and 3-D Microscopy, 1660; San Jose, CA. 10–13 Feb.1992. [Google Scholar]
- Hoole P. On the lingual organization of the German vowel system. J Acoust Soc Am. 1999;106:1020–1032. doi: 10.1121/1.428053. [DOI] [PubMed] [Google Scholar]
- Iskarous K. Patterns of tongue movement. J Phonetics. 2005;33:363–381. [Google Scholar]
- Johnson K, Ladefoged P, Lindau M. Individual differences in vowel production. J Acoust Soc Am. 1993;94:701–714. doi: 10.1121/1.406887. [DOI] [PubMed] [Google Scholar]
- Kelso JAS, Saltzman EL, Tuller B. The dynamical perspective on speech production: Data and theory. J Phonetics. 1986;14:29–59. [Google Scholar]
- Maeda S. On articulatory and acoustic variabilities. J Phonetics. 1991;19:321–331. [Google Scholar]
- Maeda S, Honda K. From EMG to formant patterns of vowels: the implication of vowel spaces. Phonetica. 1994;51:17–29. doi: 10.1159/000261955. [DOI] [PubMed] [Google Scholar]
- The Mathworks, MATLAB, Version 7.2.0.232 (R2006a).
- Mermelstein P. Determination of the vocal-tract shape from measured formant frequencies. J Acoust Soc Am. 1967;41(5):1283–1294. doi: 10.1121/1.1910470. [DOI] [PubMed] [Google Scholar]
- Mermelstein P. Articulatory model for the study of speech production. J Acoust Soc Am. 1973;53(4):1070–1082. doi: 10.1121/1.1913427. [DOI] [PubMed] [Google Scholar]
- Mokhtari P, Kitamura T, Takemoto H, Honda K. Principal components of vocal tract area functions and inversion of vowels by linear regression of cepstrum coefficients. J Phonetics. 2007;35:20–39. [Google Scholar]
- Nix DA, Papcun G, Hogden J, Zlokarnik I. Two cross-linguistic factors underlying tongue shapes for vowels. J Acoust Soc Am. 1996;99(6):3707–3717. doi: 10.1121/1.414968. [DOI] [PubMed] [Google Scholar]
- Perrier P, Perkell J, Payan Y, Zandipour M, Guenther F, Khalighi A. Degrees of freedom of tongue movements in speech may be constrained by biomechanics. Proc of the Sixth Intl Conf on Spoken Lang Proc, ICSLP-2000. 2000;2:162–165. [Google Scholar]
- Schroeder MR. Determination of the geometry of the human vocal tract by acoustic measurements. J Acoust Soc Am. 1967;41(4):1002–1010. doi: 10.1121/1.1910429. [DOI] [PubMed] [Google Scholar]
- Shirai K, Honda M. In: Estimation of articulatory motion, in Dynamic Aspects of Speech Production. Sawashima M, Cooper F, editors. Univ. of Tokyo Press; 1977. pp. 279–302. [Google Scholar]
- Sondhi MM, Schroeter J. A hybrid time-frequency domain articulatory speech synthesizer. IEEE Trans ASSP. 1987;ASSP-35(7):955–967. [Google Scholar]
- Story BH, Titze IR, Hoffman EA. Vocal tract area functions from magnetic resonance imaging. J Acoust Soc of Am. 1996;100(1):537–554. doi: 10.1121/1.415960. [DOI] [PubMed] [Google Scholar]
- Story BH, Titze IR. Parameterization of vocal tract area functions by empirical orthogonal modes. J Phonetics. 1998;26(3):223–260. [Google Scholar]
- Story BH, Laukkanen A-M, Titze IR. Acoustic impedance of an artificially lengthened and constricted vocal tract. J Voice. 2000;14(4):455–469. doi: 10.1016/s0892-1997(00)80003-x. [DOI] [PubMed] [Google Scholar]
- Story BH, Titze IR. A preliminary study of voice quality transformation based on modifications to the neutral vocal tract area function. J Phonetics. 2002;30:485–509. [Google Scholar]
- Story BH. A parametric model of the vocal tract area function for vowel and consonant simulation. J Acoust Soc Am. 2005a;117(5):3231–3254. doi: 10.1121/1.1869752. [DOI] [PubMed] [Google Scholar]
- Story BH. Synergistic modes of vocal tract articulation for American English vowels. J Acoust Soc Am. 2005b;118(6):3834–3859. doi: 10.1121/1.2118367. [DOI] [PubMed] [Google Scholar]
- Sundberg J, Johansson C, Wilbrand H, Ytterbergh C. From sagittal distance to area. Phonetica. 1987;44:76–90. doi: 10.1159/000261782. [DOI] [PubMed] [Google Scholar]
- Westbury JR. X-ray microbeam speech production database user’s handbook. 1994. (version 1.0)(UW-Madison) [Google Scholar]
- Zheng Y, Hasegawa-Johnson M, Pizza S. Analysis of the three-dimesional tongue shape using a three-factor analysis model. J Acoust Soc Am. 2003;113(1):478–486. doi: 10.1121/1.1520538. [DOI] [PubMed] [Google Scholar]


