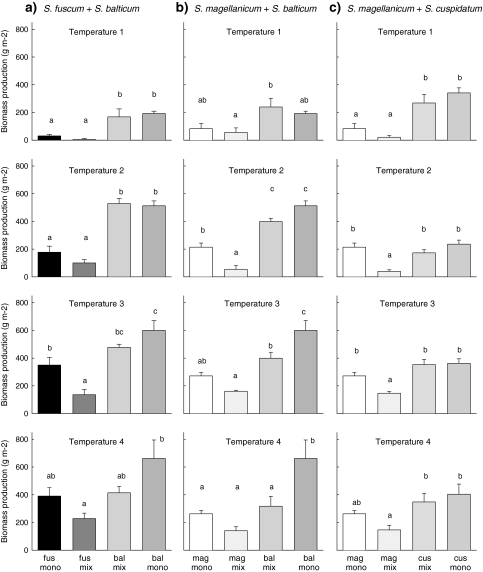
Fig. 4.
Biomass production corrected for change in cover for species in monocultures (mono) and in mixtures (mix) for each temperature treatment (see Table 1) and species combination: aS. fuscum (fus) + S. balticum (bal), bS. magellanicum (mag) + S. balticum and cS. magellanicum + S. cuspidatum (cus). Data are mean values ± SE, n = 4–5. Different letters indicate significant differences between treatments (P < 0.05)

