

Abstract
Aims
To evaluate the influence of cytochrome P450 (CYP) 3A4 inhibitors on the clinical pharmacokinetics of maraviroc, a novel CCR5 antagonist.
Methods
Four open-label, randomized, placebo-controlled studies were conducted in healthy subjects to assess the effect of separate and distinct combinations of CYP3A4 inhibitors on the steady-state pharmacokinetics of maraviroc. Study 1 was a two-way crossover study investigating the influence of saquinavir (SQV; 1200 mg t.i.d.) and ketoconazole (400 mg q.d.) on the pharmacokinetics of maraviroc (100 mg b.i.d.). All subjects received maraviroc for 7 days in both study periods. Cohort 1 subjects also received SQV or placebo and cohort 2 subjects also received ketoconazole or placebo. Study 2 was a parallel-group study including four treatment groups investigating the effects of ritonavir-boosted lopinavir (LPV/r; 400 mg/100 mg b.i.d.), ritonavir-boosted saquinavir (SQV/r; 1000 mg/100 mg b.i.d.), and low-dose ritonavir (RTV; 100 mg b.i.d.) on the steady-state pharmacokinetics of maraviroc (100 mg b.i.d.), and exploring whether maraviroc dose adjustment can compensate for interaction effects. Treatment lasted 28 days and comprised three distinct phases: (i) maraviroc alone on days 1–7; (ii) maraviroc + interactant on days 8–21; and (iii) maraviroc (adjusted dose) + interactant on days 22–28. Study 3 was a two-way crossover study investigating the effects of atazanavir (ATZ; 400 mg q.d.) and ritonavir-boosted atazanavir (ATZ/r; 300 mg/100 mg b.i.d.) on the pharmacokinetics of maraviroc (300 mg b.i.d.). All subjects received maraviroc on days 1–14 of both study periods. Subjects also received ATZ on days 1–7 and ATZ/r on days 8–14 of one treatment period, and placebo on days 1–14 of the other treatment period. Study 4 was a two-way crossover study investigating the effects of ritonavir-boosted tipranavir (TPV/r; 500 mg/200 mg b.i.d.) on the pharmacokinetics of maraviroc (150 mg b.i.d.). Subjects received maraviroc plus TPV/r or placebo on days 1–8.
Results
All of the drugs/drug combinations tested (except for TPV/r) increased maraviroc exposure, albeit to different degrees of magnitude. SQV/r caused the largest increase in maraviroc exposure (8.3-fold increase in AUCτ), whereas RTV caused the smallest increase in maraviroc exposure (2.6-fold increase in AUCτ). Downward adjustment of the maraviroc dose in study 2 during co-administration of HIV protease inhibitors was able to compensate for the interactions. TPV/r had no clinically relevant effect on maraviroc exposure at steady state. There were no treatment-related serious adverse events or discontinuations due to adverse events in any of the studies, and most adverse events were mild or moderate in severity and resolved without intervention.
Conclusions
Potent CYP3A4 inhibitors, including ketoconazole and protease inhibitors (except TPV/r), increase maraviroc exposure. Downward adjustment of the maraviroc dose during co-administration with protease inhibitors can compensate for the interaction. TPV/r does not affect the steady-state pharmacokinetics of maraviroc, and hence no dose adjustment would be warranted.
Keywords: CYP3A4, drug interactions, maraviroc, pharmacokinetics, protease inhibitors
Introduction
It is generally accepted that combination pharmacotherapy for the treatment of human immunodeficiency virus (HIV) infection is the best approach for viral load reduction and clinical success. Simultaneous targeting of multiple steps in the life cycle of HIV through the use of medications belonging to different drug classes suppresses viral replication and prevents the emergence of drug-resistant HIV more effectively than monotherapy [1, 2]. Components of highly active antiretroviral therapy (HAART) currently include nucleoside reverse transcriptase inhibitors (NRTIs), non-NRTIs, protease inhibitors (PIs) and the entry inhibitor enfuvirtide [3]. There are several drugs in development for the treatment of HIV infection that have new targets, including HIV-1 integrase and the CXCR4 and CCR5 coreceptors [4, 5], all of which mediate entry of HIV into host cells. Although these and other new drugs may play an important role in the treatment of HIV infection, it is likely that drug regimens for HIV-infected patients will continue to include a combination of medications to maximize efficacy and prevent the rapid development of resistance.
Maraviroc is a small-molecule CCR5 antagonist recently approved for the treatment of HIV infection in treatment-experienced patients infected with CCR5-tropic human HIV-1. Maraviroc has been shown to be well tolerated in healthy volunteers in dose-escalating studies [6] and has also been shown to reduce viral load effectively in HIV-infected patients as monotherapy [7] and as add-on therapy to optimized background therapy in treatment-experienced HIV-infected patients [8, 9]. Like many therapeutic drugs, maraviroc is metabolized primarily via cytochrome P450 (CYP) 3A4 and has also been shown to be a P-glycoprotein (Pgp) substrate [10, 11]. Because many PIs are also inhibitors of CYP3A4 [12] and/or Pgp [13], and because PIs are important components of HAART regimens, it is important to evaluate the effect of PIs on maraviroc pharmacokinetics.
Ritonavir (RTV) was one of the first PIs available for clinical use. Despite its effectiveness when administered at high doses without other PIs, adverse events led to discontinuation of RTV in 30% of patients [14]. Because of this poor toleration of therapeutic RTV doses and because it is a potent inhibitor of CYP enzymes, including CYP3A4 [15], lower subtherapeutic doses are now commonly used in combination with other PIs to ‘boost’ exposure of the second PI via inhibition of CYP3A4 [3, 14, 16–18]. Although RTV is also an inducer of CYP isoforms [19], its overriding effect on CYP3A4 substrates is to increase exposure.
Four clinical studies were designed to study the influence of several commonly used HIV PIs alone or in combination with RTV on the steady-state pharmacokinetics of maraviroc in healthy volunteers [lopinavir/ritonavir (LPV/r), saquinavir ± ritonavir (SQV, SQV/r), atazanavir ± ritonavir (ATZ, ATZ/r) and tipranavir + ritonavir (TPV/r)]. The effect of ketoconazole (a commonly used potent probe CYP3A4 inhibitor) on maraviroc pharmacokinetics was also evaluated. The main objectives of these studies were to investigate the influence of the PIs and ketoconazole on maraviroc exposure, and to assess the toleration and safety of these combinations of maraviroc and PIs.
Methods
Subjects
In studies 1, 2 and 3, subjects were healthy men and women aged 18–45 years (21–45 for study 3) with body weight between 60 and 100 kg (men) or 50 and 100 kg (women) and a body mass index of 18–28 kg m−2. In study 4 (TPV/r), subjects were healthy men and women aged 18–55 years with body weight >50 kg and body mass index of 18–30 kg m−2. Women participating in the studies were either surgically sterilized (tubal ligation or hysterectomy), postmenopausal, or were successfully practising specified contraception during the 3 months prior to entering the study. Subjects were excluded from all studies if they had any evidence of clinically significant disease; laboratory abnormalities; or clinically significant allergies, especially drug hypersensitivity (particularly to agents included in the studies). Other exclusion criteria included subjects who were taking or had taken any prescribed or over-the-counter medication in the 3 weeks prior to the first dose of study medication; had received any experimental drug within the previous 4 months; had evidence of drug or alcohol abuse; smoked more than five cigarettes per day; had donated blood during the previous 2 months; tested positive for HIV-1, hepatitis C virus, or hepatitis B virus; or had a history of cardiac dysrhythmias.
Subjects were excluded from study 4 if they had a QTc interval of >430 ms (men) or >450 ms (women) at the screening visit. Pregnant or lactating women were also excluded from all of these studies. All subjects provided written informed consent before participating. The studies were conducted in compliance with the declaration of Helsinki (1989) and with the local laws and regulations governing the use of new therapeutic agents.
Study designs
All four studies were open, randomized, placebo-controlled studies. Study 1 was a two-way crossover study enrolling two cohorts of 12 healthy subjects (24 in total) to investigate the influence of SQV (Fortovase®; Roche, Basel, Switzerland) and ketoconazole on the plasma pharmacokinetics of maraviroc in healthy subjects. All subjects received maraviroc 100 mg b.i.d. in both study periods. Cohort 1 subjects also received SQV 1200 mg or placebo t.i.d., and cohort 2 subjects also received ketoconazole 400 mg or placebo q.d. Subjects were dosed on days 1–9, with the final dose of maraviroc being given on the morning of day 7. Dosing of interactants continued through to day 9. Each period was separated by a minimum of 7 days. In both cohorts, subjects were fasted overnight until at least 1 h post maraviroc dose. In cohort 1, SQV/placebo were dosed 1.5 h following the morning maraviroc dose, and then at 8-h intervals thereafter. High-fat meals were provided within 30 min before each SQV dose. In cohort 2, maraviroc and ketoconazole/placebo were dosed together in the morning. Subjects were fasted until 4 h postdose on days 1 and 7. Subjects attended the study centre on up to five separate occasions: screening, two study periods, follow-up, and a visit for collection of electrocardiogram (ECG) data under a controlled exercise programme to allow for calculation of individual rate correction factors for QTc.
Study 2 was a four-treatment, four parallel-group study to investigate the effects LPV/r (Kaletra®; Abbott, Maidenhead, UK), SQV/r (Fortovase®, Roche and Norvir®, Abbott), and RTV (Norvir®; Abbott) on the steady-state plasma pharmacokinetics of maraviroc and to explore whether maraviroc dose adjustment can compensate for interaction effects. The study comprised a screening visit, a 28-day treatment period, and a follow-up visit. On days 1–7, maraviroc 100 mg b.i.d. was administered alone. On days 8–21, maraviroc 100 mg b.i.d. was administered with an interactant (SQV/r 1000/100 mg b.i.d., LPV/r 400/100 mg b.i.d., or RTV 100 mg b.i.d.) or placebo (Figure 1). On days 21–28, the maraviroc dose was adjusted based on predefined criteria to compensate for any interaction observed during days 7–21. The actual maraviroc dose received on days 22–28 was 50 mg b.i.d. for subjects receiving RTV or LPV/r, and 25 mg b.i.d. for subjects receiving SQV/r. No maraviroc dose adjustment was made for subjects receiving concomitant placebo. The final doses of study medication were administered on the morning of day 28. In total, subjects received maraviroc for 28 days and interactant or placebo for 21 days. Subjects were fasted from 2 h before maraviroc dosing until 1 h after maraviroc dosing throughout the study. As in study 1, the interactants were dosed 1.5 h after the morning maraviroc dose and were preceded by a meal. Subjects were discharged from the study centre on day 29 (at least 24 h after the last dose of study medication) at the discretion of the investigator and returned for a follow-up visit between 7 and 10 days after the final dose of study medication.
Figure 1.
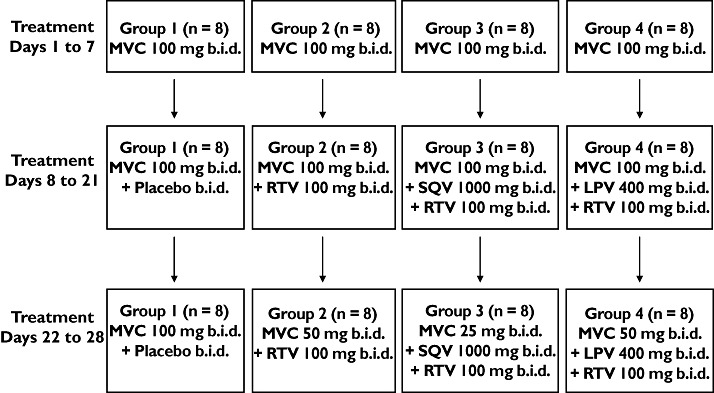
Schematic of study design (study 2). LPV, lopinavir; MVC, maraviroc; R, ritonavir; SQV, saquinavir
Study 3 was a two-period, crossover study designed to investigate the effects of ATZ (Reyataz®; Bristol-Myers Squibb, New York, NY, USA) and ATZ/r on the pharmacokinetics of maraviroc in healthy subjects. The study comprised a screening visit, two treatment periods and a follow-up visit. The treatment periods were separated by a wash-out period of at least 14 days. Subjects were randomized to receive maraviroc 300 mg b.i.d. on days 1–14 plus ATZ 400 mg q.d. on days 1–7 and ATZ/r (300 mg/100 mg) q.d. on days 8–14 of one treatment period, and maraviroc 300 mg b.i.d. plus placebo q.d. on days 1–14 of the other treatment period. The final doses of study treatments were administered on the morning of day 14. Subjects were fasted overnight until 1 h after the morning dose of maraviroc. As with previous studies, ATZ (days 1–7) or ATZ/r (days 8–14) or placebo were administered 1.5 h after the morning dose of maraviroc and were preceded by a meal. Subjects were discharged from the study centre on day 14 (at least 12 h after the last dose of maraviroc) and returned for a follow-up visit between 7 and 10 days after the final dose of study medication.
Study 4 was a two-period crossover study to investigate the effect of TPV/r (Aptivus®, supplied by Boehringer Ingelheim, Germany) on the pharmacokinetics of maraviroc in healthy subjects. Subjects received maraviroc 150 mg b.i.d. plus TPV/r (500 mg/200 mg) or placebo b.i.d. on treatment days 1–7, with a final dose on the morning of day 8. Subjects were fasted overnight, until at least 1 h post maraviroc dose on days 1–7, and 4 h post maraviroc dose on day 8. The two treatment periods were separated by a wash-out period of at least 14 days, and subjects returned to the study centre 7–10 days after the final dose of study medication for a follow-up visit.
Pharmacokinetic assessments
Blood and urine samples
In all four studies, blood (and urine for studies 3 and 4) was collected for determination of maraviroc concentrations. In study 4 only, blood samples were collected for TPV and RTV assay (day 8 only). For all studies, timing of all samples is relative to the morning dose of maraviroc for each study day. Blood samples for all studies were collected in beadless heparinized tubes; plasma was isolated by centrifugation and stored at −20 °C within 1 h of collection. Urine samples (studies 3 and 4 only) were stored at 4 °C until the end of the collection, at which time pooled samples were stored at −20 °C. In study 1, blood samples were collected pre morning dose and at intervals up to 12 h postdose on day 1, predose on days 2–6, and predose and at intervals up to 72 h postdose on day 7. In study 2, predose blood samples were collected periodically during the 28-day study period; and predose and postdose samples at intervals up to 12 h postdose were collected on days 7, 21 and 28. In addition, predose and 2-h and 4-h postdose samples were collected on day 17 to allow for dose adjustment recommendations. In study 3, blood samples were collected predose at intervals throughout the study. On days 7 and 14, further samples were collected at intervals up to 12 h postdose. Urine samples were collected in study 3 from 0 to 12 h postdose on day 7 and 14. In study 4, blood samples were collected predose on days 1–8 and at intervals up to 12 h postdose on day 8. Urine samples were collected in study 4 from 0 to 12 h postdose on day 8.
Assay details
In study 1, the overall imprecision values for the analysis of plasma quality control (QC) samples were 5.0%, 5.4% and 6.3% for maraviroc at target concentrations of 1, 90 and 180 ng ml−1, respectively. The mean inaccuracy of the assay ranged from −4.0% to 1.3% over the concentration range. In study 2, the overall imprecision values for the analysis of plasma QC samples were 5.4%, 4.0% and 4.3% for maraviroc at target concentrations of 1, 90 and 180 ng ml−1, respectively. The mean inaccuracy of the assay ranged from −4.4% to 8.7% over the concentration range. For studies 1 and 2, the calibration range for samples was 0.5–200 ng ml−1.
In study 3, the overall method imprecision values for the analysis of plasma QC samples were 10.0%, 7.1% and 6.1% at target maraviroc concentrations of 1.5, 150 and 4000 ng ml−1, respectively. The mean inaccuracy of the assay ranged from −6.7% to 1.6%. The calibration range was 0.5–500 ng ml−1. The overall method imprecision values for the analysis of urine QC samples were 5.6%, 3.2% and 2.2% at target maraviroc concentrations of 15, 1500 and 3750 ng ml−1, respectively. The mean inaccuracy of the assay ranged from −5.6% to 9.3%. The calibration range was 5–5000 ng ml−1.
In study 4, the overall method imprecision values for the analysis of plasma QC samples were 3.8%, 2.5% and 2.5% for maraviroc at target concentrations of 1.5, 150 and 400 ng ml−1, respectively, and the mean inaccuracy of the assay ranged from 1.5% to 7.3%. The calibration range was 0.5–500 ng ml−1. The overall method imprecision values for the analysis of urine QC samples were 8.1%, 3.3% and 3.6% for maraviroc at target concentrations of 15, 1500 and 3750 ng ml−1, respectively, and the mean inaccuracy of the assay ranged from −1.3% to 13.2%. The calibration range was 5–5000 ng ml−1.
Plasma samples from studies 1 and 2 were assayed for maraviroc by Maxxam Analytics Inc. (Mississauga, ON, Canada) using a previously validated liquid chromatography with tandem mass spectrometry (LC/MS/MS) method. Both plasma and urine samples from studies 3 and 4 were assayed for maraviroc by Tandem Laboratories (West Trenton, NJ, USA) using previously validated LC/MS/MS methods.
Concentrations of TPV and RTV in heparinized human plasma samples were measured at NOTOX B.V. (s-Hertogenbosch, the Netherlands) using their established bioanalytical method. The method was based on high-performance LC/MS/MS detection. Intrabatch method imprecision values ranged from 2.2% to 3.4% for TPV and from 4.7% to 9.6% for RTV. Validated calibration ranges of detection for this assay were 1000–100 000 ng ml−1 for TPV and 25–2500 ng ml−1 for RTV.
Safety assessments
Methods for assessment of safety were similar in the four studies. Information on adverse events was collected throughout the study. Adverse events were considered as potentially related to study medication for up to 7 days after the final dose of study drug. All subjects underwent a urine drug screen to test for drugs of abuse at screening and at specified times during the studies. Subjects with a positive result did not enter into or continue in the studies. Physical examinations, supine and standing blood pressure/pulse rate measurements, 12-lead ECGs, and laboratory safety tests, including haematology, clinical chemistry, and urinalysis, were conducted at appropriate intervals throughout each study.
Statistical analysis
In study 1, it was estimated that a sample size of 12 subjects in each cohort would provide 90% confidence intervals (CIs) of ±0.181 and ±0.372 on the natural log scale for area under the plasma concentration–time curve (AUC) and maximum observed plasma concentration (Cmax), respectively, with 80% coverage probability. Assuming a twofold increase in AUC and Cmax, it was estimated that the 90% CIs associated with the geometric mean ratio (GMR) would be no wider than (167%, 240%) and (138%, 290%) for AUC and Cmax, respectively. Assuming a sixfold increase in AUC and Cmax, it was estimated that the 90% CIs associated with the GMR would be no wider than (501%, 719%) and (414%, 870%) for AUC and Cmax, respectively. The standard deviations of differences (natural log scale) of 0.301 for AUC and 0.622 for Cmax were calculated using the within-subject variation [0.046 for AUC and 0.194 for Cmax (natural log scale)] from a preliminary analysis of fed vs. fasted data in a previous Phase 1 maraviroc study (data on file).
Analysis of variance (anova) was used to analyse each cohort, allowing for variation due to sequence, subject within sequence, and period and treatment to analyse natural log-transformed AUC over the interdosing interval τ (AUCτ), AUCt, AUC and Cmax and untransformed time to Cmax (Tmax), and terminal elimination half-life (t1/2). The comparisons of interest stated in the protocol were as follows: cohort 1, maraviroc and SQV vs. maraviroc and placebo (day 7); cohort 2, maraviroc and ketoconazole vs. maraviroc and placebo (day 7). The accumulation ratio for maraviroc was derived for each subject as follows for the maraviroc + placebo period only: AUCτ day 7/AUCτ day 1. The difference between days was estimated on the log scale together with the corresponding 95% CIs. This difference was back-transformed to obtain the mean accumulation ratio together with the associated 95% confidence limits.
In study 2, it was estimated that a sample size of eight subjects in each treatment group would provide 90% CIs of ±0.413 and ±0.625 on the natural log scale for AUCτ and Cmax, respectively, with 80% coverage probability. Assuming no change in AUCτ and Cmax, this relates to 90% CIs of 66.2% to 151% and 53.5% to 187% for AUCτ and Cmax, respectively. Assuming a 400% increase in AUCτ and Cmax, this relates to 90% CIs of 331% to 756% and 268% to 934% for AUCτ and Cmax, respectively. These calculations were made using estimates of variation from the results of another maraviroc study (study 1) described here.
anova was used to analyse log-transformed AUCτ and Cmax and untransformed Tmax including terms for treatment group, subject, day, and the treatment by day interaction term. Separate anova was performed for comparing day 7 with day 21, and for comparing day 7 with day 28.
In study 3, it was estimated that a sample size of 12 subjects would provide 90% CIs of ±0.216 and ±0.372 on the natural log scale for AUC from 0 to 12 h (AUC12) and Cmax, respectively, with 80% coverage probability. Assuming a 200% increase in AUC12 and Cmax, it was estimated that the 90% CIs would be (242%, 372%) and (207%, 435%) for AUC12 and Cmax, respectively. Assuming a 400% increase in AUC12 and Cmax, it was estimated that the 90% CIs would be (403%, 621%) and (345%, 725%) for AUC12 and Cmax, respectively. These calculations were made using estimates of variation from the results of another maraviroc study (study 1) described here.
Log transformed AUC12 and Cmax and untransformed Tmax were subjected to an anova appropriate for a two-period crossover study allowing for variation due to sequence, subject within sequence, period, and treatment. One anova was produced with data from day 7 of each treatment period and a second anova was produced with data from day 14 of each treatment period.
In study 4, the sample size calculation is based on n = 12 and is identical to study 3, with the addition of 90% CIs, assuming a 50% decrease in AUC12 and Cmax. Assuming a 50% decrease, it was estimated that the 90% CIs would be (40.3%, 62.1%) and (34.5%, 72.5%) for AUC12 and Cmax, respectively.
Log-transformed AUC12, Cmax and untransformed Tmax were subject to anova allowing for variation due to sequence, subject within sequence, period, and treatment. The comparison of interest was maraviroc + TPV/r (day 8) vs. maraviroc + placebo (day 8), where maraviroc + placebo was the reference treatment.
For studies 1–4, the differences between treatment means, the standard errors and 90% CIs associated with these differences were presented on the log scale for the appropriate AUC parameter and Cmax and the nominal scale for Tmax. For AUC and Cmax, the ratio between the geometric means and the 90% CI associated with this ratio were presented.
Results
Subjects
In study 1, all subjects were men, of whom 23 were White and one was Asian. They ranged in age from 18 to 43 years (mean 30.3 years) and weighed between 60 and 88 kg (mean 74.7 kg). In study 2, there were 20 men and 12 women, of whom 28 were White and four were Black. They ranged in age from 19 to 44 years (mean 30.8 years) and weighed between 50 and 92 kg (mean 69.5 kg). Demographic characteristics were comparable for all treatment groups in study 2, except all subjects were men in the maraviroc + LPV/r group. In study 3, all subjects were men, of whom one was White and 11 were Asian. They ranged in age from 21 to 43 years (mean 28.7 years) and weighed between 59 and 92 kg (mean 74.1 kg). In study 4, there were six men and six women, of whom 11 were White and one was of mixed race. Subjects ranged in age from 22 to 43 years (mean 32.7 years) and weighed between 55 and 98 kg (mean 72.7 kg). All subjects completed the treatment phase of all studies and were included in the pharmacokinetic and safety analyses.
Pharmacokinetics
Maraviroc was rapidly absorbed, with plasma Tmax generally occurring between 1.5 and 4.0 h in all studies. Visual inspection of individual maraviroc trough concentrations suggested that steady state was achieved within 8 days in all studies. Comparisons for all studies are presented as GMRs for maraviroc + interactant compared with maraviroc + placebo. In study 1, both SQV 1200 mg t.i.d. and ketoconazole 400 mg q.d. co-administration increased maraviroc (100 mg b.i.d.) exposure significantly, with GMRs of 332% and 338% for Cmax and 425% and 501% for AUCτ for SQV and ketoconazole, respectively (Table 1, Figure 2). Maraviroc Tmax and t1/2 were similar when maraviroc was administered with placebo, SQV or ketoconazole.
Table 1.
Effect of ketoconazole and saquinavir (SQV) on the pharmacokinetics of maraviroc (study 1, day 7)
| Pharmacokinetic parameter | ||||
|---|---|---|---|---|
| AUCτ* (ng ml−1 h) Mean (CV %) | Cmax* (ng ml−1) Mean (CV %) | Tmax† (h) Mean (SD) | t1/2† (h) Mean (SD) | |
| Saquinavir arm | ||||
| Maraviroc + placebo (n = 12) | 487 (33) | 131 (51) | 2.4 (0.98) | 16.1 (3.1) |
| Maraviroc + SQV (n = 12) | 2068 (36) | 434 (31) | 2.6 (0.67) | 15.7 (1.6) |
| Ratio (%)‡ or difference§ 90% confidence interval | 425 (347, 519) | 332 (245, 449) | 0.21 (−0.39, 0.81) | −0.38 (−1.8, 1.03) |
| Ketoconazole arm | ||||
| Maraviroc + placebo (n = 12) | 619 (54) | 155 (74) | 3.3 (1.2) | 17 (3.6) |
| Maraviroc + ketoconazole (n = 12) | 3096 (38) | 524 (38) | 2.9 (1.8) | 14.2 (2.8) |
| Ratio (%)‡ or difference§ 90% confidence interval | 501 (398, 629) | 338 (238, 478) | −0.33 (−0.97, 0.3) | −2.81 (−5.8, 0.19) |
Unadjusted geometric means.
Unadjusted arithmetic mean.
Ratio of adjusted means for AUCτ and Cmax.
Difference in adjusted means for Tmax and t1/2. CV, coefficient of variation; SD, standard deviation. Maraviroc was administered as 100 mg b.i.d.; SQV was administered as 1200 mg t.i.d.; ketoconazole was administered as 400 mg q.d.
Figure 2.
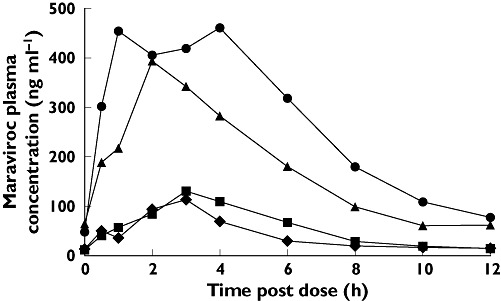
Mean plasma concentrations of maraviroc by treatment (day 7, study 1). K, ketoconazole; MVC, maraviroc; SQV, saquinavir. Day 7 MVC + Ketoconazole ( ); Day 7 MVC + Saquinavir (▴); Day 7 MVC + Placebo (K) (▪); Day 7 MVC + Placebo (SQV) (♦)
In study 2, SQV/r, LPV/r and RTV alone all increased maraviroc exposure (Table 2). SQV/r co-administration resulted in GMRs (day 21/day 7) of 423% and 832% for Cmax and AUCt, respectively (Table 3). LPV/r co-administration resulted in GMRs (day 21/day 7) of 161% and 383% for Cmax and AUCt, respectively. RTV co-administration resulted in GMRs (day 21/day 7) of 128% and 261% for Cmax and AUCt, respectively. Mean Tmax was similar across all treatment groups. Following downward adjustment of the maraviroc dose in all PI-treated groups on day 22, plasma maraviroc exposure returned by day 28 to levels comparable to those observed in the absence of PIs (Figure 3A–C), demonstrating that dose adjustment of maraviroc can compensate for the effect of interacting concomitant medications.
Table 2.
Effects of RTV, SQV/r and LPV/r on the pharmacokinetics of maraviroc (study 2)
| Pharmacokinetic parameter | ||||
|---|---|---|---|---|
| Treatment | Day | AUCτ* (ng ml−1 h) Mean (CV %) | Cmax* (ng ml−1) Mean (CV %) | Tmax† (h) Mean (SD) |
| Maraviroc + placebo | 7 | 597 (32) | 138 (30) | 2.4 (1.1) |
| 21 | 533 (35) | 191 (55) | 2.0 (0.53) | |
| 28 | 526 (41) | 194 (47) | 1.8 (0.46) | |
| Maraviroc + RTV | 7 | 547 (21) | 129 (46) | 3.0 (1.2) |
| 21 | 1280 (30) | 228 (43) | 2.8 (0.71) | |
| 28 | 439 (50) | 67.7 (84) | 2.5 (0.53) | |
| Maraviroc + SQV/r | 7 | 663 (15) | 154 (22) | 3.3 (1.7) |
| 21 | 4920 (15) | 900 (11) | 2.6 (0.52) | |
| 28 | 839 (32) | 133 (27) | 2.1 (0.64) | |
| Maraviroc + LPV/r | 7 | 499 (26) | 121 (29) | 4.0 (1.6) |
| 21 | 1700 (34) | 268 (40) | 2.9 (1.4) | |
| 28 | 695 (37) | 88.5 (43) | 2.4 (1.1) | |
Unadjusted geometric means.
Unadjusted arithmetic mean. CV, coefficient of variation; SD, standard deviation; RTV, ritonavir; SQV, saquinavir; LPV, lopinavir. Maraviroc was administered as 100 mg b.i.d. on days 1–21. On days 22–28, maraviroc was administered as 100 mg b.i.d. (+ placebo), 50 mg b.i.d. (+ LPV/r or RTV), 25 mg b.i.d. (+ SQV/r)
Table 3.
Statistical analysis of changes in maraviroc exposure (study 2)
| Treatment | Comparison | AUCτ Ratio (%) | 90% CI | Cmax Ratio (%) | 90% CI | Tmax Diff. | 90% CI |
|---|---|---|---|---|---|---|---|
| Maraviroc + RTV | Day 21 vs. day 7 | 261 | 192, 356 | 128 | 79, 209 | 0.1 | −1.1, 1.4 |
| Day 28 vs. day 21 | 91 | 65, 128 | 38 | 23, 62 | 0.1 | −1.0, 1.3 | |
| Maraviroc + SQV/r | Day 21 vs. day 7 | 832 | 611, 1130 | 423 | 260, 688 | −0.3 | −1.5, 1.0 |
| Day 28 vs. day 21 | 144 | 103, 201 | 61 | 37, 101 | −0.5 | −1.7, 0.7 | |
| Maraviroc + LPV/r | Day 21 vs. day 7 | 383 | 281, 521 | 161 | 99, 263 | −0.8 | −2.0, 0.5 |
| Day 28 vs. day 21 | 158 | 113, 222 | 53 | 32, 86 | −1.0 | −2.2, 0.2 |
CI, confidence interval; RTV, ritonavir; LPV, lopinavir; SQV, saquinavir. Maraviroc was administered as 100 mg b.i.d. on days 1–21. On days 22–28 maraviroc was administered as 100 mg b.i.d. (+ placebo), 50 mg b.i.d. (+ LPV/r or RTV), 25 mg b.i.d. (+ SQV/r).
Figure 3.
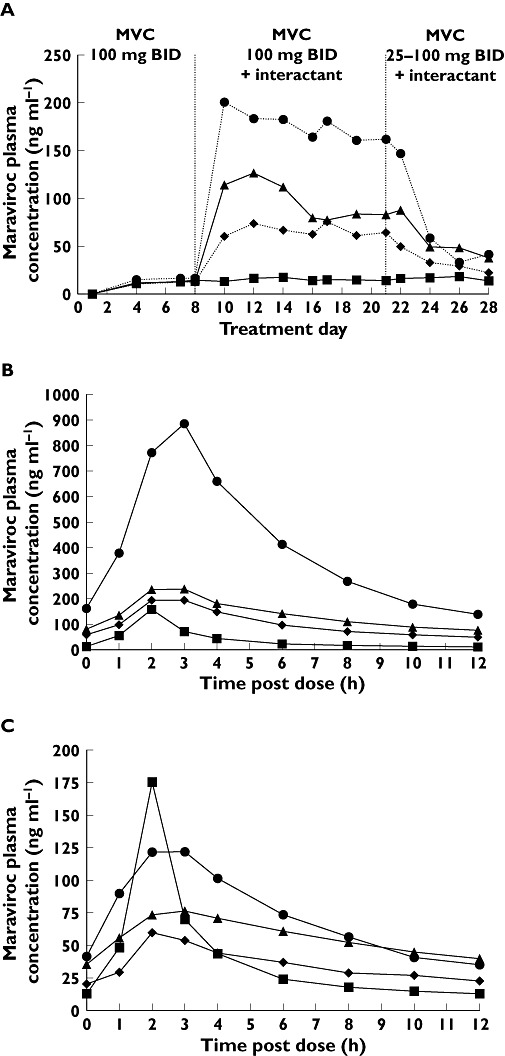
(A) Trough maraviroc plasma concentrations by treatment (study 2). (B) Mean plasma maraviroc concentrations on treatment day 21. (C) Mean plasma maraviroc concentrations on treatment day 28. LPV/r, ritonavir-boosted lopinavir; MVC, maraviroc; R, ritonavir; SQV/r, ritonavir-boosted saquinavir. MVC + Placebo (▪); MVC + LPV/r (▴); MVC + RTV (♦); MVC + SQV/r ( )
)
In study 3, ATZ co-administration with maraviroc resulted in GMRs (day 7) of 209% and 357% for Cmax and AUCτ, respectively (Table 4, Figure 4). ATZ/r (300 mg/100 mg q.d.) co-administration resulted in GMRs (day 14) of 267% and 488% for Cmax and AUCτ, respectively (Table 4, Figure 4). Maraviroc Tmax and renal clearance (CLR) were similar when co-administered with placebo, ATZ or ATZ/r (Table 4).
Table 4.
Effect of ATZ and ATZ/r on the pharmacokinetics of maraviroc (study 3)
| Pharmacokinetic parameter | |||||
|---|---|---|---|---|---|
| Treatment | Day | AUC12* (ng ml−1 h) Mean (CV %) | Cmax* (ng ml−1) Mean (CV %) | Tmax† (h) Mean (± SD) | CLR† (l h−1) Mean (± SD) |
| Maraviroc + placebo (n = 12) | 7 | 2 790 (23) | 915 (29) | 2.00 (0) | 7.7 (1.72) |
| 14 | 2 610 (24) | 914 (30) | 1.92 (0.29) | 7.63 (2.98) | |
| Maraviroc + ATZ (n = 12) | 7 | 9 970 (23) | 1910 (25) | 2.5 (0.91) | 9.66 (2.73) |
| Maraviroc + ATZ/r (n = 12) | 14 | 12 800 (22) | 2440 (22) | 2.00 (0) | 10.4 (2.54) |
| Ratio (%)‡ or difference§ | 7 | 357 | 209 | 0.5 | ND |
| 14 | 488 | 267 | 0.08 | ND | |
| 90% confidence interval | 7 | (330, 387) | (172, 255) | (0.01, 0.99) | ND |
| 14 | (440, 541) | (232, 308) | (−0.07, 0.23) | ND | |
Unadjusted geometric means.
Unadjusted arithmetic means.
Ratio for AUC12 and Cmax.
Difference for Tmax. CV, coefficient of variation; ND, not determined; SD, standard deviation; ATZ, atazanavir. Day 7 = maraviroc 300 mg b.i.d. + ATZ (400 mg q.d.) and day 14 = maraviroc 300 mg b.i.d. + ATZ/r (300 mg/100 mg q.d.).
Figure 4.
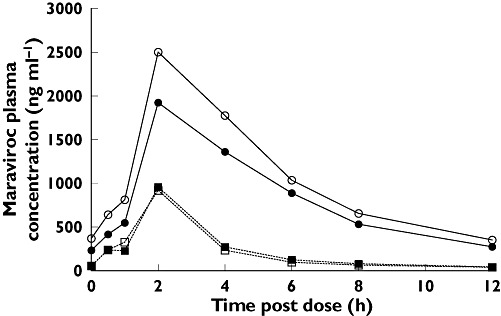
Mean plasma concentrations of maraviroc by treatment and day (study 3). ATZ, atazanavir; ATZ/r, ritonavir-boosted atazanavir; MVC, maraviroc. Day 7 MVC + ATZ ( ); Day 7 MVC + Placebo (▪); Day 14 MVC + ATZ/r (○); Day 14 MVC + Placebo (□)
In study 4, co-administration of TPV/r with maraviroc did not result in clinically significant changes in maraviroc steady-state plasma pharmacokinetic parameters (Table 5, Figure 5A). However, visual assessment of mean maraviroc trough concentrations showed an initial increase in the TPV/r-treated group on days 1–4 compared with placebo, followed by a gradual decrease (Figure 5B). These changes in trough concentrations are suggestive of an initial inhibition of maraviroc metabolism followed by a compensatory induction (postulated Pgp efflux activity). Maraviroc Tmax and CLR were similar when maraviroc was co-administered with placebo or TPV/r (Table 5).
Table 5.
Effect of TPV/r on the pharmacokinetics of maraviroc (study 4)
| Pharmacokinetic parameter | |||||
|---|---|---|---|---|---|
| Treatment | Day | AUC12* (ng ml−1 h) Mean (CV %) | Cmax* (ng ml−1) Mean (CV %) | Tmax† (h) Mean (± SD) | CLR† (l h−1) Mean (± SD) |
| Maraviroc + placebo (n = 12) | 8 | 1260 (23) | 347 (34) | 2.6 (0.9) | 8.9 (2.0) |
| Maraviroc + TPV/r (n = 12) | 8 | 1280 (24) | 298 (45) | 1.5 (0.7) | 11 (1.6) |
| Ratio (%)‡ or difference§ | 8 | 102 | 86 | −1.1 | ND |
| 90% confidence interval | 8 | (85, 123) | (61, 121) | (−1.7, −0.6) | ND |
Unadjusted geometric means.
Unadjusted arithmetic means.
Ratio for AUC12 and Cmax.
Difference for Tmax. CV, coefficient of variation; ND, not determined; SD, standard deviation; TPV, tipranavir. Maraviroc was administered as 150 mg b.i.d.; TPV/r (500 mg/200 mg b.i.d.).
Figure 5.
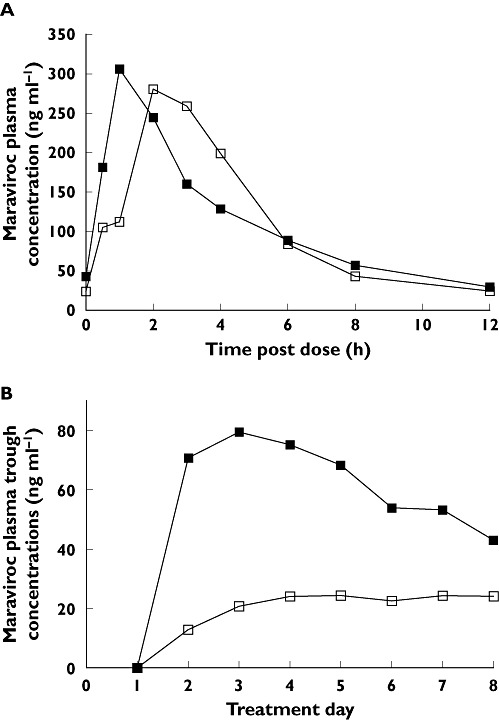
(A) Mean plasma concentrations of maraviroc by treatment and day (study 4). (B) Trough plasma concentrations of maraviroc by treatment (study 4). MVC, maraviroc; TPV/r, ritonavir-boosted tipranavir. MVC + TPV/r (▪); MVC + Placebo (□)
The geometric means for AUC12 were 376 and 6.89 ng ml−1 h and for Cmax were 59.3 and 1.79 ng ml−1 for TPV and RTV, respectively [6].
Safety and tolerability
Maraviroc and combinations of maraviroc plus other drugs were tolerated in all of the studies described here, with all but one adverse event being mild to moderate in severity. There was one case of severe postural hypotension reported in the maraviroc + ATZ treatment group on day 7 in study 3, consistent with other studies in which patients were exposed to high concentrations of maraviroc [6]. In all studies, the number of adverse events was greater following treatment with maraviroc plus interactant compared with maraviroc plus placebo. The most common treatment-related adverse events across the studies were headache, abdominal pain, diarrhoea, nausea and flatulence. There were no serious treatment-related adverse events, discontinuations due to adverse events, or laboratory test abnormalities in any of the studies.
Discussion
Because combination therapy with PIs is common in the treatment of HIV infection, it is important to investigate drug interactions with these agents and any new HIV treatment. Maraviroc is a CCR5 antagonist, representing a new class of drugs that prevent entry of CCR5-tropic HIV-1 strains into host cells. Maraviroc has been shown to be well tolerated in healthy subjects and HIV positive patients [6, 8, 9, 20].
Maraviroc is a substrate of both CYP3A4 and the transporter Pgp. Many HIV PIs are inhibitors of CYP3A4 and Pgp and have the ability to increase exposure of other drugs metabolized by CYP3A4. In addition, RTV is known to have CYP-inducing effects. Ketoconazole, an imidazole drug for the treatment of fungal infections, prevalent in HIV-infected patients, is a potent inhibitor of CYP3A4 and is also commonly used as a probe in drug interaction studies [21, 22]. Four clinical studies were conducted to investigate the influence of ketoconazole and several PI combinations on the pharmacokinetics of maraviroc in healthy volunteers. The results of these studies clearly demonstrate that co-administration of CYP3A4/Pgp inhibitors with maraviroc increases maraviroc exposure.
The PIs SQV, LPV/r, ATZ, ATZ/r and RTV caused increases in maraviroc Cmax and AUC in the range of two- to threefold and three- to fivefold, respectively. Unexpectedly, SQV/r had a greater effect on maraviroc exposure (four- and eightfold increase in Cmax and AUCτ, respectively) than would have been predicted from the results of studies with the individual agents. The mechanism of the apparent synergistic effect of SQV and RTV on maraviroc pharmacokinetics is still unclear. However, these results are in agreement with another Phase 1 study, which further investigated the effects of SQV/r on maraviroc pharmacokinetics [23]. Maraviroc dose adjustments made during days 22–28 in study 2 returned plasma maraviroc concentrations to levels comparable to those observed in the absence of PIs, suggesting that clinically effective plasma concentrations of maraviroc can be maintained with lower doses of maraviroc when co-administered in combination with PIs (except TPV/r). Such dose adjustments will be important considerations in the design/adjustment of pharmacotherapy regimens incorporating maraviroc, in order to avoid consequences of undesired CYP-based drug interactions.
TPV is a nonpeptidic PI shown to be effective against PI-resistant HIV isolates in vitro[24, 25]. Both TPV and RTV are known to be substrates, inhibitors and inducers of both CYP3A4 and Pgp [12, 26–29]. However, when given in combination, the net effect is believed to be CYP3A4 inhibition and Pgp induction [26]. When co-administered with maraviroc, these two effects appear to completely compensate for each other, leading to no change in maraviroc exposure at steady state. However, the time course of these effects may be slightly different, as assessment of the maraviroc trough concentrations suggests an initial increase in maraviroc exposure, followed by a decrease. A similar trend in maraviroc trough concentrations was observed in study 2 (Figure 3), suggesting that the inhibitory actions of the other PIs are attenuated to some degree, probably by the CYP3A4 inducing effects of RTV.
These studies have demonstrated that maraviroc exposure can be significantly altered by co-administration with HIV PIs (and other modulators of CYP3A4 activity). However, dose adjustments can readily compensate for these changes in maraviroc exposure.
Competing interests
S.A., D.R., R.J.T-W., C.E.R. and G.J.M. were employed by Pfizer Ltd at the time of this research.
These studies were sponsored by Pfizer. Study 4 was a Pfizer-sponsored study, conducted in collaboration with Boehringer Ingelheim GmbH. We thank Dr M Kraft and Dr JP Sabo for their input into the study design, and also for providing TPV (Aptivus®) and RTV (Norvir®) and the pharmacokinetic analysis of both agents. Editorial assistance was provided by Dylan Harris, PhD and Janet E. Matsuura, PhD at Complete Healthcare Communications, Inc, and was funded by Pfizer Inc., New York, NY, USA.
REFERENCES
- 1.Choo V. Combination superior to zidovudine in Delta trial. Lancet. 1995;346:895. doi: 10.1016/s0140-6736(95)92725-5. [DOI] [PubMed] [Google Scholar]
- 2.Collier AC, Coombs RW, Schoenfeld DA, Bassett RL, Timpone J, Baruch A, Jones M, Facey K, Whitacre C, McAuliffe VJ, Friedman HM, Merigan TC, Reichman RC, Hooper C, Corey L. Treatment of human immunodeficiency virus infection with saquinavir, zidovudine, and zalcitabine. AIDS Clinical Trials Group. N Engl J Med. 1996;334:1011–7. doi: 10.1056/NEJM199604183341602. [DOI] [PubMed] [Google Scholar]
- 3.Yeni PG, Hammer SM, Hirsch MS, Saag MS, Schechter M, Carpenter CC, Fishl MA, Gatell JM, Gazzard BG, Jacobsen DM, Katzenstein DA, Montaner JS, Richman DD, Schooley RT, Thompson MA, Vella S, Volberding PA. Treatment for adult HIV infection: 2004 recommendations of the International AIDS Society-USA Panel. JAMA. 2004;292:251–65. doi: 10.1001/jama.292.2.251. [DOI] [PubMed] [Google Scholar]
- 4.Rusconi S, Scozzafava A, Mastrolorenzo A, Supuran CT. New advances in HIV entry inhibitors development. Curr Drug Targets Infect Disord. 2004;4:339–55. doi: 10.2174/1568005043340498. [DOI] [PubMed] [Google Scholar]
- 5.Tremblay C. Effects of HIV-1 entry inhibitors in combination. Curr Pharm Des. 2004;10:1861–5. doi: 10.2174/1381612043384501. [DOI] [PubMed] [Google Scholar]
- 6.Abel S, van der Ryst E, Rosario MC, Ridgway CE, Medhurst CG, Taylor-Worth RJ, Muirhead GJ. Assessment of the pharmacokinetics, safety and tolerability of maraviroc, a novel CCR5 antagonist, in healthy volunteers. Br J Clin Pharmacol. 2008;65(1):5–18. doi: 10.1111/j.1365-2125.2008.03130.x. [DOI] [PMC free article] [PubMed] [Google Scholar]
- 7.Fatkenheuer G, Pozniak AL, Johnson MA, Plettenberg A, Staszewski S, Hoepelman AI, Saag MS, Goebel FD, Rockstroh JK, Dezube BJ, Jenkins TM, Medhurst C, Sullivan JF, Ridgway C, Abel S, James IT, Youle M, van der Ryst E. Efficacy of short-term monotherapy with maraviroc, a new CCR5 antagonist, in patients infected with HIV-1. Nat Med. 2005;11:1170–2. doi: 10.1038/nm1319. [DOI] [PubMed] [Google Scholar]
- 8.Lalezari J, Goodrich J, DeJesus E, Lampiris H, Gulick R, Saag M, Ridgway C, McHale M, van der Ryst E, Mayer H. Efficacy and safety of maraviroc (MVC) plus optimized background therapy (OBT) in viremic antiretroviral treatment experienced patients infected with CCR5-tropic HIV-1: 24-week results of a phase 2b/3 study in the USA and Canada. 14th Conference on Retroviruses and Opportunistic Infections; 2007 February 25–28; Los Angeles, CA. [Google Scholar]
- 9.Nelson M, Fätkenheuer G, Konourina I, Lazzarin A, Clumeck N, Horban A, Tawadrous M, Sullivan J, Mayer H, van der Ryst E. Efficacy and safety of maraviroc (MVC) plus optimized background therapy (OBT) in viremic, antiretroviral treatment experienced patients infected with CCR5-tropic (R5) HIV-1 in Europe, Australia and North America: 24-week results. 14th Conference on Retroviruses and Opportunistic Infections; 2007 February 25–28; Los Angeles, CA. [Google Scholar]
- 10.Walker DK, Abel S, Comby P, Muirhead GJ, Nedderman AN, Smith DA. Species differences in the disposition of the CCR5 antagonist, UK-427,857, a new potential treatment for HIV. Drug Metab Dispos. 2005;33:587–95. doi: 10.1124/dmd.104.002626. [DOI] [PubMed] [Google Scholar]
- 11.Hyland R, Jones B, Muirhead G. In vitro assessment of the CYP-based drug–drug interaction potential of UK-427,857. 5th International Workshop on Clinical Pharmacology of HIV Therapy; 2004 April 1–3; Rome, Italy. [Google Scholar]
- 12.Ernest CS, Hall SD, Jones DR. Mechanism-based inactivation of CYP3A by HIV protease inhibitors. J Pharmacol Exp Ther. 2005;312:583–91. doi: 10.1124/jpet.104.075416. [DOI] [PubMed] [Google Scholar]
- 13.Lin JH, Yamazaki M. Role of P-glycoprotein in pharmacokinetics: clinical implications. Clin Pharmacokinet. 2003;42:59–98. doi: 10.2165/00003088-200342010-00003. [DOI] [PubMed] [Google Scholar]
- 14.Rathbun RC, Rossi DR. Low-dose ritonavir for protease inhibitor pharmacokinetic enhancement. Ann Pharmacother. 2002;36:702–6. doi: 10.1345/aph.1A202. [DOI] [PubMed] [Google Scholar]
- 15.Eagling VA, Back DJ, Barry MG. Differential inhibition of cytochrome P450 isoforms by the protease inhibitors, ritonavir, saquinavir and indinavir. Br J Clin Pharmacol. 1997;44:190–4. doi: 10.1046/j.1365-2125.1997.00644.x. [DOI] [PMC free article] [PubMed] [Google Scholar]
- 16.Flexner C. Dual protease inhibitor therapy in HIV-infected patients: pharmacologic rationale and clinical benefits. Annu Rev Pharmacol Toxicol. 2000;40:649–74. doi: 10.1146/annurev.pharmtox.40.1.649. [DOI] [PubMed] [Google Scholar]
- 17.Moyle GJ, Back D. Principles and practice of HIV-protease inhibitor pharmacoenhancement. HIV Med. 2001;2:105–13. doi: 10.1046/j.1468-1293.2001.00063.x. [DOI] [PubMed] [Google Scholar]
- 18.van Heeswijk RP, Veldkamp A, Mulder JW, Meenhorst PL, Lange JM, Beijnen JH, Hoetelmans RM. Combination of protease inhibitors for the treatment of HIV-1-infected patients: a review of pharmacokinetics and clinical experience. Antivir Ther. 2001;6:201–29. [PubMed] [Google Scholar]
- 19.Hsu A, Granneman GR, Bertz RJ. Ritonavir. Clinical pharmacokinetics and interactions with other anti-HIV agents. Clin Pharmacokinet. 1998;35:275–91. doi: 10.2165/00003088-199835040-00002. [DOI] [PubMed] [Google Scholar]
- 20.Russell D, Bakhtyari A, Jazrawi RP, Whitlock L, Ridgway C, McHale M, Abel S. Multiple dose study to investigate the safety of UK-427 857 (100 mg or 300 mg) BID for 28 days in healthy males and females. 43rd Interscience Conference on Antimicrobial Agents and Chemotherapy; 2003 September 14–17; Chicago, IL. [Google Scholar]
- 21.Loose DS, Kan PB, Hirst MA, Marcus RA, Feldman D. Ketoconazole blocks adrenal steroidogenesis by inhibiting cytochrome P450-dependent enzymes. J Clin Invest. 1983;71:1495–9. doi: 10.1172/JCI110903. [DOI] [PMC free article] [PubMed] [Google Scholar]
- 22.Sheets JJ, Mason JI. Ketoconazole: a potent inhibitor of cytochrome P-450-dependent drug metabolism in rat liver. Drug Metab Dispos. 1984;12:603–6. [PubMed] [Google Scholar]
- 23.Abel S, Jenkins T, Whitlock LA, Ridgway CE, Muirhead GJ. Effects of CYP3A4 inducers with and without CYP3A4 inhibitors on the pharmacokinetics of maraviroc in healthy volunteers. Br J Clin Pharmacol. 2008;65(Suppl. 1):38–46. doi: 10.1111/j.1365-2125.2008.03134.x. [DOI] [PMC free article] [PubMed] [Google Scholar]
- 24.Poppe SM, Slade DE, Chong KT, Hinshaw RR, Pagano PJ, Markowitz M, Ho DD, Mo H, Gorman RR, 3rd, Dueweke TJ, Thaisrivongs S, Tarpley WG. Antiviral activity of the dihydropyrone PNU-140690, a new nonpeptidic human immunodeficiency virus protease inhibitor. Antimicrob Agents Chemother. 1997;41:1058–63. doi: 10.1128/aac.41.5.1058. [DOI] [PMC free article] [PubMed] [Google Scholar]
- 25.Larder BA, Hertogs K, Bloor S, van den Eynde CH, DeCian W, Wang Y, Freimuth WW, Tarpley G. Tipranavir inhibits broadly protease inhibitor-resistant HIV-1 clinical samples. AIDS. 2000;14:1943–8. doi: 10.1097/00002030-200009080-00009. [DOI] [PubMed] [Google Scholar]
- 26.MacGregor TR, Sabo JP, Norris SH, Johnson P, Galitz L, McCallister S. Pharmacokinetic characterization of different dose combinations of coadministered tipranavir and ritonavir in healthy volunteers. HIV Clin Trials. 2004;5:371–82. doi: 10.1310/RRX7-49ME-27V7-MWWV. [DOI] [PubMed] [Google Scholar]
- 27.Mukwaya G, MacGregor T, Hoelscher D, Heming T, Legg D, Kavanaugh K, Johnson P, Sabo JP, McCallister S. Interaction of ritonavir-boosted tipranavir with loperamide does not result in loperamide-associated neurologic side effects in healthy volunteers. Antimicrob Agents Chemother. 2005;49:4903–10. doi: 10.1128/AAC.49.12.4903-4910.2005. [DOI] [PMC free article] [PubMed] [Google Scholar]
- 28.Koudriakova T, Iatsimirskaia E, Utkin I, Gangl E, Vouros P, Storozhuk E, Orza D, Marinina J, Gerber N. Metabolism of the human immunodeficiency virus protease inhibitors indinavir and ritonavir by human intestinal microsomes and expressed cytochrome P4503A4/3A5: mechanism-based inactivation of cytochrome P4503A by ritonavir. Drug Metab Dispos. 1998;26:552–61. [PubMed] [Google Scholar]
- 29.Olson DP, Scadden DT, D'Aquila RT, De Pasquale MP. The protease inhibitor ritonavir inhibits the functional activity of the multidrug resistance related-protein 1 (MRP-1) AIDS. 2002;16:1743–7. doi: 10.1097/00002030-200209060-00005. [DOI] [PubMed] [Google Scholar]