

Abstract
Aim
To develop a novel combined viral dynamics/operational model of (ant-)agonism that describes the pharmacodynamic effects of maraviroc, a noncompetitive CCR5 inhibitor, on viral load.
Methods
A common theoretical framework based on receptor theory and the operational model of (ant-)agonism has been developed to describe the binding of maraviroc to the CCR5 receptor and the subsequent decrease in viral load. The anchor point of the operational model in the differential equations of the viral dynamic model is the infection rate constant; this is assumed to be dependent on the number of free activated receptors on each target cell.
Results
The new model provides one explanation for the apparent discrepancy between the in vivo binding of maraviroc to the CCR5 receptor (KD = 0.089 ng ml−1) and the estimated in vivo inhibition (IC50 = 8 ng ml−1) of the infection rate. The estimated KE value of the operational model indicates that only 1.2% of free activated receptors are utilized to elicit 50% of the maximum infection rate.
Conclusions
The developed model suggests that the target cells, when activated, express more receptors (spare receptors) than needed. In the presence of maraviroc these spare receptors first require blocking before any decrease in the infection rate, and consequently in the viral load at equilibrium, can be detected. The model allows the simultaneous simulation of the binding of maraviroc to the CCR5 receptor and the change in viral load after both short- and long-term treatment.
Keywords: CCR5, HIV, maraviroc, PD model, receptor theory, semimechanistic
Introduction
Maraviroc (UK-427 857), a selective and reversible CCR5 coreceptor antagonist, has been shown to be active in vitro against a wide range of clinical isolates (including those resistant to existing drug classes) [1]. In human immunodeficiency virus type 1 (HIV-1)-infected patients, maraviroc given as monotherapy for 10 days reduced HIV-1 viral load dose dependently by up to 1.6 log10 copies, consistent with currently available agents that comprise the cornerstone of highly active antiretroviral therapy (e.g. protease inhibitors, non-nucleoside reverse transcriptase inhibitors, nucleoside reverse transcriptase inhibitors) [2]. An excellent safety and tolerability profile has been demonstrated after dosing for up to 28 days at 300 mg b.i.d. [3].
A pharmacokinetic–pharmacodynamic (PK–PD) disease model has been developed previously to aid design and analyse short-term monotherapy with maraviroc in naive HIV-1-infected patients [4, 5]. The model was used to aid selection of maraviroc doses for clinical Phase 2b/3 studies [5]. The PD effect of maraviroc (on viral load reduction) was modelled empirically using an inhibitory maximum effect (Emax) equation acting on the infectivity rate of the virus in the integrated PK–PD disease model. Originally, in the absence of any in vivo data, the value of the IC50 parameter (concentration that results in 50% functional inhibition), 0.38 ng ml−1, was obtained from in vitro experiments of viral growth inhibition [4]. After in vivo data on maraviroc monotherapy in HIV-1-infected patients became available, the IC50 parameter was estimated to be about 8 ng ml−1 which best described the observed drop in viral load [5].
In parallel, data on maraviroc CCR5 receptor occupancy were also obtained in healthy volunteers and HIV-1-infected patients [6]. A PK–PD model-based analysis of the receptor occupancy data led to the estimation of the in vivo affinity of maraviroc for the CCR5 receptors of 0.089 ng ml−1 (expressed as dissociation constant KD) [6]. Simulations based on the PK–PD disease model and this KD value of the mean viral load reduction were higher than the mean measured viral load reduction, as if the receptor occupancy measurements had led to an overestimation of the true degree of CCR5 receptor occupancy in the body. Those results were interpreted to mean that measurement of ex vivo receptor occupancy would not be useful for routine monitoring as a biomarker for viral load depletion [6].
The identification of biomarkers that can both aid decision making during drug development and facilitate monitoring of therapy is an area that has received much attention over the years, especially in the field of HIV [7, 8]. A biomarker must be predictive of clinical outcome if it is to be useful. The potential link between biomarker and clinical outcome may not always be direct, in which case a model-based approach may be utilized to tease out the relationship in order to put it to use [9].
This paper describes the development of a PD model, based on receptor theory [10, 11] and the operational model of (ant-)agonism [12], in order to explain the apparent discrepancy between the affinity of maraviroc for the CCR5 receptor and its in vitro and in vivo potency, and to predict the effect of maraviroc therapy on viral load. The anchor point of the operational model in the differential equations of the viral dynamic model is the infection rate constant; this is assumed to be dependent on the number of free activated receptors on each target cell.
Methods
The paper describes the development of a model and its application to describe the mechanism of action of maraviroc and the consequential effect on viral load. The clinical data used to develop the model have been published previously [2, 5]. Approvals from local ethics committees were obtained and written informed consent was obtained from all subjects.
The analytical methods used to quantify maraviroc plasma concentrations, receptor occupancy [13] and viral load have been summarized elsewhere in this Supplement [6]. Briefly, plasma maraviroc concentrations were analysed using high-performance liquid chromatography with tandem mass spectrometry; the lower limit of quantification for maraviroc plasma concentrations was 0.5 ng ml−1 or 0.1 ng ml−1 (for the 3- and 10-mg doses). Receptor occupancy was reported as the percentage of cell-surface-expressed CCR5 on peripheral blood lymphocytes (PBLs) that could not be downregulated when PBL-enriched plasma from patients was incubated ex vivo with recombinant chemokine (MIP-1β). Plasma HIV-1 RNA levels were evaluated using the Roche Amplicor v1.5 reverse-transcriptase polymerase chain reaction assay (Roche Diagnostics, Basel, Switzerland).
The published maraviroc PK–PD disease model will be reviewed first [4] and then the development of the new viral and operational model of (ant-)agonism will be described. The Results section will present the application of the new model to describe the effect of maraviroc on viral load.
Published maraviroc PK–PD disease model
The PK model was a population model that described the concentration–time profiles of the drug. For simplicity, the Equivalent Constant Concentration (ECC) approach was used [ECC is the constant drug concentration that has the same average PD effect as the time-varying concentration profile over a time (e.g. dose) interval][5].
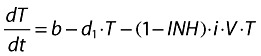
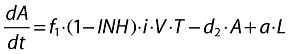
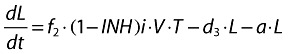
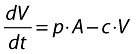
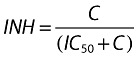
The effect of maraviroc was modelled using an inhibitory Emax model in the PD model (Equation 5) acting on the infection rate constant of the virus and target cells (Equations 1–4). With this parameterization, it was assumed that the antagonistic effect of maraviroc is noncompetitive, which is consistent with recent in vitro findings [14, 15].
The major component of the maraviroc PK–PD disease model is the disease (viral dynamic) model. It is based on the prey and predator principle introduced by Volterra [16] and adapted for viral dynamics by Bonhoeffer [17–19]. This model describes the interaction between the virus and the target cells (Figure 1) by use of differential equations (Equations 1–4).
Figure 1.
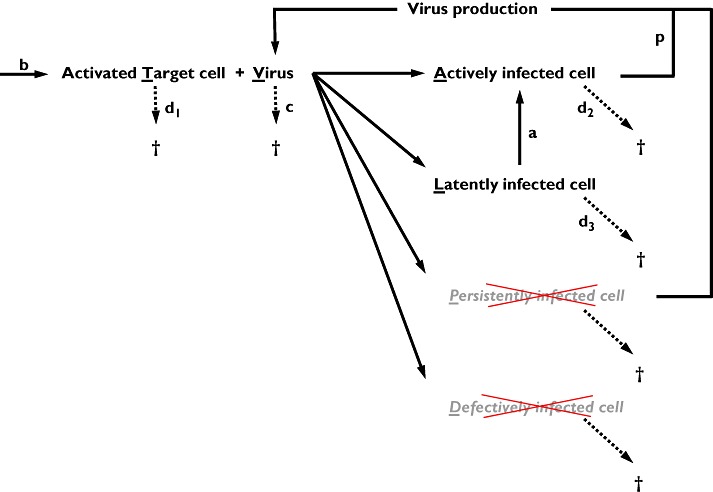
Schematic representation of the viral dynamic model used in the existing PK–PD disease model. In the model the persistently and defectively infected cells were omitted
Target cell (activated CD4+ cells):
 |
(1) |
Actively infected cells (short-lived):
 |
(2) |
Latently infected resting cells (long-lived):
 |
(3) |
Infectious virus (copies HIV-1 RNA):
 |
(4) |
where:
b is the activation rate constant of healthy target cells (T).
d1 is the death rate constant of T cells.
i is the infection rate constant of T cells.
V is the number of virus particles.
f1 is the fraction of healthy T cells which become short-lived infected T cells (A).
d2 is the death rate constant of short-lived infected T cells.
f2 = (1 − f1) is the fraction of healthy T cells which become long-lived infected T cells (L).
d3 is the death rate constant of latently infected resting cells.
a is the reactivation rate constant of latently infected resting cells.
p is the viral production rate constant of short-lived infected T cells.
c is the death rate constant of virus.
 |
(5) |
where:
C is the plasma concentration of maraviroc.
IC50 is the plasma concentration of maraviroc that results in 50% inhibition.
INH is the inhibition of the infection rate.
The viral dynamic model has the advantage of being able to describe viral load-time profiles for short- as well as for long-term treatments.
Development of the combined viral dynamic and operational model for maraviroc
In terms of receptor theory and an operational model of drug action, the viral replication process can be seen as a binding–stimulus–response cascade in which the virus acts as an agonist. For example, in pharmacology, a drug–receptor interaction (site 1) can be followed by activation of G-proteins (site 2), the production of second messenger that can be viewed either directly (site 3) or through reporter genes and/or proteins (site 4), and finally by the production of cellular/tissue responses (site 5) [10]. Analogously, the binding of the virus to the CD4 and CCR5 coreceptors can be followed by the virus fusion/entry into the cell (site 1), uncoating and reverse transcription giving the viral DNA (site 2), genome integration and replication giving copies of the HIV RNA genome (site 3), protein synthesis giving viral proteins (site 4), protein cleavage and the new virus assembly and spread (site 5). Consequently, due to the similarities in these two cascades, it seemed attractive to investigate if receptor theory and an operational model of drug action could be applied to viral dynamics.
Mathematical models that describe the binding–stimulus–response relationship have been proposed by Stephenson (stimulus or spare receptor model [20]) and Black (operational model of drug action [12]). These models can be summarized as follows:
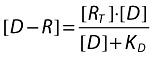
In a first step, the agonist binds to the receptor. This interaction is described by Clark's equation [21]:
 |
(6) |
where:
[D] is the concentration of drug.
[RT] is the total concentration of receptor.
[D − R] is the complex drug-receptor.
KD is the ratio between the dissociation (k2) and association (k1) rate constants (k2/k1) and is the concentration of D that gives half maximum binding.
In the second step, a stimulus (messenger) is produced, which is proportional to the number of receptors occupied by the drug:
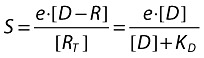 |
(7) |
where:
e is the proportionality factor denoting the power of the drug to produce the stimulus.
In the third step, the stimulus activates a secondary system to give the observed effect/response. In Stephenson's approach, the response is some undefined function of stimulus, the only requirements being that it be monotonic and continuous:
 |
(8) |
where:
ED is the measured effect of the drug D.
EM is the maximum operational effect.
S50 is the stimulus that elicits half the maximum effect.
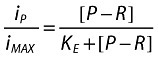
In Black's approach, which can be seen as a particular case of Stephenson's approach, the response model is restricted to a hyperbolic function (as in the example given in Equation 8) and the second step (stimulus production) is not explicitly described, the stimulus being coupled to the number of occupied receptors:
 |
(9) |
where:
KE is the value of [D − R], which elicits half the maximum tissue response.
It can also be demonstrated that:
 |
(10) |
and
 |
(11) |
Figure 2 shows some graphical representations of the binding–stimulus–response model as described in Equations 6–11.
Figure 2.
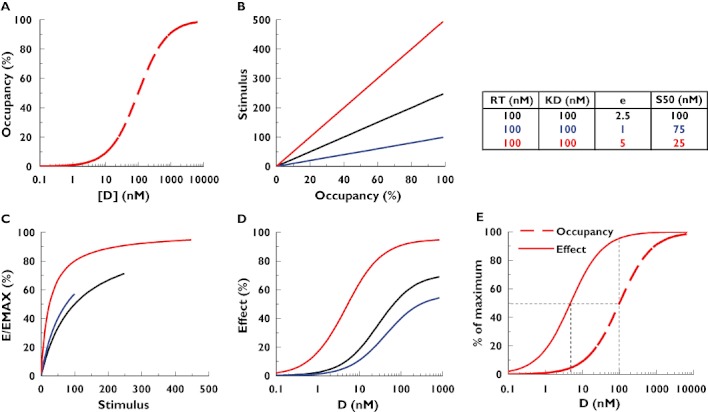
Simulation of the binding–stimulus–response (operational) model for three different scenarios of parameters (table within the figure). Graph A: receptor occupancy in function of drug concentration (Equation 6). Graph B: stimulus production in function of receptor occupancy (Equation 7). Graph C: observed effect in function of the stimulus (Equation 9). Graph D: observed effect in function of drug concentration (combination of Equations 6, 7, 9). Graph E: receptor occupancy (Equation 6) and effect (Equation 9) in function of drug concentration for the third scenario (red curves)
This binding–stimulus–response model introduces two important concepts:
The ‘spare receptor’ concept or ‘system efficiency’, where the maximum observable effect does not require maximal receptor occupancy by the drug. This is illustrated in graph E of Figure 2, which shows that only 50% receptor occupancy is required to elicit almost maximum effect. As a consequence, receptor occupancy >50% will not notably influence the level of effect. In addition, the apparent EC50, the concentration of drug that elicits half the maximum effect, can be much lower than KD, the concentration of the drug that leads to 50% receptor occupancy (Figure 2, graph E), leading to an apparent higher potency (or ‘sensitization’).
The ‘amplification’ concept: the response can be amplified after receptor occupancy. In case of sequential multiple steps, this amplification factor can become very large.
Application of the model to viral replication and CCR5 antagonists
Viral replication can be seen as a sequential cascade of events where each critical point (e.g. where antiviral drugs interact) can conceptually be described by an operational model of drug action. Figure 3 shows the results of a theoretical simulation based on this approach. In this hypothetical simulation (i.e. KE values of each step have been arbitrarily fixed to a value of 0.5), a low viral binding (e.g. 20% in step 1) can elicit maximum viral production (about 100% in step 5), indicating that spare capacity exists in this theoretical example.
Figure 3.
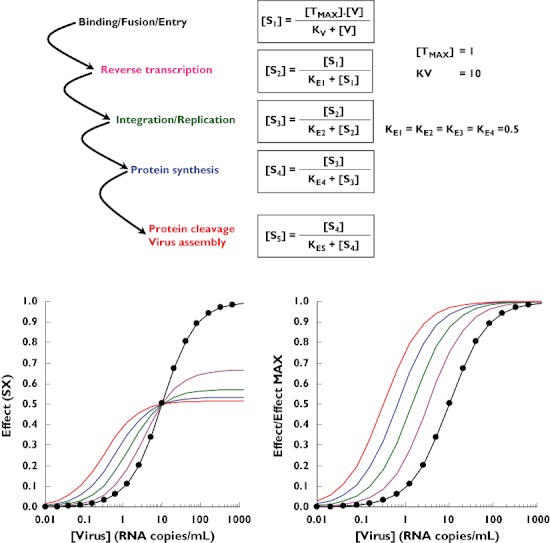
Theoretical simulation of viral replication as a cascade of operational model of agonism. [TMAX] is the maximum concentration of activated target cells, which can be infected. [V] is the virus concentration. Kv is the theoretical concentration of viruses that elicits half the maximum binding to the activated receptors on the target cells. KEX is the theoretical stimulus (SX) that elicits half the maximum response (SX+1). Step 1 ( ); Step 2 (
 ); Step 3 (
 ); Step 4 (
 ); Step 5 (
 )
)
If it is assumed that the simulation presented in Figure 3 is a fair qualitative and quantitative representation of viral replication, it could be asked what would happen to the viral production (i.e. step 5) if a drug such as a CCR5 antagonist that blocks the binding of the virus to the receptor (i.e. step 1) is added to the system. This has been evaluated theoretically by simulation, the results of which are presented in Figure 4. In this simulation, it is assumed that about 80% of the receptors are occupied by the virus in the absence of CCR5 antagonist; in our theoretical example only 20% occupancy is enough to reach the maximum viral production by the system. Assuming noncompetitive antagonism, increasing drug concentrations gradually decrease the binding of the virus to the CCR5 receptor. However, and in agreement with the results of Figure 3, it is only when the binding of the virus drops below 20% (i.e. step 1) that a significant decrease in viral production (i.e. step 5) can be observed. This system characteristic leads to a highly nonlinear relationship between receptor occupancy by an antagonist (blockade of step 1) and inhibition of viral production (measured/observed effect, step 5). Viral production is hardly inhibited at antagonist occupancy of the CCR5 receptor up to 80%, whereas at antagonist occupancy between 80 and 100%, viral production begins to be drastically inhibited (right graph of Figure 4).
Figure 4.
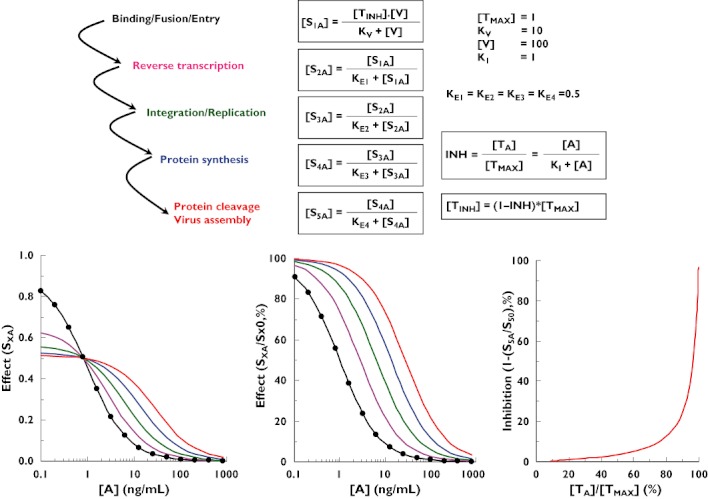
Theoretical simulation of viral replication as a cascade of the operational model of agonism and its inhibition by a CCR5 antagonist. [V] is the theoretical virus concentration. [A] is the antagonist concentration. KI is the antagonist concentration that elicits half the maximum binding to the activated receptors on the target cells. [TINH] is the free activated receptor concentration on the target cell in the presence of a non-competitive antagonist. SXA is the effect at step X in the presence of an antagonist. SXO is the effect at step X in the absence of antagonist. Step 1 ( ); Step 2 (
 ); Step 3 (
 ); Step 4 (
 ); Step 5 (
 )
)
Combined operational (ant-)agonism and viral dynamic model for maraviroc
In the previous sections, we have shown how a viral dynamic model or an operational model of (ant-)agonism can be used to describe the effect of maraviroc on viral load. The viral dynamic model has the advantage of being able to describe viral load–time profiles for short- as well as for long-term treatments, whereas the operational model of (ant-)agonism can describe the viral load only at equilibrium under long-term treatment. On the other hand, the operational model of (ant-)agonism has the potential advantage of being able to better describe/explain the working mechanism of the compound. Therefore, a model that combines the advantages of both approaches seems attractive. Such a model has been developed for maraviroc and is presented in this section. The main question when building such a model is where to anchor the operational model of (ant-)agonism of maraviroc in the differential equations of the viral dynamic model. The answer to this question is given by examining Equation 12.
 |
(12) |
In Equation 12, which describes the target cells in the absence of drug, V (the number of virus particles) and T (the number of activated cells) can be seen as the quantitative players of the infection, whereas i (the infection rate) can be seen as the qualitative aspect of the infection and which depends on the virus type and the number of receptors activated on each cell. This is where maraviroc is expected to play its role.
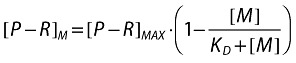
Assume that the number of activated receptors for one target cell (that will drive the infection rate) can be described by the following equation:
 |
(13) |
where:
[P − R] is the activated receptor concentration on the target cell.
[RT] is the maximum possible activated receptor concentration on the target cell (fixed to 1 in the simulation).
P is a virtual endogenous off/on activator of the receptor.
KP is the concentration of P that gives half maximum activated receptors.
Note it will be assumed later that this activation step is a slowly reversible off/on process at the cell level (i.e. when a target cell is activated, all its receptors undergo a conformation change and remain in the activated state for a long time) (Figure 5).
Figure 5.
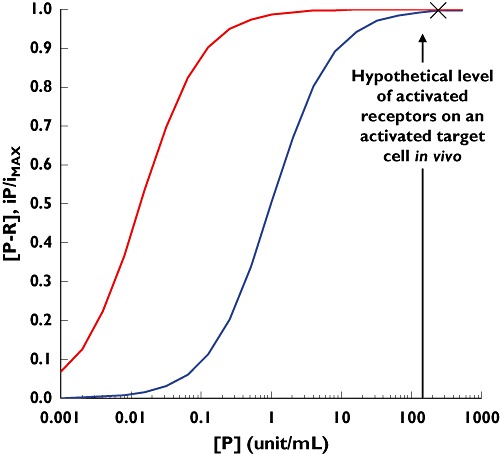
Simulation of a hypothetical operational model of agonism describing the relationship between the receptor activation on a target cell (blue curve) and the resulting infection rate of the target cell (red curve). The simulation is based on Equations 13 and 14 with parameters [RT] = 1; KP = 1; KE = 0.012
If the infection rate constant depends on the number of activated receptors present on the target cell, one may write the following operational equation:
 |
(14) |
where:
KE is the concentration of activated receptor that gives half maximum infection rate.
iP/iMAX is the fraction of the maximum possible infection rate in the presence of the endogenous receptor activator p.
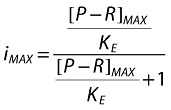
 |
(15) |
Now, let us assume that, when activated, target cells express more receptors than needed to become infected [i.e. (P − R) is significantly higher than KE]. If this is true, then the infection rate of activated cells should be close to the maximum allowed by the system (the ‘X’ depicted on Figure 5). Physiologically, it is almost impossible to verify this assumption, since the activation of the receptor on the target cells is a difficult process to modulate/investigate (agonist approach; blue curve in Figure 5; Equation 13). However, maraviroc is a pharmacological tool that can block the activated receptors and gradually decrease their number on the target cells (antagonist approach). By analysing the relationship between the gradual blockade of the activated receptor by maraviroc (e.g. decrease of the blue curve in Figure 5) and the corresponding decrease in the infection rate (e.g. decrease in the red curve in Figure 5), it is possible to verify this assumption.
As mentioned in the Introduction, information on the in vivo inhibition of the infection rate and on the CCR5 receptor occupancy by maraviroc is available:
From the PK–PD disease model analysis of the viral load–time profiles in HIV-1-infected patients treated with maraviroc short-term monotherapy, an in vivo IC50 of about 8 ng ml−1 plasma has been estimated [5].
From a PK–PD analysis of the CCR5 receptor occupancy by maraviroc in healthy volunteers and HIV-1-infected patients, an in vivo KD of 0.089 ng ml−1 plasma has been estimated [6].
Based on this information, binding to the CCR5 receptor and inhibition of the infection rate by maraviroc have been simulated (Figure 6). By applying the operational model described in Equations 13–15, the apparent discrepancy between the IC50 of the infection rate and the KD of the binding to the CCR5 receptor has been potentially explained. The estimated value of KE (Equation 14) that reconciles the binding of maraviroc to the CCR5 receptor (and the mirror curve of the remaining free activated receptors) with the estimated inhibition of the infection rate (i.e. moves the blue dash line to become the red line that overlaps the green line) is about 0.012. This means that only 1.2% free activated receptors on the target cell are utilized to elicit 50% of the maximum infection rate. This suggests that target cells express significant amounts of spare receptors, which require a high percentage of blockade before any effective decrease in the infection rate can be observed (Figure 6), and it explains why 98.8% of the CCR5 receptors need to be blocked by maraviroc to inhibit the infection rate by 50%.
Figure 6.
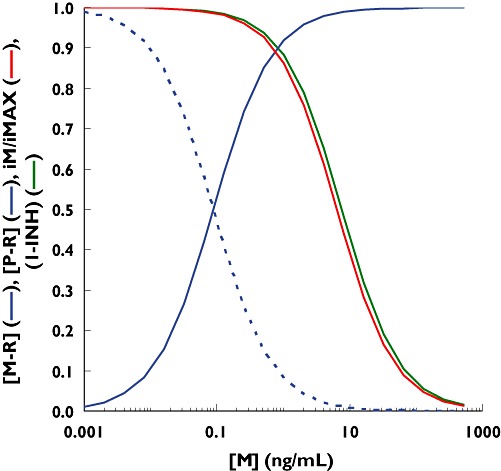
Simulation of the fraction of activated CCR5 receptors occupied by maraviroc. [Blue curve: (M-R) based on (6)], remaining free activated CCR5 receptors on a target cell [blue dash curve: (P-R) = 1 − (M-R)], in vivo estimated inhibition of the infection rate [green curve: 1-INH of Equations 1–4 based on (5)] and operational inhibition of the infection rate based on Equation 17 and a KE value of 0.012 [P-R]/cell (red curve)]. M = maraviroc
Results
By using the combined model, the binding of maraviroc to the CCR5 receptor and the viral load–time profile can be simultaneously simulated for any duration of treatment. The model equations can be summarized as follows:
 |
(16) |
where:
[P − R]M is the concentration of activated receptors on a target cell in the presence of maraviroc.
[P − R]max is the maximum concentration of activated receptors on a target cell after endogenous activation and in the absence of maraviroc (assumed to be RT and fixed to 1 in the simulation).
[M] is the concentration of maraviroc.
KD is the concentration of maraviroc that gives 50% occupancy of activated receptors.
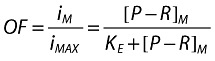 |
(17) |
where:
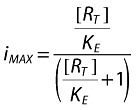
iM/imAX is the fraction of the infection rate constant in the presence of maraviroc [also called the operational factor (OF) of the infection rate].
 |
(18) |
where:
KE is the fitting operational constant that equals OF to (1-INH) from Equations 1–5.
 |
(19) |
where:
i is the infection rate constant of T cells by the virus V after endogenous activation of the target cells and in the absence of inhibitors.
Actively infected cells (short-lived):
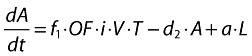 |
(20) |
Latently infected resting cells (long-lived):
 |
(21) |
Infectious virus (copies HIV-1 RNA):
 |
(22) |
Figure 7 shows the results of the simultaneous simulation of maraviroc binding to the CCR5 receptor and corresponding viral load at equilibrium using Equations 16–22, the viral dynamic parameters estimated with maraviroc [5] and a KE value of 0.012.
Figure 7.
Simultaneous simulation of maraviroc binding to CCR5 receptor (blue curve) and effect on viral load at equilibrium (red curve) using a combined operational model of (ant-)agonism and viral dynamic model
Discussion
Models are developed for a purpose; in the current case they are being used to aid in the selection of the optimal dosage regimen for maraviroc. An earlier PK–PD disease model had been developed to aid design and analysis of short-term monotherapy studies with maraviroc in naive HIV-1-infected patients [6]. It was also used to aid selection of maraviroc doses for Phase 2b/3 clinical studies [5]. The major component of that model was the disease (viral dynamic) model, which was based on the prey and predator principle introduced by Volterra [16] and adapted for viral dynamics by Bonhoeffer [17, 18, 19]. The viral dynamic model described the interaction between the virus and the target cells by means of differential equations and could be used to predict individual viral load–time profiles after short- as well as long-term treatments.
However, the viral replication process can also be seen as a binding–stimulus–response cascade in which the virus is an agonist. Therefore, receptor theory and an operational model of (ant-)agonism could also be applied to the dynamics of the HIV virus. In contrast to the viral dynamic model, however, the operational model of (ant-)agonism can only describe the viral load at equilibrium (after long-term treatment).
In order to combat this shortcoming of the otherwise intuitively appealing operational model of (ant-)agonism, the present work has been performed. We have described how the existing viral dynamic model can be combined with an operational model of (ant-)agonism that takes into account the working mechanism of the antiviral drug. The anchor point of the operational model in the differential equations of the viral dynamic model is the infection rate constant. This is assumed to be dependent on the number of free activated receptors on each target cell. With this combined model, viral load after both short- and long-term treatment can be predicted and the effect of drugs (with different mechanisms of action) on various viral replication steps can be better mechanistically described. The combined model was used to simulate simultaneously the binding of maraviroc to the CCR5 receptor and the resulting effect on viral load after short- and long-term treatment (Figure 8). The model also provides a possible explanation for the apparent discrepancy between the in vivo binding of maraviroc to the CCR5 receptor (KD = 0.089 ng ml−1) and the estimated in vivo inhibition (IC50 ≈ 8 ng ml−1) of the infection rate. The operational model introduces the assumption that the target cells, when activated, express more receptors (spare receptors) than needed. In the presence of an antagonist, these spare receptors need to be blocked first before any decrease in the infection rate (and the viral load) can be detected, hence the higher estimated in vivo inhibition IC50 value when compared with the in vivo CCR5 binding KD value. The estimated KE value from the operation model of (ant-)agonism part of the model indicates that only 1.2% of the activated receptors are utilized to elicit 50% of the maximum infection rate. It also explains why 98.8% of the CCR5 receptors need to be blocked by maraviroc to inhibit the infection rate by 50%. Since the viral dynamic system is characterized by a turnover process and cell infection is an irreversible process, the KE value can also be interpreted as being the fraction of free receptors that give rise to 50% probability for an activated target cell to be infected during its life span. Bearing this in mind, the apparent low fraction of free receptors required for cell infection might be due to the fact that the CCR5 receptor is a co-receptor. Indeed, the main steps in the viral entry process are (i) attachment of the viral gp120 to the CD4 T-cell receptor, (ii) binding of the gp120 to CCR5 or CXCR4 co-receptors, and (iii) fusion of the viral membrane and cellular membranes [22]. Another possible explanation is that maraviroc is an allosteric modulator (noncompetitive antagonist) of the CCR5 receptor, which might lead to permissive antagonism [23] that would require higher receptor occupancy than a competitive antagonist to reach the same level of inhibition. In this case, the actual fraction of free CCR5 receptor required for 50% of the maximum infection rate might be higher than that derived from the receptor occupancy by maraviroc.
Figure 8.
Simultaneous simulation of maraviroc plasma concentration, CCR5 receptor occupancy, operational factor and viral load–time profiles after short (four top graphs, full profiles) or long (four bottom graphs, trough values) term oral administration of maraviroc in a typical HIV-positive patient. LOQ indicates the limit of quantification of RNA copies. 25 mg bid (—); 100 mg bid ( ); 300 mg bid (
 );
);
Use of the operational model of agonism within the field of pharmacometrics is not new. Van der Graaf et al. used the operational model of agonism to predict the tissue-dependent efficacy of adenosine A1 receptor agonists in rats [24]. Zuideveld et al. used such a model and combined it with a previously described semimechanistic PK–PD model to predict the in vivo intrinsic efficacy of 5-HT1A agonists on body temperature in rats [25]. The present work extends the use of the operational model of agonism by applying it to describe viral infection where the virus is the agonist and the antiviral drug is the antagonist. It can be anticipated that this new combined viral dynamic and operational model of (ant-)agonism can be developed further and be applied to other classes of antiviral agents, including reverse transcriptase, integrase, and protease inhibitors. Data on in vivo enzyme inhibition would help in building such models.
Conclusions
The use of the operational model of (ant-)agonism to explain the discrepancy between the estimated in vivo IC50 and the ex vivo receptor affinity of maraviroc introduces the assumption that the target cells, when activated, express more receptors (spare receptors) than needed. In the presence of an antagonist, these spare receptors first need to be blocked before any decrease in the infection rate and consequently in the viral load at equilibrium can be detected. However, taking into consideration the possibility of permissive noncompetitive antagonism, this mechanistic interpretation remains open to debate.
Competing interests
P.J. and J.R.W. were paid consultants to Pfizer Ltd. L.M. is an employee of Pfizer Ltd.
P.J. and J.R.W. from Exprimo NV were contracted to perform the model development and analysis on behalf of Pfizer Ltd. Editorial assistance was provided by Janet E. Matsuura, PhD at Complete Healthcare Communications, Inc., and was funded by Pfizer Inc., New York, NY, USA.
REFERENCES
- 1.Dorr P, Westby M, Dobbs S, Griffin P, Irvine B, Macartney M, Mori J, Ricketet G, Smith-Burchnell C, Napier C, Webster R, Armour D, Stammen B, Wood A, Perros M. Maraviroc (UK-427 857), a potent, orally bioavailable, and selective small-molecule inhibitor of chemokine receptor CCR5 with broad-spectrum anti-human immunodeficiency virus type 1 activity. Antimicrob Agents Chemother. 2005;49:4721–32. doi: 10.1128/AAC.49.11.4721-4732.2005. [DOI] [PMC free article] [PubMed] [Google Scholar]
- 2.Fatkenheuer G, Pozniak AL, Johnson MA, Plettenberg A, Staszewski S, Hoepelman AI, Saag MS, Goebel FD, Rockstroh JK, Dezube BJ, Jenkins T, Medhurst C, Sullivan JF, Ridgway C, Abel S, James IT, Youle M, van der Ryst E. Efficacy of short-term monotherapy with maraviroc, a new CCR5 antagonist, in patients infected with HIV-1. Nat Med. 2005;11:1170–2. doi: 10.1038/nm1319. [DOI] [PubMed] [Google Scholar]
- 3.McHale M, Abel S, Russell D, Gallagher J, van der Ryst E. Overview of phase 1 and 2a safety and efficacy data of maraviroc (UK-427 857). 3rd IAS Conference on HIV Pathogenesis and Treatment; 2005 July 24–27; Rio de Janeiro, Brazil. [Google Scholar]
- 4.Rosario MC, Jacqmin P, Dorr P, van der Ryst E, Hitchcock C. A pharmacokinetic–pharmacodynamic disease model to predict in vivo antiviral activity of maraviroc. Clin Pharmacol Ther. 2005;78:508–19. doi: 10.1016/j.clpt.2005.07.010. [DOI] [PubMed] [Google Scholar]
- 5.Rosario MC, Poland B, Sullivan J, Westby M, van der Ryst E. A pharmacokinetic–pharmacodynamic model to optimize the phase IIa development program of maraviroc. J Acquir Immune Defic Syndr. 2006;42:183–91. doi: 10.1097/01.qai.0000220021.64115.37. [DOI] [PubMed] [Google Scholar]
- 6.Rosario MC, Jacqmin P, Dorr P, James I, Jenkins TM, Abel S, van der Ryst E. Population pharmacokinetic– pharmacodynamic analysis of CCR5 receptor occupancy by maraviroc in healthy subjects and HIV-positive patients. Br J Clin Pharmacol. 2008;65(Suppl. 1):86–94. doi: 10.1111/j.1365-2125.2008.03140.x. [DOI] [PMC free article] [PubMed] [Google Scholar]
- 7.De Milito A, Titanji K, Zazzi M. Surrogate markers as a guide to evaluate response to antiretroviral therapy. Curr Med Chem. 2003;10:349–65. doi: 10.2174/0929867033368240. [DOI] [PubMed] [Google Scholar]
- 8.Tsoukas CM, Bernard NF. Markers predicting progression of human immunodeficiency virus-related disease. Clin Microbiol Rev. 1994;7:14–28. doi: 10.1128/cmr.7.1.14. [DOI] [PMC free article] [PubMed] [Google Scholar]
- 9.Vergu E, Mallet A, Golmard JL. Available clinical markers of treatment outcome integrated in mathematical models to guide therapy in HIV infection. J Antimicrob Chemother. 2004;53:140–3. doi: 10.1093/jac/dkh024. [DOI] [PubMed] [Google Scholar]
- 10.Kenakin T. Pharmacologic Analysis of Drug–Receptor Interaction. 2. New York: Raven Press; 1993. [Google Scholar]
- 11.Rang HP. The receptor concept: pharmacology's big idea. Br J Pharmacol. 2006;147:S9–16. doi: 10.1038/sj.bjp.0706457. [DOI] [PMC free article] [PubMed] [Google Scholar]
- 12.Black JW, Leff P. Operational models of pharmacological agonism. Proc R Soc Lond B Biol Sci. 1983;220:141–62. doi: 10.1098/rspb.1983.0093. [DOI] [PubMed] [Google Scholar]
- 13.Dorr PK, Dobbs S, Rickett G, Lewis B, Macartney M, Westby M, Perros M. In vitro evaluation of prolonged CCR5 occupancy by small molecule antagonists with anti-HIV activity. Abstr Intersci Conf Antimicrob Agents Chemother. 2003;43:F–1462. [Google Scholar]
- 14.Mosley M, Smith-Burchnell C, Mori J, Lewis M, Stockdale M, Huang W, Whitcomb J, Petropoulos CJ, Perros M, Westby M. Resistance to the CCR5 antagonist maraviroc is characterised by dose–response curves that display a reduction in maximal inhibition [abstract 598]. 13th Conference on Retroviruses and Opportunistic Infections; 2006 February 5–8; Denver, CO. [Google Scholar]
- 15.Pullen S, Sale H, Napier C, Mansfield R, Holbrook M. Maraviroc is a slowly reversible antagonist at the human CCR5 in a CRE luciferase reporter gene assay (abstract 504). 13th Conference on Retroviruses and Opportunistic Infections; 2006 February 5–8; Denver, CO. [Google Scholar]
- 16.Volterra V. Variazioni e Fluttuazioni del Numero d'Individui in Specie Animali Conviventi. Mem R Accad Naz Dei Lincei. 1926;2:31–113. [Google Scholar]
- 17.Bonhoeffer S. Models of viral kinetics and drug resistance in HIV-1 infection. AIDS Patient Care STDS. 1998;12:769–74. doi: 10.1089/apc.1998.12.769. [DOI] [PubMed] [Google Scholar]
- 18.Bonhoeffer S, May RM, Shaw GM, Nowak MA. Virus dynamics and drug therapy. Proc Natl Acad Sci USA. 1997;94:6971–6. doi: 10.1073/pnas.94.13.6971. [DOI] [PMC free article] [PubMed] [Google Scholar]
- 19.Funk GA, Fischer M, Joos B, Opravil M, Gunthard HF, Ledergerber B, Bonhoeffer S. Quantification of in vivo replicative capacity of HIV-1 in different compartments of infected cells. J Acquir Immune Defic Syndr. 2001;26:397–404. doi: 10.1097/00126334-200104150-00001. [DOI] [PubMed] [Google Scholar]
- 20.Stephenson RP. A modification of receptor theory. Br J Pharmacol Chemother. 1956;11:379–93. doi: 10.1111/j.1476-5381.1956.tb00006.x. [DOI] [PMC free article] [PubMed] [Google Scholar]
- 21.Clark AJ. The Mode of Action of Drugs on Cells. London: Edward Arnold; 1933. [Google Scholar]
- 22.Briz V, Poveda E, Soriano V. HIV entry inhibitors: mechanisms of action and resistance pathways. J Antimicrob Chemother. 2006;57:619–27. doi: 10.1093/jac/dkl027. [DOI] [PubMed] [Google Scholar]
- 23.Kenakin T. New concepts in drug discovery: collateral efficacy and permissive antagonism. Nat Rev Drug Discov. 2005;4:919–27. doi: 10.1038/nrd1875. [DOI] [PubMed] [Google Scholar]
- 24.Van der Graaf PH, Van Schaick EA, Visser SA, De Greef HJ, Ijzerman AP, Danhof M. Mechanism-based pharmacokinetic–pharmacodynamic modeling of antilipolytic effects of adenosine A (1) receptor agonists in rats: prediction of tissue-dependent efficacy in vivo. J Pharmacol Exp Ther. 1999;290:702–9. [PubMed] [Google Scholar]
- 25.Zuideveld KP, Van der Graaf PH, Newgreen D, Thurlow R, Petty N, Jordan P, Peletier LA, Danhof M. Mechanism-based pharmacokinetic–pharmacodynamic modeling of 5-HT1A receptor agonists: estimation of in vivo affinity and intrinsic efficacy on body temperature in rats. J Pharmacol Exp Ther. 2004;308:1012–20. doi: 10.1124/jpet.103.059030. [DOI] [PubMed] [Google Scholar]