

Abstract
Background
Maraviroc, a noncompetitive antagonist of the CCR5 coreceptor, was recently approved in the USA as a treatment of HIV infection. For antiretroviral agents that target the virus, antiviral effect can be related to some extent to plasma drug concentrations. For CCR5 antagonists that target the host cells, receptor occupancy in vivo might be a better predictor of efficacy.
Aims
To develop a population pharmacokinetic (PK)–pharmacodynamic (PD) model that describes CCR5 receptor occupancy by maraviroc after oral administration at different doses in healthy volunteers and HIV-positive patients and to assess the relevance of receptor occupancy in predicting the decrease in viral load (HIV-1 RNA copies ml−1) in HIV-positive patients.
Methods
Receptor occupancy data from 88 individuals enrolled in two multiple dose trials were included in the population PK–receptor binding model. Out of the 88 individuals, 25 were HIV-1-infected patients and had viral load measurements, whereas the remaining 63 were healthy volunteers. Doses ranged from 3 mg b.i.d. to 600 mg q.d. A previously published PK–PD disease model describing the effect of maraviroc on the viral load was updated by replacing its PD module by the receptor occupancy model. Simulated viral load–time profiles with the updated model were compared with the profiles observed in patients.
Results
The majority of measured plasma concentrations were associated with receptor occupancy ≥50% even at the lowest dose of 3 mg b.i.d. A simple direct Emax model appeared to describe satisfactorily the PK–receptor occupancy relationship. The estimated KD was around 0.0894 ng ml−1, far below the operational in vivo antiviral IC50 of 8 ng ml−1. Accordingly, simulations led to marked overprediction of the decrease in viral load–time profiles.
Conclusions
Maraviroc receptor occupancy close to the maximum is required to induce a significant decrease in viral load, indicating that in vivo CCR5 receptor occupancy by maraviroc is not a direct measure of drug inhibitory activity. Considering the imprecision of the measurement in the upper flat part of the maraviroc concentration vs. percent CCR5 occupancy curve, it can reasonably be concluded that routine monitoring of receptor occupancy as a biomarker for maraviroc efficacy will not be helpful. Based on this analysis, it was decided not to use receptor occupancy as a biomarker of viral load inhibition during the development of CCR5 antagonist compounds.
Keywords: CCR5, maraviroc, NONMEM, population–pharmacodynamic meta-analysis
Introduction
Maraviroc is a selective, small molecule noncompetitive (with respect to chemokine and cognate ligand) CCR5 antagonist with potent in vivo anti-human immunodeficiency virus (HIV) activity. In HIV-1-infected patients, maraviroc given as monotherapy for 10 days reduced HIV-1 viral load by up to 1.6 log10 copies [1]. The use of biomarkers in drug development has received much attention over the years. The validation of the biomarkers with clinical outcomes is necessary before the biomarker can be used as a decision-making tool in drug development. For an antiretroviral agent that targets the virus directly, there is a direct relationship between antiviral effects, as measured by a decrease in plasma HIV-1 RNA level, and plasma drug concentrations, so dose selection is based on the in vitro concentrations, which resulted in 50% (IC50) and 90% (IC90) inhibition of viral replication. However, for a CCR5 antagonist drug an argument can be made that saturation of the CCR5 receptor could be a better predictor of efficacy.
A MIP-1β (natural ligands of CCR5) internalization assay was developed to evaluate ex vivo occupancy of the CCR5 receptor during treatment with maraviroc and was included in the early clinical development plan of maraviroc [2]. Maraviroc binds to CCR5 coreceptors on CD4+ cells, blocking HIV entry into the cell. In vitro studies have shown that maraviroc has insurmountable antagonistic activity against human CCR5 in a CRE-luciferase reporter gene assay and exhibits a slow physical dissociation from receptors [3]. The pharmacology, antiviral properties, selectivity and preclinical pharmacokinetics (PK) of maraviroc are described elsewhere [4, 5].
A PK–pharmacodynamic (PD) disease model has been developed previously to aid design of a 10-day monotherapy study with maraviroc in HIV-1-infected patients [6]. In that model, the PD effect of maraviroc was empirically described using an inhibitory maximum effect (Emax) model acting on the infectivity rate of the virus. The model was later updated with data from further HIV-1-infected patients and the updated IC50 parameter was estimated to be around 8 ng ml−1[7].
This study describes the development of a population PK–PD model of maraviroc concentration and receptor occupancy data obtained after multiple-dose administration of maraviroc in healthy volunteers and HIV-1-infected patients and the assessment of the relevance of this model in predicting the clinical outcome (decrease in viral load) in HIV-1-positive patients.
Methods
Study designs
Data were obtained from two double-blind, placebo-controlled, randomized, multiple-dose studies in healthy volunteers and HIV-positive patients following oral administration of maraviroc.
Healthy volunteer study (study A4001002)
This was a study of six cohorts where 65 healthy volunteers received maraviroc 3 mg, 10 mg, 25 mg, 100 mg, 300 mg b.i.d. and 600 mg q.d. or placebo for 12 days. Only the morning dose of maraviroc was administered on day 1 and day 12. No dose was administered on day 2. On days 3–11, maraviroc was given in the morning and in the evening (12 h apart) for the b.i.d. regimen and in the morning only for the q.d. regimen. The study took place in the Pfizer Research Clinic (Hospital Erasme, Brussels, Belgium). Full PK profiles were obtained on days 1, 7 and 12 and predose samples on days 2–6 and 8–11. Blood samples were taken for receptor occupancy analysis on day 1 at predose and at 4, 12, 24 and 48 h postdose, on day 3 at 4 h post morning and evening doses, day 4–11 at 2 h post morning dose and day 12 at predose and 8, 12, 24, 48, 96, 120 and 144 h postdose. For the 3-mg and 10-mg b.i.d. dose groups, blood samples were taken on day 1 predose and at 4, 8, 12, 18, 24 and 48 h postdose, day 3 at 4 h post morning and evening dose, days 4–11 at 2 h post morning dose and day 12 at predose and 8, 12, 24, 48, 96, 120 and 144 h postdose. For the 300-mg b.i.d. and 600-mg q.d. dose groups no blood samples were taken for receptor saturation determination.
Patient study (two arms of study A4001007 only)
This was a multicentre study of 25 asymptomatic HIV-1-infected male or sterilized female patients to investigate the PK and PD of maraviroc following the administration of maraviroc 100 mg b.i.d. or 25 mg q.d. or placebo for 10 days. Patients were either antiretroviral drug-naive or had been off antiretroviral treatment for a minimum of 8 weeks prior to enrolling in the study. Patients had plasma HIV-1 RNA ≥5000 copies ml−1 and CD4 cell count >250 cells mm−3 and CCR5-tropic virus only as determined by a recombinant virus entry assay (Monogram Biosciences PhenoSense® Entry Assay, San Francisco, CA, USA). Full PK profiles were taken on days 1 and 10. In addition, morning predose samples were taken on days 2–9. Blood samples were taken for receptor occupancy analysis on day 1 at predose and 4 h post morning dose, on day 5 at pre morning dose, on day 10 at predose, on days 11, 13, 15 and 19 in the mornings and during follow-up. Plasma HIV-1 RNA levels were evaluated using the Roche Amplicor v1.5 reverse-transcriptase polymerase chain reaction assay (Roche Diagnostics) at three prestudy visits (screening, randomization and at baseline), from day 2 through to day 13, and on days 15, 19, 22, 25 and 40 after the start of the treatment.
Local independent ethics committees approved both study protocols, and all subjects voluntarily provided informed consent according to the Declaration of Helsinki, 1989 (Revised Edinburgh, October 2000), and to local laws and regulations relevant to the use of new therapeutic agents in the countries of conduct.
Maraviroc concentration measurements
Plasma concentrations were analysed by a centralized laboratory (Maxxam Analytics, Inc., Mississauga, ON, Canada) using high-performance liquid chromatography–tandem mass spectrometry. The lower limit of quantification for maraviroc plasma concentration was 0.5 ng ml−1, except for measurements made in the 3-mg and 10-mg treatment arms from study A4001002, where the lower limit of quantification was 0.1 ng ml−1.
Receptor occupancy (MIP-1β internalization assay)
CCR5 occupancy was determined using flow cytometry using a fluorescently labelled anti-CCR5-specific monoclonal antibody (2D7), whereby occupancy was defined as a ratio of detectable CCR5 on CD4+ T cells following ex vivo challenge with MIP-1β. Samples incubated with excess maraviroc were used to define the total CCR5 expression given the fact that once bound to maraviroc the receptor remained on the surface of the CD4 T cells and was not internalized on stimulation with MIP-1β. Conversely, CCR5 on untreated CD4 T cells was rapidly internalized by MIP-1β. In order to prevent changes in CCR5 expression due to storage and shipping of unprocessed peripheral blood mononuclear cells, the samples were processed according to a standardized experimental MIP-1β internalization protocol at the clinical site within 60 min of collection and fixed in formaldehyde. Samples were shipped at 2–8 °C to a centralized assay laboratory (Esoterix Inc., Groningen, the Netherlands) within 24 h for flow cytometric assessment. Receptor occupancy was reported as the percentage of cell-surface-expressed CCR5 on peripheral blood lymphocytes (PBLs) that could not be downregulated when PBL-enriched plasma from patients was incubated ex vivo with recombinant MIP-1β. The percentage receptor occupancy was calculated using expression data obtained for PBL aliquots incubated with chemokine in the presence of 1 µm of maraviroc and in the absence of additional amounts of maraviroc [1]. This receptor occupancy assay is associated with an apparent background receptor binding of approximately 25%, due to a fraction of labelled antibody signal being observed following MIP-1β incubation.
Data analysis
One HIV-positive patient, in the 25-mg q.d. treatment arm, withdrew from the study on day 1. The patient had PK measurements taken, but no receptor occupancy or viral load information, and was therefore included in the population PK analysis only. Another patient was excluded from the viral load analysis as he was found to have dual/mixed tropic virus at baseline [1]; the data from this patient were included in the PK and receptor occupancy analysis only. The final dataset consisted of 2770 maraviroc blood sample measurements and 851 receptor saturation measurements. A description of data used in the analysis is presented in Table 1.
Table 1.
Number of subjects per treatment arm with PK and PD measurements (receptor occupancy and viral load) available in studies A4001002 and A4001007 (preliminary)
| Number of individuals (n = 88) | ||||
|---|---|---|---|---|
| Study | Dose | PK | Receptor occupancy | Viral load |
| Healthy Volunteers (n = 63) | Placebo | – | 8 | – |
| 3 mg b.i.d. | 5 | 5 | – | |
| 10 mg b.i.d. | 5 | 5 | – | |
| 25 mg b.i.d. | 9 | 9 | – | |
| 100 mg b.i.d. | 9 | 9 | – | |
| 300 mg b.i.d. | 9 | – | – | |
| 600 mg q.d. | 18 | – | – | |
| Total | 55 | 36 | ||
| Patients (n = 25) | Placebo | – | 8 | 8 |
| 25 mg q.d. | 9* | 8 | 8 | |
| 100 mg b.i.d. | 8 | 8 | 7† | |
| Total | 17 | 24 | 23 | |
One patient had PK measurements only on day 1 and no receptor occupancy measurements.
One patient was excluded from viral load analysis because he did not meet the inclusion criteria.
A population PK–PD analysis was performed using the software package NONMEM, version V level 1.1 and the NM-TRAN subroutines version III level 1.1, and the PREDPP model library, version IV level 1.1 [8]. The first-order estimation method was used. The statistical package S-PLUS® (version 6.2, Professional edition; Insightful, Seattle, WA, USA) was used during exploratory analysis. Simulations were performed using the Trial Simulator software, TS2® (version 2.1.2; Pharsight Corp., Mountain View, CA, USA).
Model development
Exploratory analyses were performed initially to ascertain the appropriate model structures for the PK and receptor occupancy data. Subsequently a simultaneous population PK–receptor occupancy analysis was carried out, first with the data from study A4001002 only and second, with the combined data from studies A4001002 and A4001007.
During the exploratory PK analysis, different structural models were tested, coupled with exponential models to account for interindividual variability (IIV) in the PK parameters. Both sides log-transformation with additive residual error model was used. A two-compartment disposition model was found to best describe the data.
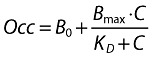
During the exploratory receptor occupancy data analysis the potential need for an effect compartment was assessed. Further, different structural models that accounted for background receptor binding were tested. The selected receptor occupancy model was a simple binding model with baseline that directly linked the plasma concentration of maraviroc to receptor occupancy (Equation 1).
 |
(1) |
where Occ is the overall receptor occupancy expressed in percentage of the maximum binding (Bmax), C is the plasma concentration (predicted or measured) of maraviroc; B0 is the background receptor occupancy at baseline; and KD is the concentration of maraviroc that results in 50% receptor occupancy. The IIV in PD parameters was assumed to follow a log-normal distribution except for Bmax, which was considered not to have IIV (since Occ was expressed in percentage of the maximum binding). An additive residual error model for receptor occupancy data was used.
Model diagnostics
Basic goodness-of-fit plots, including population and individual predictions vs. observed concentrations and the distribution of the weighted residuals over time, were used for diagnostic purposes. Changes in the objective function value (OFV) were also used to aid model selection. The OFV is proportional to −2 times the log-likelihood, and the difference in OFV between two nested models (the more complicated model can be reduced to the simpler one) is approximately χ2 distributed. A difference >3.84 in OFV (one degree of freedom) is significant at the 5% level. The difference in OFV cannot be used for formal testing for non-nested models, but it was considered that a smaller OFV for models with the same number of parameters represented an improvement in the description of the data.
Covariate analysis
To assess whether additional variables influenced the receptor occupancy response, individual empirical Bayes estimates of the parameters were generated from the ‘basic’ model (without covariate), and plots of the difference between these and the population estimates vs. covariates were constructed to visualize potential relationships. Covariates were first assessed univariately in the model, and ranked according to the drop in objective function value (ΔOFV). Variables were then included in the model in a stepwise fashion, in descending order of ΔOFV. Only variables producing a decrease in OFV >3.84 on inclusion were retained in the model. When no more covariates could be included based on this criterion, backwards deletion was carried out. A stricter criterion was then applied, only retaining physiologically plausible covariates associated with an increase in the OFV of >10.83 on their exclusion. To be retained in the final model the 90% confidence interval of the covariate effect should not include a parameters value of zero. The covariates tested were creatinine clearance, albumin, bilirubin, transaminases (aspartate aminotransferase and alanine aminotransferase) and alkaline phosphatase.
Model qualification
The mean population PK model and mean parameter estimates were implemented in the TS2® software and a visual predictive check was performed by comparing mean simulated and measured concentration–time profiles. Similarly, the simulated receptor occupancy vs. time profiles were compared with those observed.
Model assessment
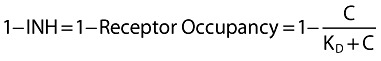
Simulations were performed using a PK–PD disease model published previously [6]. The existing PK–PD disease model was adapted by replacing the original PD model with the receptor occupancy model developed in the present analysis. Simulations based on the population mean parameters were performed; no variability was included in the simulation model. In the adapted PK–PD disease model the inhibition (antagonism) of the infectivity rate by maraviroc (1-INH) was assumed to be directly proportional to the receptor occupancy and was implemented as shown below:
 |
(2) |
where KD is the maraviroc plasma concentration that gives 50% of receptor occupancy and C is the maraviroc plasma concentration.
Results
Population pharmacokinetic/pharmacodynamic model
The maraviroc concentration–time data were appropriately described by a two-compartment model with first-order absorption and lag time. IIV was included on bioavailability (F1), lag time (ALAG1), absorption rate constant (Ka), volume of distribution from the central compartment (V2) and rate constant between the central and peripheral compartments (K23). A significant improvement of the model was also obtained when interoccasion variability (IOV) was introduced on the absorption rate constant for the three maraviroc plasma concentration–time profiles measured after the first, seventh and eleventh doses.
Exploratory graphical analysis revealed that maximum CCR5 receptor occupancy was almost reached at some points in time even at the lowest dose (i.e. 3 mg) (Figure 1). Plotting the receptor occupancy vs. predicted plasma concentration confirmed that an effect compartment was not required to describe this relationship (Figure 2). The final model used to describe the receptor occupancy data was an Emax model with baseline.
Figure 1.
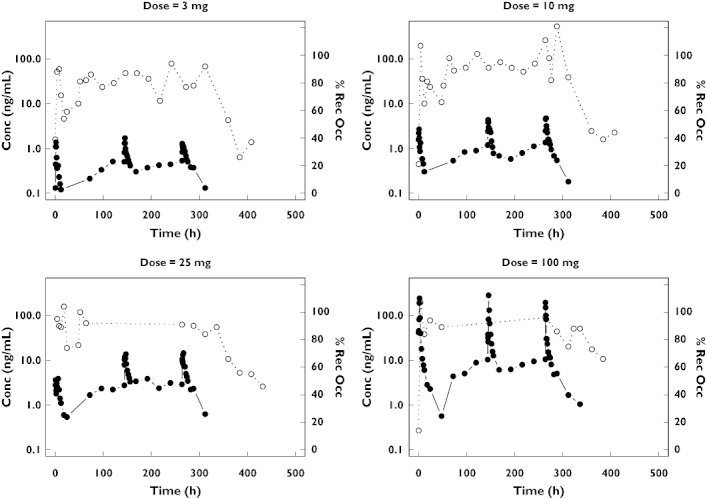
Maraviroc plasma concentrations (left axis, log scale, black circle symbol, solid line) and receptor occupancy (right axis, linear scale, open circle symbol, dotted line) time course from four healthy volunteers
Figure 2.
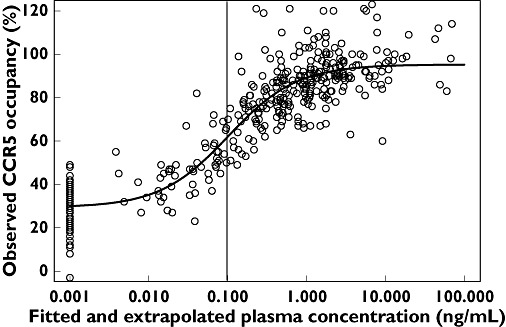
Observed CCR5 receptor occupancy vs. predicted (fitted and extrapolated) plasma concentration in healthy volunteers. The vertical line indicates the lowest limit of quantification (0.1 ng ml−1) of maraviroc in plasma (which is not the same in all cohorts). The black solid line represents a fitted Emax model with baseline. The observed baseline receptor occupancy is positioned at a maraviroc concentration of 0.001 ng ml−1
Goodness-of-fit plots and individual fits of the maraviroc plasma concentrations and receptor occupancy in healthy volunteers and in HIV-positive patients revealed that the model provides a good description of the maraviroc concentration and receptor occupancy data (not shown). Table 2 gives the estimated PK–PD parameters from the simultaneous fitting of the maraviroc plasma concentration and receptor occupancy data. All structural model parameters were precisely estimated as demonstrated by standard errors (SEs) of ≤13%, except for F1 parameters and ALAG1, where the SEs lie between 12% and 21%. The reason for the larger SEs for these two parameters is most likely the fact that there were too few subjects per dose to enable accurate estimation. The high intersubject variability in ALAG1 is probably due to the fact that some subjects had an ALAG1 close to zero and in others it was much greater than zero. The high intersubject variability and IOV of Ka demonstrates that the oral absorption is rather variable. No influence of the covariates was detected on the PK parameters.
Table 2.
Estimated population PK–PD parameters of maraviroc in healthy volunteers and HIV-positive patients
| Parameters | Symbols | Estimate | SE (CV%) | IIV (CV%) | IOV (CV%) | |
|---|---|---|---|---|---|---|
| F1 3 mg | θ1 | 0.139 | 18 | |||
| F1 10 mg | θ2 | 0.166 | 12 | |||
| F1 25 mg | θ3 | 0.265 | 16 | |||
| F1 100 mg | 1.00 | – | ||||
| F1 300 mg | θ4 | 2.27 | 17 | |||
| F1 600 mg | θ5 | 2.50 | 12 | |||
| ALAG1 | (h) | θ6 | 0.01 | 21 | >100 | |
| Ka | (h−1) | θ7 | 1.14 | 7.6 | 89 | 60 |
| K 3 mg | (h−1) | θ8 | 0.104 | 6.5 | ||
| K 10 mg | (h−1) | θ9 | 0.117 | 3.8 | ||
| K 25 mg | (h−1) | θ10 | 0.129 | 6.2 | ||
| K 100 mg | (h−1) | θ11 | 0.288 | 5.7 | ||
| K 300 mg | (h−1) | θ12 | 0.358 | 5.2 | ||
| K 600 mg | (h−1) | θ13 | 0.376 | 4.7 | ||
| V2 | (l) | θ14 | 754 | 9.5 | 31 | |
| K23 | (h−1) | θ15 | 0.074 | 6.7 | 24 | |
| K32 | (h−1) | θ16 | 0.051 | 2.2 | ||
| Emax | % | θ17 | 66.8 | 2.4 | ||
| KD | (ng ml−1) | θ18 | 0.0894 | 13 | 21 | |
| E0 | % | θ19 | 24.9 | 6 | 28 | |
| EPS1* | CV(%) | 38 | 6.5 | |||
| EPS2† | (%) | 11 | 9.3 |
Multiplicative error model.
Additive error model. IIV, interindividual variability; IOV, interoccasion variability.
The maraviroc plasma concentration that gives 50% of receptor occupancy (KD) was estimated to be 0.0894 ng ml−1. This value is below the lower limit of quantification of the assay (i.e. 0.1 ng ml−1). The fact that this value (and B0) are well estimated depends on the extrapolated maraviroc plasma concentrations predicted by the PK part of the model at the time of the receptor occupancy observation.
Model qualification
Figures 3 and 4 show the results of the simulations and demonstrate that the PK–receptor occupancy model can generally be used to predict the mean receptor occupancy–time profiles of maraviroc in a dose range of 3–600 mg. However, the model predictions for the patient study were slightly biased, as demonstrated in Figure 4. With the 25-mg q.d. treatment in patients the predicted receptor occupancy was slightly higher than that observed; whereas with the 100-mg b.i.d. treatment in patients, the predicted receptor occupancy was lower than that observed.
Figure 3.
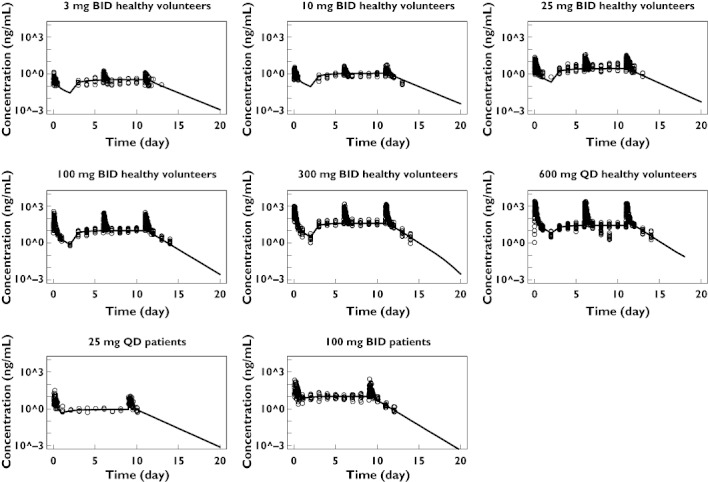
Maraviroc measured (circles) and mean simulated (solid lines) concentration–time profiles using the mean population PK–PD model parameters
Figure 4.
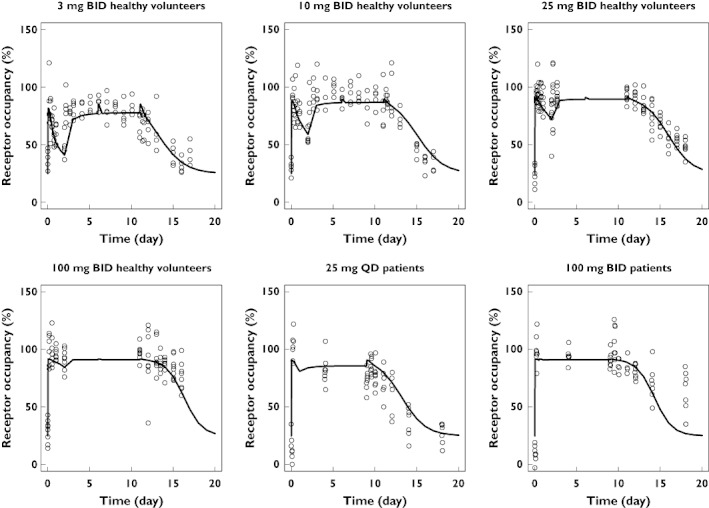
Maraviroc measured (circles) and mean simulated (solid line) receptor occupancy vs. concentration using the mean population PK–PD model parameters
Model assessment
Under the hypothesis of a direct relationship between receptor occupancy and inhibition of the infectivity rate, simulations of viral load were performed with the receptor occupancy KD fixed to 0.0894 ng ml−1, the value estimated from the population PK–receptor occupancy analysis. The simulated decrease in viral load as a function of time was markedly overpredicted compared with the decrease observed (Figure 5), demonstrating that CCR5 receptor occupancy by an antagonist such as maraviroc is not a direct measure of the operational inhibition of the infectivity rate of the virus.
Figure 5.
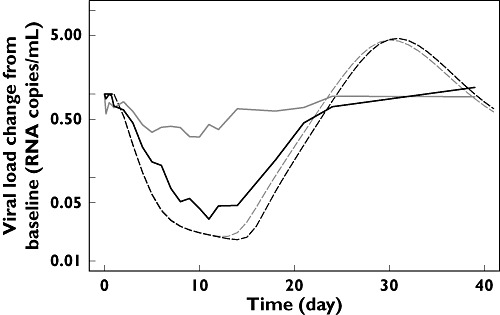
Simulated (dotted lines) and observed (solid lines) viral load–time profiles for the two dosage regimens (25 mg q.d. grey; 100 mg b.i.d. black) evaluated in the patient's study. The assumption is that the inhibition of the infectivity rate of the virus is directly proportional to the CCR5 receptor occupancy by maraviroc (simulation with the KD fixed to the estimated value of 0.0894 ng ml−1)
Discussion
Maraviroc is a selective, small molecule noncompetitive CCR5 antagonist with potent in vivo anti-HIV activity. Maraviroc binds to CCR5 receptors on CD4+ cells, blocking HIV entry into the cell. The relevance of including the measurement of the receptor occupancy as a mechanism-based biomarker of efficacy (i.e. decrease in viral load) in clinical trials was raised very early in the development of maraviroc. Consequently, CCR5 receptor occupancy by maraviroc has been measured in Phase 1 clinical trials in healthy volunteers in order to characterize binding to the receptor. Receptor occupancy was also measured in patients on short-term monotherapy to evaluate the relationship between receptor blockade and viral load decrease as a function of time.
An initial graphical analysis of the data obtained in these trials revealed that CCR5 receptor occupancy was around 60% at a dose as low as 3 mg b.i.d., which was predicted to be an ineffective dose, as plasma concentration was below the in vitro antiviral IC90. At higher doses of maraviroc which resulted in a decrease in viral load, receptor occupancy values were close to saturation (Figure 2).
A population PK–receptor occupancy model was developed in order to describe the data and to perform some simulations to evaluate if receptor occupancy measurements could predict decrease in viral load after treatment with maraviroc. The development of a definitive population PK model for maraviroc was not the aim of this analysis. The population PK model developed for maraviroc in the present analysis was used solely to predict plasma concentrations that were subsequently used to characterize the PK–receptor occupancy relationship. A full and comprehensive population PK analysis of Phase 1/2a is described elsewhere [9]. A significant number of receptor occupancy measurements were obtained at times when the maraviroc concentrations were below the limit of quantification. To be able to use this binding information in the analysis, the maraviroc concentrations were extrapolated at the time the receptor occupancy was measured based on the structural PK model and the estimated individual PK parameters. This extrapolation illustrates one advantage of using a PK–PD model-based approach which can predict PK concentrations at the times of the receptor occupancy observations even if the PK measurements were obtained at different times or were not quantifiable. To minimize possible biases in this approach, the PK and receptor occupancy observations were fitted simultaneously, so that both the PK and receptor occupancy information was shared during the estimation of the model parameters.
The PK–PD analysis revealed that the in vivo affinity of maraviroc for the CCR5 receptors is very high (KD of 0.089 ng ml−1). This high affinity explains why high CCR5 receptor occupancies were already reached at the lowest dose (i.e. 3 mg b.i.d.) tested in the healthy volunteer study.
The previous estimate of the IC50 value of around 8 ng ml−1 for decrease in viral load is clearly different from the currently estimated KD value. The magnitude of this discrepancy was further illustrated by comparing observed and simulated viral load–time profiles using the adapted PK–PD disease model (Figure 5); the new adapted model based on CCR5 receptor occupancy grossly overpredicted the effect of maraviroc on viral load. This indicates that the newly estimated KD value for CCR5 receptor occupancy does not represent the operational inhibition of the system. It can be suggested that it is the few remaining free receptors that should probably be taken into account in order to predict drug efficacy accurately. A more detailed theoretical explanation of the discrepancy between the KD and IC50 values, based on the operational model of (ant-) agonism, can be found in a separate publication [10].
Based on the results of this analysis and taking into consideration the relatively high imprecision of measurements in the upper asymptotic part of the maraviroc concentration vs. percent CCR5 occupancy curve, and where the effect on viral load seems to occur, it can be deduced that routine monitoring of CCR5 receptor occupancy as a biomarker for maraviroc efficacy at an individual level will not be informative.
Conclusion
The comparison of the receptor occupancy and viral load drop in patients reveals that maraviroc receptor occupancy close to the maximum is required to induce a significant decrease in viral load. Considering the imprecision of the measurement in the upper flat part of the maraviroc concentration vs. percent CCR5 occupancy curve and where the effect on viral load seems to occur, it can reasonably be concluded that routine monitoring of receptor occupancy as a biomarker for maraviroc efficacy will not be helpful.
Competing interests
M.C.R., P.D., I.J., T.M.J., S.A. and E.v.d.R. were employees of Pfizer Ltd at the time of this research. P.J. was a paid consultant to Pfizer Ltd.
The authors thank the investigators: Drs Georges Weissgerber, Gerd Fätkenheuer, Anton L. Pozniak, Margaret A. Johnson, Andreas Plettenberg, Schlomo Staszewski, Andy I. M. Hoepelman, Michael S. Saag, Frank D. Goebel, Jürgen K. Rockstroh, Bruce J. Dezube and Mike Youle, and study site staff as well as patients and volunteers. We thank Dr Don Nichols, Head of Clinical Pharmacology at Pfizer, Sandwich, UK, for his guidance and support during this project. We are also grateful to Janet Wade (Exprimo) for her comments on this paper. P.J. from Exprimo NV was contracted to perform the model development and analysis on behalf of Pfizer Ltd. Editorial assistance was provided Janet E. Matsuura, PhD at Complete Healthcare Communications, Inc., and was funded by Pfizer Inc., New York, NY, USA.
REFERENCES
- 1.Fatkenheuer G, Pozniak AL, Johnson MA, Plettenberg A, Staszewski S, Hoepelman AI, Saag MS, Goebel FD, Rockstroh JK, Dezube BJ, Jenkins TM, Medhurst C, Sullivan JF, Ridgway C, Abel S, Youle M, van der Ryst E. Efficacy of short-term monotherapy with maraviroc, a new CCR5 antagonist, in patients infected with HIV-1. Nat Med. 2005;11:1170–2. doi: 10.1038/nm1319. [DOI] [PubMed] [Google Scholar]
- 2.Dorr PK, Dobbs S, Rickett G, Lewis B, Macartney M, Westby M, Perros M. In vitro evaluation of prolonged CCR5 occupancy by small molecule antagonists with anti-HIV activity. Abstr Intersci Conf Antimicrob Agents Chemother Intersci Conf Antimicrob Agents Chemother. 2003;43:F–1462. [Google Scholar]
- 3.Pullen S, Sale H, Napier C, Mansfield R, Holbrook M. Maraviroc is a slowly reversible antagonist at the human CCR5 in a CRE luciferase reporter gene assay (abstract 504). 13th Conference on Retroviruses and Opportunistic Infections; 2006 February 5–8; Denver, CO. [Google Scholar]
- 4.Dorr P, Westby M, Dobbs S, Griffin P, Irvine B, Macartney M, Mori J, Rickett G, Smith-Burchnell C, Napier C, Webster R, Armour D, Price D, Stammen B, Wood A, Perros M. Maraviroc (UK-427 857), a potent, orally bioavailable, and selective small-molecule inhibitor of chemokine receptor CCR5 with broad-spectrum anti-human immunodeficiency virus type 1 activity. Antimicrob Agents Chemother. 2005;49:4721–32. doi: 10.1128/AAC.49.11.4721-4732.2005. [DOI] [PMC free article] [PubMed] [Google Scholar]
- 5.Dorr P, Macartney M, Rickett G, Smith-Burchnell C, Dobbs S, Mori J, Griffen P, Lok J, Irvine R, Westby M, Hitchcock C, Stammen B, Price D, Armour D, Wood A, Perros M. UK-427 857, a novel small molecule HIV entry inhibitor is a specific antagonist of the chemokine receptor CCR5 (abstract 12). 10th Conference on Retroviruses and Opportunistic Infections; 2003 February 10–14; Boston, MA. [Google Scholar]
- 6.Rosario MC, Jacqmin P, Dorr P, van der Ryst E, Hitchcock C. A pharmacokinetic-pharmacodynamic disease model to predict in vivo antiviral activity of maraviroc. Clin Pharmacol Ther. 2005;78:508–19. doi: 10.1016/j.clpt.2005.07.010. [DOI] [PubMed] [Google Scholar]
- 7.Rosario MC, Poland B, Sullivan J, Westby M, van der Ryst E. A pharmacokinetic–pharmacodynamic model to optimize the phase IIa development program of maraviroc. J Acquir Immune Defic Syndr. 2006;42:183–91. doi: 10.1097/01.qai.0000220021.64115.37. [DOI] [PubMed] [Google Scholar]
- 8.Beal SL, Sheiner LB. NONMEM User's Guide. San Francisco, CA: NONMEM Project Group; 1992. [Google Scholar]
- 9.Chan PLS, Weatherley B, McFadyen L. A population pharmacokinetic meta-analysis of maraviroc in healthy volunteers and asymptomatic HIV-infect subjects. Br J Clin Pharmacol. 2008;65(Suppl. 1):76–85. doi: 10.1111/j.1365-2125.2008.03139.x. [DOI] [PMC free article] [PubMed] [Google Scholar]
- 10.Jacqmin P, McFadyen L, Wade JR. A receptor theory-based semi-mechanistic PD model for the CCR5 noncompetitive antagonist maraviroc. Br J Clin Pharmacol. 2008;65(Suppl. 1):95–106. doi: 10.1111/j.1365-2125.2008.03141.x. [DOI] [PMC free article] [PubMed] [Google Scholar]