

Abstract
Aims
To assess the potential of known CYP3A4 inducers, with and without CYP3A4 inhibitors, to alter the pharmacokinetic profile of maraviroc.
Methods
Two separate, open, randomized, placebo-controlled studies were conducted in healthy subjects. Study 1 was a 28-day parallel-group study with three treatment groups of 12 subjects each. On days 1–7, all subjects received maraviroc 100 mg b.i.d.; on days 8–21, subjects received maraviroc 100 mg b.i.d. plus either rifampicin 600 mg q.d., efavirenz (EFV) 600 mg q.d., or placebo q.d. as assigned; on days 22–28, the maraviroc dose was increased to 200 mg b.i.d. for patients receiving either rifampicin or EFV. Study 2 was a 21-day, two-way crossover study with three cohorts (12 subjects per cohort). On days 1–21, subjects received maraviroc 300 mg b.i.d. and boosted lopinavir (LPV/r, lopinavir 400 mg + ritonavir 100 mg) or placebo b.i.d. in cohort 1, maraviroc 100 mg b.i.d. and boosted saquinavir (SQV/r, saquinavir 1000 mg + ritonavir 100 mg) or placebo b.i.d. in cohort 2, and maraviroc 100 mg b.i.d. and 1000 mg saquinavir + LPV/r (400 mg/100 mg) or placebo b.i.d. in cohort 3. On days 8–21, subjects in all three cohorts also received EFV 600 mg or placebo q.d.
Results
Maraviroc (100 mg b.i.d.) exposure (AUC12 and Cmax) was reduced in the presence of rifampicin and EFV by approximately 70% and 50%, respectively. Maraviroc AUC12 and Cmax approached preinduction values when the maraviroc dose was increased to 200 mg b.i.d. for both the rifampicin-treated and EFV-treated groups. Co-administration of LPV/r with maraviroc (300 mg b.i.d.) resulted in geometric mean ratios (GMRs) of 395% and 197% for maraviroc AUC12 and Cmax, respectively, compared with placebo; addition of EFV resulted in GMRs of 253% and 125% for AUC12 and Cmax, respectively. Co-administration of SQV/r with maraviroc (100 mg b.i.d.) resulted in GMRs of 977% and 478% for maraviroc AUC12 and Cmax, respectively, compared with placebo; addition of EFV resulted in GMRs of 500% and 226% for AUC12 and Cmax, respectively. No pharmacokinetic data are reported for cohort 3 because all subjects were discontinued during period 1 due to poor toleration of the drug regimen. There were no serious adverse events reported in either study, and most adverse events were mild or moderate in severity and resolved without intervention.
Conclusion
As expected with a CYP3A4 substrate, maraviroc exposure (Cmax and AUC12) was significantly reduced by the known CYP3A4 inducers, rifampicin and EFV, by approximately 70% and 50%, respectively. Upward adjustment of the maraviroc dose during co-administration with rifampicin or EFV appears to compensate for this reduction. Protease inhibitors (PIs) significantly increased maraviroc exposure; however, the addition of EFV to the maraviroc + PI regimens reduced the magnitude of PI-mediated increase in maraviroc exposure (by approximately 50%), but the net effect was still CYP3A4 inhibition.
Keywords: CYP3A4, drug interactions, inducers, maraviroc, pharmacokinetics
Introduction
The CCR5 chemokine receptor is the primary coreceptor utilized by transmitted human immunodeficiency virus (HIV) during initial infection. It also mediates the spread of viral infection by facilitating viral entry into host cells in the majority of patients throughout all stages of disease in HIV-infected patients [1]. Maraviroc, a CCR5 antagonist recently approved, for the treatment of HIV infection, has been shown to be well tolerated in clinical studies [2]. Maraviroc is extensively metabolized, primarily by the cytochrome P450 3A4 enzyme (CYP3A4) [3]. Maraviroc is also known to be a substrate for P-glycoprotein (Pgp) [3], which is thought to contribute to its nonproportional pharmacokinetics by limiting its bioavailability in a dose-dependent manner [3]. Because CYP3A4 and Pgp have been shown to have overlapping substrate specificities [4], it is not surprising that maraviroc appears to be a substrate of both of these key regulatory proteins. Drugs that induce or inhibit CYP3A4 or Pgp have the potential to alter significantly the pharmacokinetic profile of maraviroc and, consequently, its efficacy and safety. It is therefore important to examine the potential interactions with drugs known to influence CYP3A4 expression and/or activity, especially those commonly used in the treatment of HIV-infected patients.
Rifampicin is a bacterial RNA polymerase inhibitor used to treat tuberculosis and nontuberculosis mycobacterial infections, both of which may arise as comorbid conditions in HIV-infected patients. Rifampicin is a potent inducer of CYP3A4 [5] and Pgp and can therefore significantly decrease systemic exposure of co-administered drugs that are substrates of these proteins. Efavirenz (EFV) is a non-nucleoside reverse transcriptase inhibitor (NNRTI) used widely in combination with other antiretroviral drugs to treat HIV-infected patients. EFV is also a known inducer of CYP3A4, although less potent than rifampicin [6]. In animal studies, EFV had no influence on intestinal Pgp function [7].
The HIV-1 protease inhibitors (PIs) lopinavir (LPV), ritonavir (RTV), and saquinavir (SQV) are common components of highly active antiretroviral therapy treatment regimens and are also known inhibitors of CYP3A4/Pgp [8, 9]. Although EFV is not typically co-administered with PIs in early-stage HIV infection, NNRTIs and PIs are sometimes co-administered in late-stage infection when treatment options are fewer due to drug resistance and tolerability issues.
This paper describes the results of two studies. The first was conducted to investigate the influence of rifampicin and EFV on maraviroc pharmacokinetics and determine whether maraviroc dose adjustment could compensate for potential effects of the metabolic inducers. A second study was conducted to investigate the effect of PIs on the pharmacokinetics of maraviroc in the presence and absence of EFV. Both studies were conducted in HIV negative healthy volunteers.
Methods
Subjects
Subjects in study 1 were healthy men or surgically sterilized women. Study 2 included men and women who were either surgically sterilized or at least 2 years postmenopausal. All subjects were 18–45 years of age, weighing between 60 and 100 kg (men) or 50 and 100 kg (women), and had a body mass index of 18–28 kg m−2.
Subjects were excluded from the study if they had any evidence of clinically significant disease or allergies, especially drug hypersensitivity. Subjects were also excluded who were taking or had taken any prescribed or over-the-counter medication (with the exception of paracetamol, up to 3.0 g day−1) in the 3 weeks prior to the first dose of study medication; had received any experimental drug within the previous 4 months; had evidence of drug abuse or drank more than 21 (women) or 28 units (men) of alcohol per week; smoked more than five cigarettes per day; had donated blood during the previous 2 months or intended to donate blood or blood products during the study or within 2 months following the completion of the study; tested positive for HIV-1, hepatitis C virus, or hepatitis B virus, or were pregnant or lactating. All subjects were advised of the risks and benefits of participation and gave written informed consent. Studies were conducted in compliance with the ethical principles as outlined in the Declaration of Helsinki, and the study protocols were approved by an Institutional Review Board or the Independent Ethics Committee at the study centres.
Study designs
Study 1 was a 28-day, open, randomized, placebo-controlled, parallel-group study with three treatment groups, each having 12 subjects. The study comprised a screening visit, one treatment period, and a follow-up visit. Subjects were randomized to one of the three treatment groups. The treatment groups were as follows: maraviroc + placebo (group 1); maraviroc + rifampicin (group 2); maraviroc + EFV (group 3). A 100-mg b.i.d. dose of maraviroc was used in study 1 because this was expected to be a clinically relevant dose at the time the study was conducted. A detailed schematic for dosing schedules is presented in Figure 1A. On day 28, subjects took only the morning dose of maraviroc along with placebo, rifampicin or EFV. On days 7, 21 and 28, subjects fasted from midnight until 4 h post morning dose.
Figure 1.
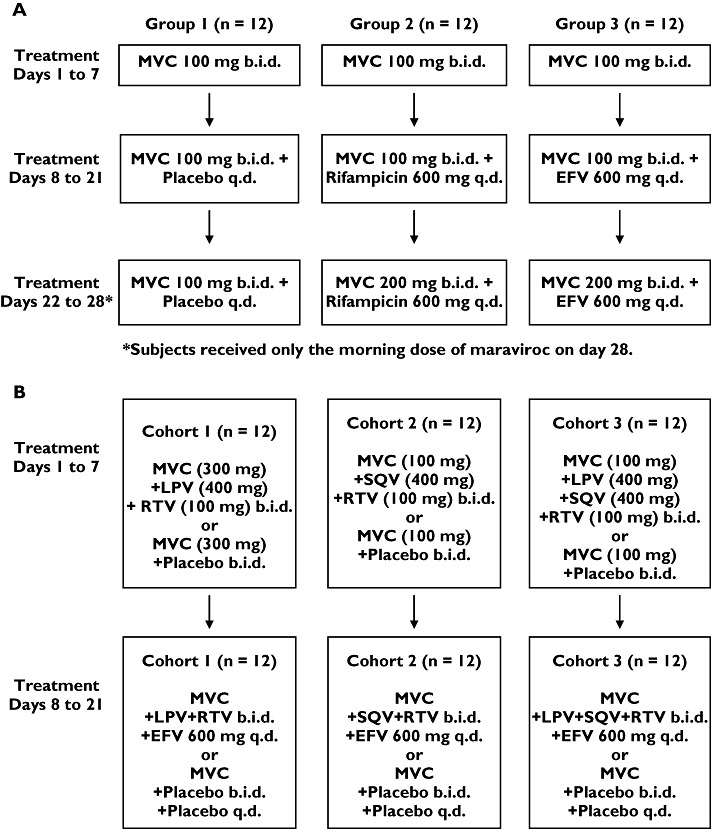
Dosing schedule for (A) study 1 and (B) study 2. MVC, maraviroc
Study 2 was a 21-day, open, randomized, placebo-controlled, two-way crossover study. The study comprised a screening visit, two treatment periods, and a follow-up visit. The two treatment periods were separated by at least 14 days. There were three cohorts (12 subjects per cohort) and two treatment sequences per cohort. Subjects were randomized to one of six sequences (Figure 1B). In this study, conducted after study 1, a 300-mg b.i.d. dose was used as it was a well-tolerated dose that was expected to be more clinically relevant than 100 mg b.i.d. based on data generated at that time. However, cohorts in study 2 that included SQV in the regimen retained a maraviroc dose of 100 mg b.i.d. because it had previously been observed in a separate study that co-administration of RTV-boosted SQV (SQV/r) with maraviroc caused marked increases in maraviroc exposure (∼eightfold) [10]. In each cohort, subjects received maraviroc + placebo in one treatment period, and maraviroc + inhibitors/inducers in the other treatment period.
In study 2, during the 48 h leading up to the start of drug treatment and throughout each study period, subjects were asked not to consume caffeine, methylxanthines, St John's wort, garlic supplements, grapefruit, grapefruit juice, alcohol, or undertake any unaccustomed exercise. A standard diet was provided to subjects throughout both studies. In study 1, water was permitted except during the 1 h pre and post morning dose. Subjects fasted from 2 h predose until 1 h postdose (both studies) and had a standard lunch and dinner approximately 6 h and 13 h post morning dose, and were allowed a light snack during the afternoon and evening. In study 1, subjects fasted until 4 h postdose on days 7, 21 and 28. On all other days subjects were not allowed to eat <2 h before, or within 1 h after dosing. In study 2, the morning dose of maraviroc was given under fasted conditions, with breakfast served 1 h after dosing. The evening dose was taken 12 h after the morning dose. In both studies, subjects received CYP3A4 inducers (study 1, days 8–28; study 2, days 8–21) at the same time as the morning dose of maraviroc, whereas the CYP3A4 inhibitors (PIs) in study 2 were administered following the breakfast and the evening snack (approximately 1.5 h after the morning and evening dose of maraviroc, respectively). Timings of all assessments are relative to the morning dose of maraviroc.
Pharmacokinetic assessments
Blood and urine samples
In study 1, blood samples were collected pre morning dose on days 1, 4 and 7–28; at intervals up to 12 h post morning dose on days 7 and 21; and at intervals up to 48 h post morning dose on day 28. In study 2, blood samples were collected pre morning dose of maraviroc on days 1, 3–8 and 10–21. Samples were also collected at intervals up to 12 h post morning dose on days 7 and 21. Urine samples in study 1 were collected from 0 to 12 h postdose on days 7 and 21, with total volumes recorded. Aliquots of 10 ml were stored at −20°C.
Assay details
Plasma samples in study 1 were isolated by centrifugation and analysed at Maxxam Analytics, Inc. (Mississauga, ON, Canada). Samples were prepared using solid-phase extraction, and maraviroc plasma concentrations were determined using liquid chromatography and atmospheric pressure chemical ionization and tandem mass spectrometry (LC/MS/MS). Overall method imprecision values for the analysis of plasma quality control (QC) samples were 5.7%, 3.3% and 3.5% for maraviroc at target concentrations of 1, 90 and 180 ng ml−1, respectively. The mean inaccuracy of the assay ranged from −5.6% to 4.0% over the QC concentration range. The calibration range was 0.5–200 ng ml−1. In study 2, maraviroc plasma concentrations were determined by Tandem Laboratories (West Trenton, NJ, USA) using LC/MS/MS. Overall method imprecision values for the analysis of plasma QC samples were 8.0%, 6.6% and 4.9% at target maraviroc concentrations of 1.5, 150 and 400 ng ml−1, respectively. The mean inaccuracy of the assay ranged from 0.0% to 1.8% and the calibration range was 0.5–500 ng ml−1.
To assess effects on CYP3A4 activity, quantitative analysis of 6β-OH cortisol and cortisol in urine samples (study 1) was performed at BAS Analytics, Ltd (Kenilworth, UK) using LC/MS/MS. Quantification was considered acceptable if both the intrabatch coefficient of variation and inaccuracy (bias) were <20% for the lower limit of quantification and low QC concentration, and <15% for other concentrations. The calibration range was 10–2000 ng ml−1 and 5–1000 ng ml−1 for 6β-OH cortisol and cortisol, respectively.
Safety assessments
Methods for assessment of safety were similar in both studies. Information on adverse events (AEs) was collected throughout the study. AEs were considered as potentially related to study medication for up to 7 days after the final dose of maraviroc. All subjects underwent a urine drug screen to test for drugs of abuse at screening and at specified times during the studies. Subjects with a positive result did not enter into or continue in the studies. Physical examinations, supine and standing blood pressure/pulse rate measurements, 12-lead electrocardiograms (ECGs), and laboratory safety tests were conducted at appropriate intervals throughout each study.
Statistical analysis
In study 1, it was estimated that a sample size of 12 subjects in each group would provide 90% confidence intervals (CIs) of ±0.322 and ±0.487 on the natural log scale for area under the plasma concentration–time curve from 0 to 12 h (AUC12) and maximum observed plasma concentration (Cmax), respectively, with 80% coverage probability. Assuming no change in AUC12 and Cmax, this related to 90% CIs of (76.6%, 131%) and (67.0%, 149%) for AUC12 and Cmax, respectively. Assuming an 80% decrease in AUC12 and Cmax, this related to 90% CIs of (15.3%, 26.1%) and (13.4%, 29.8%) for AUC12 and Cmax, respectively.
Log-transformed AUC12 and Cmax and untransformed time to Cmax (Tmax) were subjected to an analysis of variance (anova) including terms for treatment group, subject, day, and the treatment by day interaction term. Comparisons were made between day 7 and day 21, and day 7 and day 28. Two separate anovas were performed, one to analyse data from days 7 and 21, and one to analyse data from days 7 and 28. Subjects must have had data for both days being compared to be included in these analyses. The differences between treatment means, standard errors associated with these differences, and 90% CIs for the differences were presented on the log scale for AUC12 and Cmax and the nominal scale for Tmax. For AUC12 and Cmax, the ratio between the geometric means and the 90% CIs for this ratio were also presented.
In study 2, it was estimated that a sample size of 12 subjects in each cohort would provide 90% CIs of ±0.216 and ±0.372 on the natural log scale for AUC12 and Cmax, respectively, with 80% coverage probability. Assuming no change in AUC12 and Cmax, it was estimated that the 90% CIs would be (80.6%, 124%) and (68.9%, 145%) for AUC12 and Cmax, respectively. Assuming a 300% increase in AUC12 and Cmax, it was estimated that the 90% CIs would be (322%, 496%) and (276%, 580%) for AUC12 and Cmax, respectively.
Log-transformed AUC12 and Cmax, and untransformed Tmax were subjected to anova including terms for sequence, subject within sequence, period, and treatment. Separate anovas were produced for each cohort of the study and within each cohort, separate anovas were produced for day 7 comparisons and day 21 comparisons. The differences between treatment means, standard errors associated with these differences, and 90% CIs for the differences were presented on the log scale for AUC12 and Cmax and the nominal scale for Tmax. For AUC12 and Cmax, the ratio between the geometric means and the 90% CIs for this ratio were also presented.
The model assumptions of constant variance and normality were assessed for both studies through examination of plots of the residuals.
Results
Subjects
In study 1, 36 subjects entered and completed the study, and all were included in the pharmacokinetic and safety analyses. Although inclusion criteria for the study allowed women to participate, all enrolled subjects were men with a mean age of 31 years (range 18–45 years) and a mean weight of 77 kg (range 61–94 kg). There were 32 White subjects, two Black subjects, one Asian subject and one subject of mixed race.
In study 2, 36 subjects entered the study. There were 33 men and three women, with a combined mean age of 28 years (range 18–44 years), and mean weight of 76 kg (range 60–109 kg). In cohort 1, two subjects withdrew during period 1, one subject receiving maraviroc + placebo and one subject receiving maraviroc + LPV/r + EFV due to treatment-related AEs. In cohort 2, one subject withdrew during period 1 (maraviroc + SQV/r + EFV) due to nontreatment-related upper respiratory tract infection, and one subject discontinued on day 1 due to withdrawal of consent following maraviroc + placebo. In cohort 3, 12 subjects started treatment (six per sequence), but all were discontinued by the investigator by day 8 due to poor toleration (including gastrointestinal AEs and elevated total bilirubin) in the sequence group receiving maraviroc + SQV/LPV/r in period 1.
Pharmacokinetics
In study 1, visual inspection of individual trough maraviroc plasma concentrations suggested that maraviroc reached steady state by treatment day 7. Maraviroc AUC12 and Cmax were significantly reduced after concurrent administration of rifampicin and EFV (Table 1). Comparison of maraviroc exposure on day 21 (including inducer) vs. day 7 (excluding inducer) reveals a geometric mean ratio (GMR) for AUC12 of 32.5% and 48.7% for rifampicin and EFV, respectively, with very similar ratios for Cmax (Table 2). The maraviroc dose was increased from 100 mg b.i.d. to 200 mg b.i.d. on day 22 for both the rifampicin-treated and EFV-treated groups, after which maraviroc AUC12 and Cmax approached values observed before addition of the CYP3A4 inducers to the dosing regimen (Figures 2 and 3). Plasma maraviroc concentrations again reached steady state by day 28 (day 7 of adjusted dose), as seen in the illustration of trough concentrations (Figure 4). Mean Tmax and terminal elimination half-life (t1/2) values were similar across treatment groups (approximately 3 h and 13 h, respectively).
Table 1.
Summary of maraviroc plasma pharmacokinetic parameters (study 1)
| Maraviroc + placebo | Maraviroc + rifampicin | Maraviroc + EFV | |||||||
|---|---|---|---|---|---|---|---|---|---|
| Parameter | Day 7 | Day 21 | Day 28 | Day 7 | Day 21 | Day 28 | Day 7 | Day 21 | Day 28 |
| AUC12 (ng ml−1 h)* | |||||||||
| Mean (CV %) | 550 (28) | 624 (35) | 580 (50) | 695 (24) | 256 (35) | 723 (24) | 543 (27) | 300 (28) | 624 (28) |
| Cmax (ng ml−1)* | |||||||||
| Mean (CV %) | 138 (41) | 153 (49) | 138 (84) | 182 (53) | 60.9 (50) | 176 (30) | 140 (43) | 68.1 (45) | 163 (43) |
| Tmax (h)† | |||||||||
| Mean (± SD) | 2.92 (0.79) | 2.58 (1.72) | 3.38 (1.64) | 3.25 (1.14) | 2.21 (1.45) | 2.33 (1.21) | 3.25 (1.59) | 2.92 (1.51) | 2.58 (1.66) |
| t1/2 (h)† | |||||||||
| Mean (± SD) | nc | nc | 12.9 (2.2) | nc | nc | 14.1 (2.6) | nc | nc | 13.4 (2.9) |
Unadjusted geometric means.
Unadjusted arithmetic means. CV, coefficient of variation; EFV, efavirenz; nc, not calculated; SD, standard deviation. All three treatment groups received maraviroc 100 mg b.i.d. for days 1–21. For days 22–28, group 1 continued on maraviroc 100 mg + placebo, and maraviroc dose was increased to 200 mg b.i.d. for groups 2 and 3. Rifampicin 600 mg q.d. (group 2) and EFV 600 mg q.d. (group 3) were administered on days 8–28.
Table 2.
Summary of statistical analysis of maraviroc plasma pharmacokinetic parameters (study 1)
| Maraviroc + rifampicin | Maraviroc + EFV | ||||
|---|---|---|---|---|---|
| Parameter | Day 21 vs. day 7 | Day 28 vs. day 7 | Day 21 vs. day 7 | Day 28 vs. day 7 | |
| AUC12 (ng ml−1 h) | Ratio % (90% CI) | 32.5 (27.6, 38.3) | 98.8 (78.6, 124) | 48.7 (41.4, 57.3) | 109 (86.8, 137) |
| Cmax (ng ml−1) | Ratio % (90% CI) | 30.0 (21.0, 43.0) | 96.7 (64.3, 145) | 43.6 (30.4, 62.4) | 116 (77.4, 175) |
| Tmax (h) | Difference (90% CI) | −0.71 (−2.17, 0.76) | −1.38 (−2.81, 0.06) | 0 (−1.46, 1.46) | −1.13 (−2.56, 0.31) |
All three treatment groups received maraviroc 100 mg b.i.d. for days 1–21. For days 22–28, group 1 continued to receive maraviroc 100 mg + placebo, and maraviroc dose was increased to 200 mg b.i.d. for groups 2 and 3. Rifampicin 600 mg q.d. (group 2) and EFV 600 mg q.d. (group 3) were administered on days 8–28. EFV, efavirenz.
Figure 2.
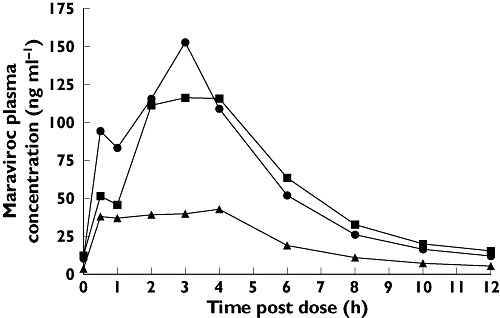
Influence of rifampicin on maraviroc (MVC) plasma pharmacokinetics. Day 7 (100 mg MVC) (▪); Day 21 (100 mg MVC + Rifampicin) (▴); Day 28 (200 mg MVC + Rifampicin) ( )
)
Figure 3.
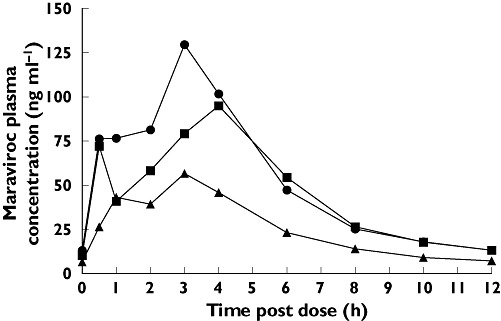
Influence of efavirenz (EFV) on maraviroc (MVC) plasma pharmacokinetics. Day 7 (100 mg MVC) (▪); Day 21 (100 mg MVC + EFV) (▴); Day 28 (200 mg MVC + EFV) ( )
)
Figure 4.
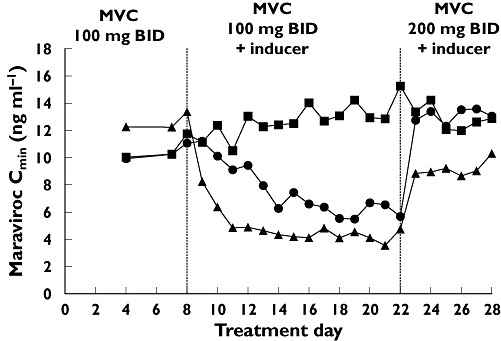
Maraviroc (MVC) plasma trough concentrations before the addition of CYP3A4 inducers to the treatment regimen (days 1–7), after addition of inducers (days 8–21), and after maraviroc dose adjustments (days 22–28). MVC + Placebo (▪); MVC + Rifampicin (▴); MVC + efavirenz (EFV) ( )
)
Assessment of the 6β-OH cortisol/cortisol ratio between days 7 and 21 indicated that CYP3A4 activity was strongly induced by rifampicin and moderately induced by EFV (Table 3).
Table 3.
Summary of urinary 6β-OH cortisol/cortisol ratio (study 1)
| 6β-OH Cortisol/cortisol ratio | Treatment group Maraviroc + placebo | Maraviroc + rifampicin | Maraviroc + EFV |
|---|---|---|---|
| Day 7 | 5.47 (53) | 5.72 (35) | 5.82 (29) |
| Mean* (CV %) | |||
| Day 21 | 4.42 (32) | 28.7 (37) | 11.2 (38) |
| Mean* (CV %) | |||
| Day 21/day 7 ratio† | 0.79 | 5.23 | 1.93 |
Unadjusted geometric mean.
Ratio of adjusted means. EFV, efavirenz; CV, coefficient of variation.
In study 2, maraviroc was administered with inhibitors of CYP3A4 (days 1–7) or with a combination of CYP3A4 inhibitors and inducers (days 8–21), all of which are antiretroviral drugs commonly used in the treatment of HIV-infected patients. Twice daily dosing with LPV/r + maraviroc 300 mg b.i.d. resulted in a GMR of 395% and 197% for AUC12 and Cmax, respectively, compared with placebo (Tables 4 and 5). The boosting effect of LPV/r was diminished when EFV (CYP3A4 inducer) was added to the regimen in cohort 1 on days 8–21 (Figure 5), resulting in GMRs for AUC12 and Cmax of 253% and 125%, respectively. There was no clinically relevant difference in Tmax when maraviroc was co-administered with LPV/r or LPV/r + EFV.
Table 4.
Summary of maraviroc pharmacokinetic parameters (study 2)
| Parameter | Day | Cohort 1 MVC 300 mg b.i.d. + placebo | CV (%)* or SD† | MVC 300 mg b.i.d. + LPV/r + EFV ‡ | CV (%)* or SD† | Cohort 2 MVC 100 mg b.i.d. + placebo | CV (%)* or SD† | MVC 100 mg b.i.d. + SQV/r + EFV‡ | CV (%)* or SD† |
|---|---|---|---|---|---|---|---|---|---|
| AUC12 | 7 | 2500 | 29 | 10 030 | 25 | 486 | 45 | 4850 | 25 |
| (ng ml−1 h)* | 21 | 2450 | 33 | 6 200 | 31 | 543 | 58 | 2710 | 32 |
| Cmax | 7 | 914 | 28 | 1 810 | 22 | 187 | 55 | 888 | 25 |
| (ng ml−1)* | 21 | 854 | 41 | 1 070 | 34 | 194 | 68 | 437 | 36 |
| Tmax | 7 | 2.00 | 0 | 2.36 | 1.2 | 1.5 | 0.67 | 2.18 | 0.60 |
| (h)† | 21 | 2.00 | 0 | 2.15 | 1.1 | 1.85 | 0.47 | 2.15 | 1.11 |
Unadjusted geometric means.
Unadjusted arithmetic means.
EFV administered only on treatment days 8–21 during treatment period. CV, coefficient of variation; EFV, 600 mg efavirenz q.d.; LPV/r, lopinavir 400 mg b.i.d. + ritonavir 100 mg b.i.d.; SQV/r, saquinavir 400 mg b.i.d. + ritonavir 100 mg b.i.d.
Table 5.
Summary of statistical analysis of maraviroc plasma pharmacokinetic parameters (study 2)
| Cohort 1 | Cohort 2 | ||||
|---|---|---|---|---|---|
| Maraviroc 300 mg b.i.d. + LPV/r + EFV*vs. maraviroc 300 mg b.i.d. + placebo | Maraviroc 100 mg b.i.d. + SQV/r + EFV*vs. maraviroc 100 mg b.i.d. + placebo | ||||
| Comparison Parameter | Day 7 | Day 21 | Day 7 | Day 21 | |
| AUC12 (ng ml−1 h) | Ratio percentage (90% CI) | 395 (343, 456) | 253 (224, 287) | 977 (787, 1210) | 500 (426, 587) |
| Cmax (ng ml−1) | Ratio percentage (90% CI) | 197 (166, 234) | 125 (101, 155) | 478 (341, 671) | 226 (164, 311) |
| Tmax (h) | Difference (90% CI) | 0.4 (−0.34, 1.14) | 0.15 (−0.52, 0.82) | 0.5 (0.13, 0.87) | 0.3 (−0.59, 1.19) |
EFV administered only on days 8–21. LPV/r, lopinavir 400 mg b.i.d./ritonavir 100 mg b.i.d.; SQV, saquinavir 400 mg b.i.d.; EFV, efavirenz 600 mg q.d.
Figure 5.
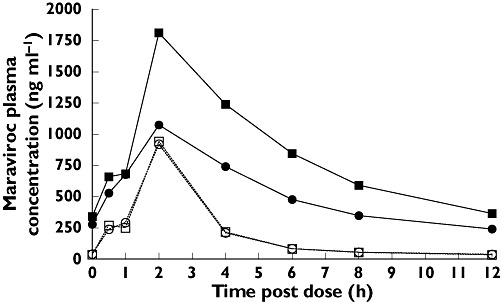
Effect of boosted lopinavir (LPV/r) (day 7) and LPV/r + efavirenz (EFV) (day 21) on maraviroc (MVC) plasma pharmacokinetics. Day 7 (300 mg MVC + LPV/r) (▪); Day 7 (300 mg MVC + Placebo) (□); Day 21 (300 mg MVC + LPV/r + EFV) ( ); Day 21 (300 mg MVC + Placebo) (○)
Co-administration of SQV/r with maraviroc 100 mg b.i.d. in cohort 2 resulted in GMRs of 977% and 478% for maraviroc AUC12 and Cmax, respectively, compared with placebo (Tables 4 and 5). As observed in cohort 1 with LPV/r, the boosting effect on maraviroc exposure was reduced when EFV was co-administered along with SQV/r on days 8–21 (Figure 6). However, the GMRs for AUC12 and Cmax were still 500% and 226%, respectively, after adding EFV to the treatment regimen (Table 5; cohort 2, day 21).
Figure 6.
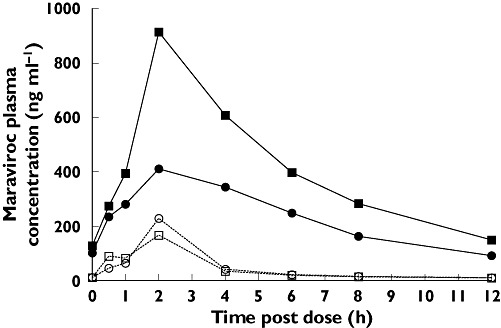
Effect of boosted saquinavir (SQV/r) (day 7) and SQV/r + efavirenz (EFV) (day 21) on maraviroc (MVC) plasma pharmacokinetics. Day 7 (100 mg MVC + SQV/r) (▪); Day 7 (100 mg MVC + Placebo) (□); Day 21 (100 mg MVC + SQV/r + EFV) ( ); Day 21 (100 mg MVC + Placebo) (○)
Thus, despite the inductive effect of EFV on CYP3A4, the net effect of the EFV + LPV/r and EFV + SQV/r combinations was still an increase in maraviroc exposure, compared with maraviroc + placebo. There was no clinically relevant difference in Tmax between the placebo- and inducer/inhibitor-treated groups. No pharmacokinetic data are reported for cohort 3 because all subjects were discontinued during period 1 due to poor toleration of the drug regimen (maraviroc + SQV/LPV/r).
Safety and tolerability
There were no serious AEs reported in either study. There were no discontinuations in study 1. In study 2, seven subjects discontinued treatment due to AEs; one subject in cohort 1 discontinued (after dosing with maraviroc 300 mg b.i.d. + LPV/r + EFV) due to moderate treatment-related hyperlipidaemia, another subject in cohort 1 discontinued due to mild [1.4 × the upper limit of normal (ULN)], treatment-related elevated alanine aminotransferase (after dosing with maraviroc 300 mg + placebo); one subject in cohort 2 discontinued (after dosing with maraviroc 100 mg b.i.d. + SQV/r + EFV) due to a respiratory tract infection, considered unrelated to treatment; and four subjects in cohort 3 discontinued (after maraviroc 100 mg b.i.d. + SQV + LPV/r + EFV) due to severe bilirubinaemia (n = 2) moderate nausea (n = 1) and severe malaise (n = 1). The subjects experiencing bilirubinaemia did not have concurrent elevated hepatic transaminases, and in no case was bilirubin >1.5 times ULN. All subjects in cohort 3 were subsequently discontinued by the sponsor due to poor toleration with a high incidence of gastrointestinal AEs in subjects receiving maraviroc + SQV + LPV/r.
In study 1, the most common treatment-related AEs were asthenia and dizziness, followed by nausea, somnolence, stupor, and rash. All AEs were mild or moderate in severity. There was a higher incidence of AEs in patients receiving EFV-containing regimens. There were no clinically significant laboratory test abnormalities and no clinically significant changes in blood pressure, pulse rate, or 12-lead ECG parameters.
In study 2, the most commonly occurring treatment-related AEs were dizziness, asthenia, headache, abdominal pain, nausea, and postural hypotension. Reports of postural hypotension were confined to cohorts 1 and 2, all of which were mild or moderate in nature. The majority of AEs occurred during co-administration of maraviroc + LPV/r and EFV (cohort 1), SQV/r and EFV (cohort 2) or SQV, LPV/r and EFV (cohort 3), with fewer events occurring with administration of maraviroc and placebo. The relative incidence of most types of AEs was similar for all three cohorts. However, abdominal pain, nausea, hypoaesthesia, anorexia, vomiting and diarrhoea all occurred more frequently in cohort 3 than in cohorts 1 and 2. The incidence of dizziness, commonly associated with EFV treatment, increased upon the addition of EFV to the regimen. There were three discontinuations due to laboratory test abnormalities, as described above. There were no other laboratory test abnormalities considered to be clinically significant. There were no notable changes in mean values for any ECG parameters (including QTc interval) in study 2.
Discussion
HIV-infected patients typically receive complex treatment regimens, which include antiretroviral agents for the treatment of primary HIV infection as well as various medications for comorbid conditions. The likelihood of drug interactions increases with increasing numbers of different medications. Therefore, management of treatment regimens in these patients can be a challenging undertaking for the physician, requiring careful oversight and frequent review [11].
As a substrate of both CYP3A4 and Pgp, the pharmacokinetics of maraviroc would be expected to be affected by agents that inhibit or induce either of these proteins. Previous studies have shown that co-administration with PIs and other potent CYP3A4/Pgp inhibitors (ketoconazole) leads to a significant increase in maraviroc exposure (AUC and Cmax), probably by a combination of increased absorption in the gut and decreased first-pass metabolism [10]. It has also been shown that downward dose adjustment of maraviroc could compensate for these increases in exposure. The first study described in this paper was designed to investigate the effect of inducers of CYP3A4 (and Pgp) on maraviroc and to determine whether dose adjustment could similarly be used to compensate for any changes in exposure. Further, given the potential for prescribed combinations of antiretroviral agents that are inhibitors and inducers of CYP3A4/Pgp, the effect of EFV on PI-mediated changes in maraviroc pharmacokinetics was also investigated in study 2.
The first study confirmed that inducers of CYP3A4/Pgp significantly reduced maraviroc exposure. Rifampicin, an antibiotic used to treat mycobacterial infections, is also a potent CYP3A4 and Pgp inducer and reduced maraviroc AUC12 and Cmax by approximately 70%, whereas EFV, a NNRTI and a moderate CYP3A4 inducer, reduced maraviroc AUC12 and Cmax by >50%. Increases in the 6β-OH cortisol/cortisol ratio during treatment with rifampicin (∼fivefold) and EFV (∼twofold) were consistent with potent and moderate induction of CYP3A4. The larger decreases in maraviroc exposure with co-administration of rifampicin vs. EFV is consistent with the observation that rifampicin is a more potent inducer than EFV [6]. An additional factor may be that whereas rifampicin is known to induce Pgp [4], studies suggest that EFV does not [7]. Upward adjustment of the maraviroc dose during co-administration with these metabolic inducers appears to compensate for this induction, bringing maraviroc exposure back to those observed in the absence of inducers and indicating that co-administration of maraviroc with potent CYP3A4 inducers is possible.
Consistent with previous findings [10], PIs, which are commonly inhibitors of CYP3A4/Pgp, significantly increased maraviroc exposure. In study 2, LPV/r increased maraviroc (300 mg b.i.d.) AUC12 approximately fourfold, whereas SQV/r increased maraviroc (100 mg b.i.d.) AUC12 almost 10-fold. When EFV was added to the maraviroc + PI regimens, the magnitude of PI-mediated increase in maraviroc exposure was reduced by approximately 50%, although the net effect was still an increase in maraviroc exposure compared with maraviroc + placebo.
The incidence of AEs increased when PIs and EFV were added to the maraviroc treatment regimen. Although it is not possible to relate specific AEs to particular drugs in multidrug regimens, it should be noted that many of the AEs observed in these studies are known to occur in patients treated with PIs and/or EFV. The most common AE in study 2 was dizziness, which occurred more frequently when EFV was co-administered with maraviroc + SQV/r or maraviroc + LPV/r. Incidence of gastrointestinal AEs was generally higher during treatment with PIs and EFV compared with maraviroc + placebo treatment.
Because of the increased clinical success associated with simultaneous targeting of multiple steps in the HIV life cycle, it is expected that maraviroc will be prescribed in combination with other drugs. The data gathered in these drug interaction studies will be invaluable in formulating dosing recommendations for individual patients based on their concomitant pharmacotherapy regimens.
Competing interests
S.A., T.J., L.A.W., C.E.R. and G.J.M. were employed by Pfizer Ltd at the time of this research.
These studies were sponsored by Pfizer. Editorial assistance was provided by Dylan Harris, PhD and Janet E. Matsuura, PhD at Complete Healthcare Communications, Inc., and was funded by Pfizer Inc., New York, NY, USA.
REFERENCES
- 1.Moore JP. Coreceptors: implications for HIV pathogenesis and therapy. Science. 1997;276:51–2. doi: 10.1126/science.276.5309.51. [DOI] [PubMed] [Google Scholar]
- 2.Abel S, van der Ryst E, Rosario MC, Ridgway CE, Medhurst CG, Taylor-Worth RJ, Muirhead GJ. Assessment of the pharmacokinetics, safety and tolerability of maraviroc, a novel CCR5 antagonist, in healthy volunteers. Br J Clin Pharmacol. 2008;65(Suppl. 1):5–18. doi: 10.1111/j.1365-2125.2008.03130.x. [DOI] [PMC free article] [PubMed] [Google Scholar]
- 3.Walker DK, Abel S, Comby P, Muirhead GJ, Nedderman AN, Smith DA. Species differences in the disposition of the CCR5 antagonist, UK-427,857, a new potential treatment for HIV. Drug Metab Dispos. 2005;33:587–95. doi: 10.1124/dmd.104.002626. [DOI] [PubMed] [Google Scholar]
- 4.Lin JH, Yamazaki M. Role of P-glycoprotein in pharmacokinetics: clinical implications. Clin Pharmacokinet. 2003;42:59–98. doi: 10.2165/00003088-200342010-00003. [DOI] [PubMed] [Google Scholar]
- 5.Bolt HM. Rifampicin, a keystone inducer of drug metabolism: from Herbert Remmer's pioneering ideas to modern concepts. Drug Metab Rev. 2004;36:497–509. doi: 10.1081/dmr-200033432. [DOI] [PubMed] [Google Scholar]
- 6.Hariparsad N, Nallani SC, Sane RS, Buckley DJ, Buckley AR, Desai PB. Induction of CYP3A4 by efavirenz in primary human hepatocytes: comparison with rifampin and phenobarbital. J Clin Pharmacol. 2004;44:1273–81. doi: 10.1177/0091270004269142. [DOI] [PubMed] [Google Scholar]
- 7.Berruet N, Sentenac S, Auchere D, Gimenez F, Farinotti R, Fernandez C. Effect of efavirenz on intestinal p-glycoprotein and hepatic p450 function in rats. J Pharm Pharm Sci. 2005;8:226–34. [PubMed] [Google Scholar]
- 8.Zhou S, Chan E, Lim LY, Boelsterli UA, Li SC, Wang J, Zhang Q, Huang M, Xu A. Therapeutic drugs that behave as mechanism-based inhibitors of cytochrome P450 3A4. Curr Drug Metab. 2004;5:415–42. doi: 10.2174/1389200043335450. [DOI] [PubMed] [Google Scholar]
- 9.Ernest CS, Hall SD, Jones DR. Mechanism-based inactivation of CYP3A by HIV protease inhibitors. J Pharmacol Exp Ther. 2005;312:583–91. doi: 10.1124/jpet.104.075416. [DOI] [PubMed] [Google Scholar]
- 10.Abel S, Russell D, Taylor-Worth RJ, Ridgway CE, Muirhead GJ. Effects of CYP3A4 inhibitors on the pharmacokinetics of maraviroc in healthy volunteers. Br J Clin Pharmacol. 2008;65(Suppl. 1):27–37. doi: 10.1111/j.1365-2125.2008.03133.x. [DOI] [PMC free article] [PubMed] [Google Scholar]
- 11.Tseng AL, Foisy MM. Management of drug interactions in patients with HIV. Ann Pharmacother. 1997;31:1040–58. doi: 10.1177/106002809703100915. [DOI] [PubMed] [Google Scholar]