

Abstract
Aims
To develop a population pharmacokinetic model for maraviroc, a noncompetitive CCR5 antagonist, after oral administration of tablets to healthy volunteers and asymptomatic HIV-infected subjects and to quantify the inherent variability and influence of covariates on the parameters of the model.
Methods
Rich pharmacokinetic data available from 15 studies in healthy volunteers (n = 365) and two studies in asymptomatic HIV-infected subjects (n = 48) were analysed using NONMEM. Maraviroc was administered as single or multiple oral tablet doses under fasted and fed conditions. Doses ranged from 100 to 1800 mg day−1.
Results
A two-compartment model parameterized to separate out absorption and clearance components on bioavailability was used. Absorption was described by a lagged first-order process. A sigmoid Emax model described the effect of dose on absorption. A visual predictive check and nonparametric bootstrap evaluation confirmed that the model was a good description of the data. Typical CL, Vc and Vp values for a 30-year-old non-Asian are 51.5 l h−1, 132 l and 277 l, respectively.
Conclusions
For the typical non-Asian subject, fasted bioavailability increased asymptotically with dose from 24% at 100 mg to 33% at 600 mg. A high-fat meal taken with maraviroc reduced exposure by 43% for a 100-mg dose to approximately 25% at doses of 600 mg. The typical Asian subject had a 26.5% higher AUC than the typical non-Asian subject irrespective of dose, a difference not considered to be clinically relevant. None of the other covariates tested had any clinically relevant effects on exposure.
Keywords: CCR5, HIV, maraviroc, NONMEM, population pharmacokinetics
Introduction
Maraviroc (UK427 857) is a slowly reversible and selective antagonist of the human chemokine CCR5 receptor [1]. It has recently been approved for use along with other antiretroviral agents for treatment-experienced patients infected with CCR5-tropic human immunodeficiency virus type 1 (HIV-1).
A pooled model-based analysis of noncompartmental data [maximum observed plasma concentration (Cmax) and area under the plasma concentration–time curve (AUC)] from selected Phase 1 studies has shown that the pharmacokinetics (PK) of maraviroc are nonproportional after single- and multiple-dose oral administration; there is a supraproportional increase in AUC (and Cmax) with increasing doses [2]. Following oral administration of maraviroc to adults, Cmax was observed approximately 3 h (range 1.8–4.25 h) postdose and the elimination half-life ranged from 11.5 to 23.9 h. Absorption profiles, particularly at lower doses, are somewhat variable, often showing multiple peaks. It has also been shown that food causes a dose-dependent reduction in the rate and extent of maraviroc absorption, with the greatest effect occurring with lower doses when the dose is administered with a high-fat meal (details will be published separately).
Maraviroc is a substrate for both cytochrome P450 (CYP) 3A4 and P-glycoprotein (Pgp) in vitro[3, 4]. Consequently, interacting antiretroviral drugs may have an effect on the gastrointestinal absorption of maraviroc by inhibiting or inducing gastric transporters such as Pgp and/or by inhibiting/inducing nonrenal clearance (such as CYP3A4 metabolism) directly. Clearance changes then indirectly affect bioavailability by altering first-pass loss in the gut or liver. Although no data in the presence of potentially interacting drugs are included in the present analysis, the intention is to use the model described in this paper to accommodate future work where other potentially interacting medication would also be present.
Previous population PK/pharmacodynamic analyses used a two-compartment dose-dependent disposition model with first-order absorption; for both publications the PK part of the model was based on the same data from 24 healthy male subjects [5, 6]. This paper seeks to extend the simple population PK model reported thus far and describes a population PK meta-analysis of data from 17 clinical pharmacology studies in order to better characterize the population PK of maraviroc in both healthy volunteers and asymptomatic HIV-infected subjects. The model should account for the influence of food on the absorption of maraviroc and the nonproportional increase in AUC and Cmax with increasing dose. The goals of the analysis were to develop a population PK model and to quantify the variability in, and influence of, covariates such as demographic factors and HIV status, on the population PK parameters of maraviroc. Oral tablet data were available from 17 Phase 1 and Phase 2a clinical pharmacology studies with maraviroc. These included single and multiple-dose studies, food effect and relative bioavailability studies, a bioequivalence study, a QTc study, and various drug interaction studies. For drug interaction studies, only observations with maraviroc alone or maraviroc with placebo were included. Two of the 17 studies were conducted in asymptomatic HIV-infected subjects. Total daily doses of maraviroc included in the current analysis ranged from 100 to 1800 mg day−1 (900 mg twice daily). Minimum and maximum once-daily doses were 100 mg and 1200 mg, respectively.
Methods
Studies analysed
Rich PK data were available from 15 studies in healthy volunteers (n = 365) and two studies in asymptomatic HIV-infected subjects (n = 48). The studies are summarized in Table 1. In total the dataset comprised 413 subjects (of whom 48 were HIV-infected) who contributed 8951 maraviroc plasma concentration measurements (of which 929 were from asymptomatic HIV-infected subjects). The population covariate factors that were assessed in the analysis included race, sex, age, HIV status (healthy volunteers or asymptomatic HIV-infected subjects) and weight (Tables 2 and 3). Approvals from local ethics committees were obtained for all studies and written informed consent was obtained from all subjects.
Table 1.
Overview of maraviroc Phase 1 and 2a studies included in the population pharmacokinetic meta-analysis
| Study | Design | Dose (mg) | Single/multiple dosing | Fed/fasted | Subjects | n |
|---|---|---|---|---|---|---|
| A4001003 | Open-label, randomized, 5-way crossover, relative bioavailability, dose proportionality, food effect | 50, 100, 600 | Single | Fed/Fasted | Healthy volunteers | 15 |
| A4001004 | Open-label, randomized, 5-way crossover, incomplete block, effect of timing of food | 100 | Single | Fed/Fasted | Healthy volunteers | 14 |
| A4001005 | Double-blind, placebo-controlled, randomized, 2-way crossover, oral contraceptive pill interaction | 100 | Multiple | Fasted | Healthy volunteers | 15 |
| A4001006 | Open-label, randomized, placebo-controlled, 2-way crossover, ketoconazole and saquinavir interaction | 100 | Multiple | Fasted | Healthy volunteers | 24 |
| A4001007 | Double-blind, parallel group, randomized, placebo-controlled, multicentre | 25, 50, 100, 300 | Multiple | Fasted | HIV-infected subjects | 16 |
| A4001011 | Open-label, randomized, placebo-controlled, parallel group, efavirenz and rifampicin interaction with dose-adjustment of maraviroc | 100, 200 | Multiple | Fasted | Healthy volunteers | 36 |
| A4001013 | Open-label, randomized, placebo-controlled, parallel group, drug interaction with dose adjustment of maraviroc (ritonavir, boosted saquinavir, lopinavir plus ritonavir) | 25, 50, 100 | Multiple | Fasted | Healthy volunteers | 32 |
| A4001015 | Double-blind, randomized, placebo- controlled, parallel group, multicentre | 100, 150, 300 | Multiple | Fed/fasted | HIV-infected subjects | 32 |
| A4001016 | Double-blind, placebo-controlled, randomized, 5-way crossover, QTc | 100, 300, 900 | Single | Fasted | Healthy volunteers | 60 |
| A4001018 | Open-label, placebo-controlled, 2-way crossover, cotrimoxazole interaction | 300 | Multiple | Fasted | Healthy volunteers | 13 |
| A4001019 | Double-blind, placebo-controlled, 3rd party open, parallel group, randomized, dose escalation | 300–600, 600–900, 900–1200 | Multiple | Fasted | Healthy volunteers | 26 |
| A4001021 | Open-label, 2-way crossover, randomized, drug interaction (Kaletra, boosted saquinavir, with or without efavirenz | 100, 300 | Multiple | Fasted | Healthy volunteers | 27 |
| A4001022 | Open-label, placebo-controlled, 2-way crossover, randomized, tenofovir interaction | 300 | Multiple | Fasted | Healthy volunteers | 11 |
| A4001025 | Open-label, placebo-controlled, 2-way crossover, randomized, atazanavir and ritonavir interaction | 300 | Multiple | Fasted | Healthy volunteers | 12 |
| A4001038 | Open-label, parallel group, Asian and White subjects study | 300 | Single | Fasted | Healthy volunteers | 24 |
| A4001040 | Open-label, randomized, 2-way crossover, research & commercial formulation bioequivalence study | 300 | Single | Fasted | Healthy volunteers | 44 |
| A4001043 | Open-label, randomized, 2-way crossover, food effect with commercial formulation | 300 | Single | Fed/fasted | Healthy volunteers | 12 |
Table 2.
Median and range of age and weight for the subjects in the dataset
| Median | Range | |
|---|---|---|
| Age (years) | 30 | 18–54 |
| Weight (kg) | 71 | 46–109 |
Table 3.
Summary of maraviroc categorical covariate data
| Covariate | n | % |
|---|---|---|
| Sex | ||
| Female | 96 (2) | 23.2 |
| Male | 317 (46) | 76.8 |
| Race | ||
| White | 302 (46) | 73.1 |
| Black | 14 (1) | 3.4 |
| Asian | 95 (0) | 23.0 |
| Others | 2 (1) | 0.5 |
| HIV status | ||
| Healthy volunteers | 365 | 88.4 |
| Asymptomatic HIV-infected subjects | 48 | 11.6 |
The numbers in parentheses are the number of HIV-infected subjects in that category.
Blood samples were collected for determination of maraviroc plasma concentrations predose and at specified times up to 48 h postdose for all but one of the single-dose studies; in that single study blood samples were collected up to 24 h postdose. In the case of the multiple-dose studies serial samples were collected after the first and last multiple doses at specified times up to at least 12 h postdose; in addition predose blood samples were collected periodically during the multiple-dose administration period. Plasma samples were analysed to determine maraviroc concentrations using solid-phase extraction followed by liquid chromatography with tandem mass spectrometric detection. The same analytical method was used in all 17 studies. The lower limit of quantification was 0.5 ng ml−1.
Model development
Base structural model
Logarithmically transformed plasma concentration vs. time data were analysed using a nonlinear mixed-effects modelling approach with the NONMEM software system, version V level 1.1 and the NM-TRAN subroutines version III level 1.1, and the PREDPP model library, version IV level 1.1 and the FOCE method [7].
A two-compartment disposition model which parameterized the disposition kinetics in terms of clearance (CL), central volume (Vc), intercompartmental clearance (CLic), and peripheral volume (Vp) (NONMEM ADVAN4 TRANS4) was used to describe the maraviroc concentration data. A first-order absorption process (absorption rate constant ka) with a lag time (Tlag) was used to describe drug input.
Model assumptions
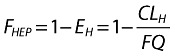
The parameterization of the present model was chosen to facilitate including covariate effects for potentially interacting drugs in the most appropriate fashion. For the purpose of the model, absolute bioavailability (F) was partitioned into extent of absorption (FABS) and fraction escaping first-pass elimination (FHEP) (Equation 1).
| (1) |
It was assumed that nonrenal clearance was entirely hepatic (CLH), so that any gastrointestinal wall metabolism was included in the hepatic component and no other nonrenal clearance routes were present. In order to restrict CLH (under conditions ranging from total inhibition to limiting metabolic induction) to between zero and hepatic blood flow, the hepatic extraction ratio EH was the primary parameter used to compute and limit CLH, together with an assumed fixed value of hepatic plasma flow (FQ, 59.59 l h−1) calculated by assuming constant blood:plasma partition ratio R = 0.59 and constant hepatic blood flow = 101 l h−1 derived from a previous mass-balance analysis of maraviroc (details will be published separately) (Equation 2). The fraction of any absorbed dose that escapes first-pass clearance (metabolism/direct liver excretion), FHEP, is, by definition, dependent only on CLH and FQ (Equation 3). It is clear that FHEP must lie between 0 and 1 as CLH goes between FQ (limiting induction) and 0 (total inhibition).
It was assumed that any interacting antiretroviral would have no effect on renal clearance (CLR) and so a fixed value of 12 l h−1 was used for renal clearance (taken from a previous mass-balance maraviroc analysis) (details will be published separately). Total body clearance was the sum of CLH and CLR.
| (2) |
 |
(3) |
Dose nonproportionality
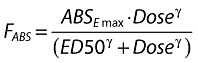
It was also assumed that all dose nonproportionality was related to absorption (FABS) and could be described by a sigmoid maximum effect (Emax) model; all subsequent maraviroc disposition was entirely linear (i.e. constant clearance and first-pass) [8]. It was further assumed that an infinitely high dose would be completely absorbed. Therefore the pure absorption component, FABS, was implemented as given in Equation 4, with the limiting absorption ABSEmax fixed to 1. ED50 represents the dose at which 50% of ABSEmax is produced; γ is a sigmoidicity parameter which describes the steepness of the dose–absorption relationship.
 |
(4) |
ka was modelled using a power function of dose as given in Equation 5. θka denotes the fractional (approximate through the exponential) change in ka (ka1mg) when dose = 1 mg.
| (5) |
Food effect
The food effect was included on ka as a factorial effect, the presence of food causing a reduction in the rate of absorption (Equation 6).  denotes the fractional change in fasted ka.
| (6) |
A food effect was also included on FABS as a multiplicative exponential function on both ABSEmax and ED50, making the assumption that food could reduce the absorption to below 1 even at very high doses (Equation 7) as well as causing a shift to the right in the sigmoid Emax model for FABS (Equation 8).  and θED50 denote the approximate fractional changes in fasted ABSEmax and ED50, respectively.
| (7) |
| (8) |
Dose and food effects on ka and F were considered as part of the base structural model.
Intersubject variability
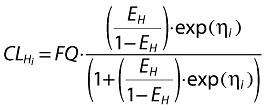
Intersubject variability in the PK parameters was modelled using multiplicative exponential random effects and expressed as the approximate percent coefficient of variation (%CV). For parameter EH, intersubject variability was modelled using a transformation according to Equation 9.
 |
(9) |
where EH is the population mean value of the parameter and ηi denotes the intersubject random effect accounting for the ith individual's deviation from the typical value having zero mean and variance ω2. The approximate %CV of EH was expressed as in Equation 10.
| (10) |
Residual variability
The residual error for the logarithmically transformed concentrations was initially described using an additive error model (Equation 11). However, because most of the residual error occurred during the absorption phase, a continuous TAD-dependent error model was also tested, as shown in Equation 12.
| (11) |
| (12) |
where 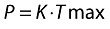
and
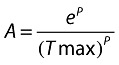 |
where εij is random variable with variance (σ2) fixed to 1. Base denotes a baseline residual variability and TADij is time after dose. Tmax and K denote the time of maximum residual variability and an exponential rate constant for the time course of residual variability. Pmax denotes the maximum change of residual variability above the baseline. Because of log transformation, parameters Base and Pmax were therefore expressed as CV%.
The continuous TAD-dependent error model resulted in statistically significant improvement in the model fit compared with the additive residual error model (change in objective function, ΔOFV −2490). Moreover, the quantile–quantile (QQ) plot of the continuous TAD-dependent residual error model showed better approximation to a normal distribution than the additive residual error (not shown). Thus model building proceeded with the TAD-dependent error model.
Covariate testing
A stepwise forward selection and backwards deletion approach was used to test for potential covariate influences. Dichotomous covariates examined were sex, race and HIV status. Race effects were tested using separate categories of Black and Asian referenced to Whites plus others in the preliminary analysis; this showed no statistically significant difference for Blacks. In the final covariate search the race effect was tested as binary (Asians vs. reference of all non-Asians). Continuous covariates, age and weight, were modelled as multiplicative effects and normalized to their median values, 30 years and 71 kg, respectively. A P-value of <0.001 (corresponding to a difference in objective function of 10.83 for two hierarchical models with 1 d.f.) was used in both the forward and backwards covariate model-building steps.
Model evaluation
Throughout the model-building process the adequacy of the model, possible lack of fit or potential violation of assumptions was evaluated by visual inspections of the generated goodness-of-fit plots. A plot of observed (LNDV, natural log of data) vs. population predicted values (PRED) and a plot of LNDV vs. individual predicted values (IPRE) were evaluated for randomness around the line of unity. Plots of weighted residual (WRES) vs. time and absolute individual weighted residual (IWRES) vs. IPRE were evaluated for randomness around the zero line. These diagnostic plots were also stratified by study and dose to ensure adequacy of fit across these design differences. Final model ETA (individual deviation from population mean) plots vs. each covariate were compared with similar plots for the base model to demonstrate that the final model accounted for trends observed with the base model.
Bootstrap confidence intervals for the final model parameters were generated from 1000 nonparametric bootstrap datasets. The bootstrap distributions were compared with the NONMEM population parameters and standard errors [SEs, population parameter ±2 times SEs (%SE) should be approximately equal to the bootstrap %CV].
The adequacy of the final model was also evaluated by a visual predictive check. One hundred datasets with identical design to the original dataset were simulated using the final parameter estimates including the intersubject and residual variability, but not including model uncertainty. Plots of median and 95% degenerative tolerance intervals of the simulated concentrations vs. time, stratified by study, dose and fed/fasted status together with the original concentrations, were generated to check that the distribution of data was reasonably contained within the degenerative tolerance intervals [9].
Results
Data
A total of 413 subjects (including 48 HIV+ patients) contributed 690 concentration–time profiles with 8951 plasma concentration observations to the population PK analysis. Median age and weight were 30 years (range 18–54) and 71 kg (range 46–109), respectively. There were 317 male (76.8%) and 95 Asian subjects (23%). Most concentration–time profiles were obtained after unit doses of 100 mg (40.4%) and 300 mg (38.4%). Forty-six of the 690 (6.7%) concentration–time profiles were obtained under fed conditions.
Model development
The basic structural model used to describe the maraviroc plasma concentrations was a two-compartment disposition model with first-order absorption and a lag time. Dose and food effects were included in the basic structural model in order to obtain a satisfactory fit of the model to the data. Statistically significant improvements of model fit (ΔOFV) were obtained after the inclusion of a power function for describing the change in ka with dose (ΔOFV −212); and food effects on both ABSEmax and ED50 simultaneously (ΔOFV −118) and ka (ΔOFV −168).
Forward selection of covariates found influences of race on Vp (ΔOFV −88), race on γ for the effect of dose in FABS (ΔOFV −36), race on CLic (ΔOFV −21), age on CLic (ΔOFV −15) and race on EH (ΔOFV −14). Only the covariate effects of race on Vp (ΔOFV −112), race on EH (ΔOFV −46), race on CLic (ΔOFV −29) and age on CLic (ΔOFV −14) were retained in the final model after the backwards deletion step.
Final model
The final model parameter estimates, together with the results of the 1000 bootstrap runs, are presented in Table 4. The goodness-of-fit plots for the final model are presented in Figure 1.
Table 4.
Maraviroc final population pharmacokinetic parameter estimates and bootstrap results
| Final model Parameter | %SE | 1000 bootstrap run statistics Mean | SD | %CV | ||
|---|---|---|---|---|---|---|
| Structural | CL (l h−1)* | 51.45 | ||||
| EH | 0.662 | 1.5 | 0.66 | 0.01 | 1.52 | |
| Race | −0.0948 | 15.0 | −0.09 | 0.01 | 13.77 | |
| Vc (l) | 132 | 2.7 | 131.6 | 3.08 | 2.34 | |
| CLic (l h−1) | 16.4 | 3.9 | 16.27 | 0.57 | 3.52 | |
| Race | −0.298 | 17.7 | −0.29 | 0.05 | 15.82 | |
| Age | 0.349 | 28.3 | 0.35 | 0.09 | 26.21 | |
| Vp (l) | 277 | 4.2 | 276.07 | 10.13 | 3.67 | |
| Race | −0.637 | 8.5 | −0.63 | 0.05 | 7.35 | |
| ka (h−1) | 0.277 | 21.0 | 0.28 | 0.06 | 20.64 | |
| θka | 0.173 | 22.9 | 0.18 | 0.04 | 22.82 | |
| 0.547 | 18.6 | 0.56 | 0.10 | 17.95 | ||
| ABSEmax | 1 FIX | |||||
| −0.258 | 27.3 | −0.24 | 0.09 | 36.23 | ||
| ED50 | 51.2 | 12.8 | 50.82 | 8.06 | 15.87 | |
| θED50 | 0.594 | 34.5 | 0.66 | 0.41 | 62.46 | |
| γ | 1.39 | 15.3 | 1.38 | 0.30 | 21.9 | |
| Tlag | 0.198 | 4.1 | 0.20 | 0.01 | 4.13 | |
| FQ (l h−1) | 59.59 FIX | |||||
| Residual error | Pmax (%) | 74.2 | 3.9 | 74.59 | 2.43 | 3.26 |
| Tmax (h) | 0.950 | 8.8 | 0.95 | 0.08 | 8.35 | |
| K | 0.403 | 6.4 | 0.40 | 0.02 | 5.99 | |
| Base (%) | 20.2 | 3.3 | 20.0 | 0.66 | 3.28 | |
| Inter-subject Variability | ω[ED50] (%) | 58.9 | 32.6† | 61.17 | 15.03 | 24.57 |
| ω[EH] (%) | 8.3‡ | 11.0† | 8.27 | 0.43 | 5.22 | |
| ω[Vc] (%) | 11.5 | 77.3† | 8.92 | 5.64 | 63.21 | |
| ω[CLic] (%) | 30.5 | 22.7† | 29.8 | 3.41 | 11.45 | |
| ω[ka] (%) | 40.0 | 13.9† | 39.92 | 2.59 | 6.48 | |
| ω[Vp] (%) | 27.8 | 21.2† | 27.23 | 2.89 | 10.63 |
Sum of CLH (Equation 2) + CLR (fixed to 12 l h−1).
% standard error on ω2 is approximately 2·SE on ω.
(1-EH)·SQRT(ω2).
Figure 1.
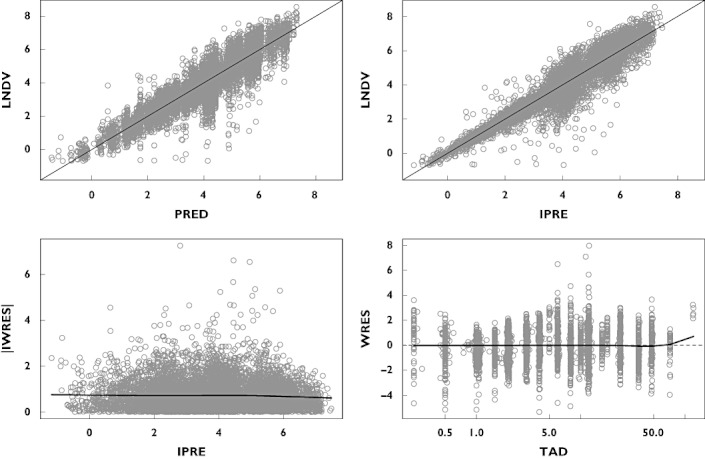
Goodness-of-fit plots for the final model. Top left: observed (LNDV, natural log of data) vs. population predicted (PRED) concentrations. Top right: LNDV vs. individual predicted (IPRE) concentrations. Bottom left: absolute individual weighted residual (IWRES) vs. IPRE. Bottom right: WRES vs. time after dose (TAD). Circles represent observations. Solid lines for top panels are unity lines; for bottom panels are smooth trend lines
The population mean estimate of EH is 0.662, which results in a total CL of 51.45 l h−1 and a terminal half-life of elimination of 15.9 h for a fasted non-Asian subject.
The population mean estimate of F is 0.24 (FABS = 0.72 and FHEP = 0.34) for the typical individual (a non-Asian, 30-year-old subject, taking a 100-mg tablet under fasted conditions). F increases as dose increases following an asymptotic model as a result of increases in FABS while CLH remains constant. F increased to 0.31 at 300 mg and to 0.33 at 600 mg for the typical non-Asian.
For the typical individual taking a 100-mg tablet under fed (high-fat meal) conditions, the estimated covariate effect is −0.258 ± 27.3% (± %SE) on ABSEmax and 0.594 ± 34.5% on ED50, reducing AUC by 43.3%. The food effect diminished to a 30% reduction at 300 mg and a 26% reduction when dose is 600 mg (Table 5).
Table 5.
Dose, food and race effects on clearance, AUC and absorption rate constant based on population parameter estimates of the final model
| Dose (mg) | ka (h−1) | Non-Asian CL (l h−1)* | FHEP | FABS | F | AUC (ng h ml−1) | Asian CL (l h−1)* | FHEP | FABS | F | AUC (ng h ml−1) | AUC ratio Asian/non-Asian | Fed/fasted |
|---|---|---|---|---|---|---|---|---|---|---|---|---|---|
| Fasted | |||||||||||||
| 100 | 0.614 | 51.45 | 0.338 | 0.717 | 0.242 | 471 | 47.88 | 0.398 | 0.717 | 0.285 | 596 | 1.265 | – |
| 150 | 0.659 | 51.45 | 0.338 | 0.817 | 0.276 | 805 | 47.88 | 0.398 | 0.817 | 0.325 | 1018 | 1.265 | – |
| 300 | 0.743 | 51.45 | 0.338 | 0.921 | 0.311 | 1815 | 47.88 | 0.398 | 0.921 | 0.366 | 2296 | 1.265 | – |
| 600 | 0.838 | 51.45 | 0.338 | 0.968 | 0.327 | 3817 | 47.88 | 0.398 | 0.968 | 0.385 | 4828 | 1.265 | – |
| 900 | 0.899 | 51.45 | 0.338 | 0.982 | 0.332 | 5805 | 47.88 | 0.398 | 0.982 | 0.391 | 7342 | 1.265 | – |
| 1200 | 0.944 | 51.45 | 0.338 | 0.988 | 0.334 | 7787 | 47.88 | 0.398 | 0.988 | 0.393 | 9849 | 1.265 | – |
| Fed | |||||||||||||
| 100 | 0.336 | 51.45 | 0.338 | 0.407 | 0.137 | 267 | 47.88 | 0.398 | 0.407 | 0.162 | 338 | 1.265 | 0.567 |
| 150 | 0.361 | 51.45 | 0.338 | 0.511 | 0.173 | 503 | 47.88 | 0.398 | 0.511 | 0.203 | 637 | 1.265 | 0.625 |
| 300 | 0.406 | 51.45 | 0.338 | 0.646 | 0.218 | 1274 | 47.88 | 0.398 | 0.646 | 0.257 | 1611 | 1.265 | 0.702 |
| 600 | 0.458 | 51.45 | 0.338 | 0.719 | 0.243 | 2834 | 47.88 | 0.398 | 0.719 | 0.286 | 3585 | 1.265 | 0.742 |
| 900 | 0.492 | 51.45 | 0.338 | 0.741 | 0.250 | 4382 | 47.88 | 0.398 | 0.741 | 0.295 | 5543 | 1.265 | 0.755 |
| 1200 | 0.517 | 51.45 | 0.338 | 0.751 | 0.254 | 5922 | 47.88 | 0.398 | 0.751 | 0.299 | 7491 | 1.265 | 0.760 |
CL = FQ·EH + CLR (FQ fixed to 59.59 l h−1, CLR fixed to 12 l h−1).
For Asian subjects, the estimated covariate effect is −0.0948 ± 15% on EH, −0.637 ± 8.5% on Vp, and −0.298 ± 17.7% on CLic. The effect on EH translates via the first-pass effect to an F that is 17.7% larger in the typical Asian subject than that for a typical non-Asian subject, irrespective of dose (Equation 1). Increased F and lower systemic CL in Asian subjects imply that AUC in the typical Asian subject is 26.5% greater than that in the typical non-Asian.
The population estimate of ka is 0.277 h−1 (21%) for the typical individual taking a 100-mg dose tablet under fasted conditions. It increased as dose increases; for a change of dose from 100 mg to 300 mg, ka increased by 20.9% (Table 5). A smaller increase (12.7%) was shown for a change of dose from 300 mg to 600 mg. A high-fat meal reduced ka by 45.3% independently of dose.
The population estimate of CLic is 16.4 l h −1 ± 3.9% for the typical 30-year-old individual. CLic increased with age, with CLic 27.4% greater at age 60. The changing value of CLic with age does not affect AUC.
No influence of weight, sex or HIV status was found on the model parameters.
The continuous TAD-dependent error model used to describe the residual variability found that the peak residual variability occurred at 0.95 h after a dose, with a maximum value of 74.2% above a constant baseline of 20.2%. The total residual variability then dropped to 40% by about 6 h and to 25% by 10 h after a dose. This is illustrated in Figure 2.
Figure 2.
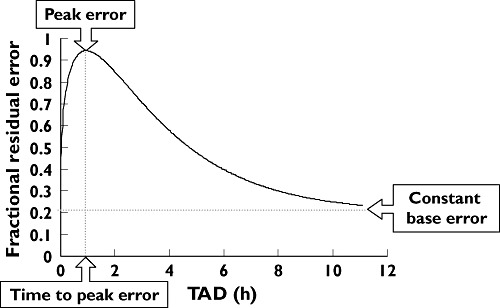
The continuous TAD-dependent residual error model using the final parameter estimates to show the change in residual error with time after dose (TAD).
The effects of dose, food and race on F (FHEP and FABS), AUC and ka are summarized in Table 5, and AUC effects presented graphically in Figure 3. The dose–AUC relationship appears almost linear because all the doses included in the analysis were above the estimated ED50 of 51.2 mg (%SE 12.8). The final model generated reasonable predictions of the AUC ratios for fed/fasted status compared with those obtained from individual clinical study reports (Figure 4).
Figure 3.
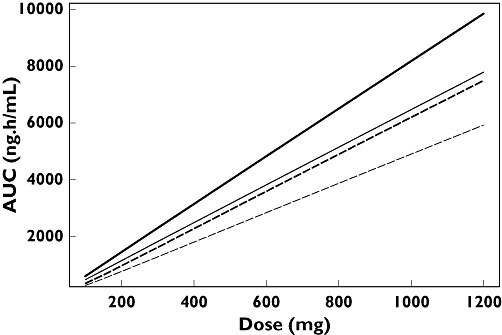
Relationship between dose and area under the plasma concentration-time curve (AUC) for non-Asians and Asians under fed and fasted conditions. Non-Asian fasted (—); Asian fasted (—); Non-Asian fed (– –); Asian fed (– –).
Figure 4.
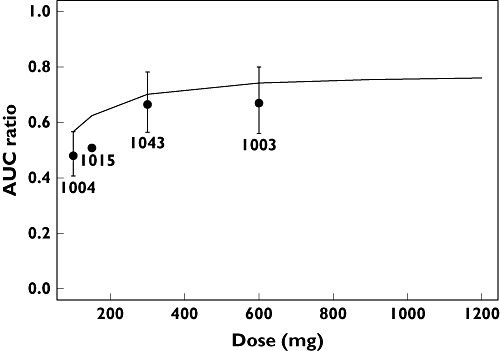
Model predicted and clinical study reports area under the plasma concentration-time curve (AUC) ratios for fed/fasted status. Formal statistical comparisons were not made in study A4001015 and hence no 90% confidence intervals are presented. Pooled Analysis of Phase 1/2a Data Model Prediction (—); Study Report AUC Ratio with 90% Cl ( ).
).
Sensitivity test
A number of runs were performed with the final partition model to assess the sensitivity of the fixed parameter values for FQ and CLR. In general, major PK parameter estimates were very stable in the tested range of FQ (50–70 l h−1) and CLR (6–18 l h−1); the population mean parameters changed by at most 16%.
Model evaluation
A visual predictive check was performed by simulating 100 datasets with identical design to the original dataset using the parameter estimates from the final model, including the intersubject and residual variability, but not model uncertainty. The medians and 95% degenerative tolerance intervals of the simulated concentrations at each time point were plotted together with the original concentrations stratified by study, dose and fed/fasted status. The visual predictive checks for the three studies (A4001003, A4001004 and A4001005) including single and multiple doses with 100 mg and 600 mg under fed and fasted status are shown in Figure 5. In general, the observations were within the 95% degenerative tolerance intervals for all studies, which highlights the ability of the final model to describe the pooled data.
Figure 5.
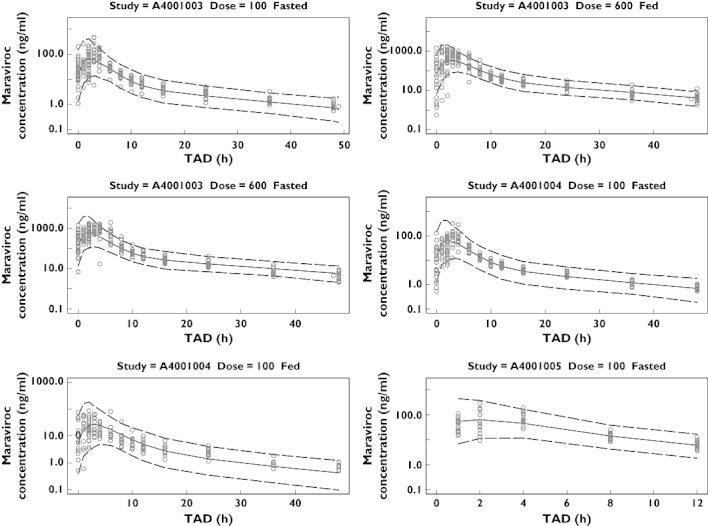
Visual predictive check for the first three studies (A4001003, A4001004 and A4001005). Symbols denote observations. Solid line and dotted lines represent median and the 95% degenerative tolerance intervals, respectively
Discussion
Maraviroc, a CCR5 entry inhibitor, has been approved for use along with other antiretroviral agents for treatment-experienced patients infected with CCR5-tropic HIV-1. It has been shown to reduce viral load significantly in Phase 2a [10] and Phase 3 studies [11, 12]. The meta-analysis presented here has described the development of a population PK model of maraviroc monotherapy data from 17 Phase 1 and Phase 2a studies, the goal of which was to describe the factors that influence the exposure of maraviroc in both healthy subjects and asymptomatic HIV-infected subjects. Furthermore, the developed model should lend itself to supporting the future analysis of sparsely sampled PK data from ongoing Phase 3 studies where other anti-HIV therapy is present.
Maraviroc is known to exhibit dose nonproportionality, with both AUC and Cmax increasing supraproportionally with increasing dose [2]. The data selected for this meta-analysis included doses of ≥100 mg, as this covers the expected clinical range as well as the range of doses utilized in the Phase 1 drug interaction studies (where 100 mg and 300 mg were given mainly). In addition, as the timing of food intake has been shown to have an impact on the exposure of maraviroc, only data from fully fasted (overnight fast and meals taken at least 4 h postdose) and fed (maraviroc tablet taken at the same time as food) conditions were included in the current analysis. These conditions (fully fasted and taken with meals) were assumed to be the extremes of possible food effects.
The rationale for moving from a standard two-compartment structural model parameterization to a two-compartment structural model with a more physiological parameterization, in which bioavailability was partitioned into extent of absorption and first-pass effect, was done in order to generalize the utility of the model in future analyses, where known drug interactions with maraviroc will be present.
The meta-analysis has shown that the PK of maraviroc after oral tablet administration are well described by a two-compartment disposition model with first-order absorption and a lag time. Maraviroc dose effects on bioavailability and absorption rate constant have been described by a sigmoid Emax model and a power model, respectively. Individual concentration–time profiles of maraviroc demonstrate a relatively large variability which occurs mainly in the absorption phase of the profiles. In the initial stages of building the population PK model the relatively large intrasubject variability was manifest as a large residual variability (>60% with a standard additive model with log-transformed data). Exploration of covariate influences, mainly on disposition parameters, to explain as much of the intersubject variability was one of the objectives of the analysis, and thus it was deemed appropriate to try to improve the description of the residual variability. This was accomplished by using a TAD-dependent error model which allowed residual variability to vary with time after dose. The results showed that the residual error was greatest around 1 h after a dose (> 90%), dropped to 40% by about 6 h and eventually dropped further to a constant 20% from 12 h or longer postdose (Figure 2).
A few covariates were found to be statistically significant in explaining intersubject variability. Besides the well-recognized dose and food effects on bioavailability and absorption rate constant, the strongest covariates identified related to Asian differences on clearance and peripheral volume. Although this Asian difference is statistically significant, it is emphasized that the difference is small in magnitude and is thus deemed clinically unimportant, having no implications for dose adjustment.
An effect of age on intercompartmental clearance was also found to be statistically significant, but had no effect on exposure and so, again, has no implications for dose adjustment. At no stage in the development of the model, nor during covariate testing, did weight, sex or HIV status appear to be influential on any model parameter.
In summary, the population PK model developed in this meta-analysis of orally administered maraviroc described well the concentration–time profiles in healthy volunteers and asymptomatic HIV-infected subjects on monotherapy with maraviroc. A statistically significant but clinically unimportant influence of race was found.
Competing interests
P.L.S.C. and L.M. are employees of Pfizer Ltd. B.W. is a paid consultant to Pfizer Global Research and Development, Sandwich, Kent, UK.
The authors thank Professor Mats Karlsson of Uppsala University for his advice during the model development; Professor Karlsson was a paid consultant to Pfizer Global Research and Development, Sandwich, Kent, UK. We are also grateful for Dr Janet Wade of Exprimo NV, who was contracted by Pfizer Global R&D, Sandwich, Kent, UK, to assist in constructing this manuscript. Editorial assistance was provided by Janet E. Matsuura, PhD at Complete Healthcare Communications, Inc., and was funded by Pfizer Inc, New York, NY, USA.
REFERENCES
- 1.Wood A, Armour D. 57, a new agent for the treatment of HIV infection and AIDS. Prog Med Chem. 2005;43:239–71. doi: 10.1016/S0079-6468(05)43007-6. The discovery of the CCR5 receptor antagonist, UK-427 8. [DOI] [PubMed] [Google Scholar]
- 2.Weatherley B, McFadyen L, Milligan P. Population analysis of maraviroc phase 1 noncompartmental pharmacokinetic data. 15th Meeting of the Population Approach Group Europe; 2006 June 14–16; Brussels, Belgium. [Google Scholar]
- 3.Muirhead G, Pozniak A, Gazzard B, Nelson M, Moyle G, Ridgway C, Taylor-Worth R, Russell D. A novel probe drug interaction study to investigate the effect of selected ARV combinations on the pharmacokinetics of a single oral dose of UK-427 857 in HIV+ve subjects (abstract 663). 12th Conference on Retroviruses and Opportunistic Infections; 2005 February 22–25; Boston, MA. [Google Scholar]
- 4.Walker DK, Abel S, Comby P, Muirhead GJ, Nedderman AN, Smith DA. 57, a new potential treatment for HIV. Drug Metab Dispos. 2005;33:587–95. doi: 10.1124/dmd.104.002626. Species differences in the disposition of the CCR5 antagonist, UK-427 8. [DOI] [PubMed] [Google Scholar]
- 5.Rosario MC, Jacqmin P, Dorr P, van der Ryst E, Hitchcock C. A pharmacokinetic–pharmacodynamic disease model to predict in vivo antiviral activity of maraviroc. Clin Pharmacol Ther. 2005;78:508–19. doi: 10.1016/j.clpt.2005.07.010. [DOI] [PubMed] [Google Scholar]
- 6.Rosario MC, Poland B, Sullivan J, Westby M, van der Ryst E. A pharmacokinetic–pharmacodynamic model to optimize the phase IIa development program of maraviroc. J Acquir Immune Defic Syndr. 2006;42:183–91. doi: 10.1097/01.qai.0000220021.64115.37. [DOI] [PubMed] [Google Scholar]
- 7.Beal SL, Sheiner LB. NONMEM User's Guide. Ellicott City, MD: Icon Development Solutions; 1988–1998. [Google Scholar]
- 8.Abel S, Russell D, Whitlock LA, Ridgway CE, Nedderman ANR, Walker DK. Assessment of the absorption, metabolism, and absolute bioavailability of maraviroc in healthy male subjects. Br J Clin Pharmacol. 2008;65(Suppl. 1):60–7. doi: 10.1111/j.1365-2125.2008.03137.x. [DOI] [PMC free article] [PubMed] [Google Scholar]
- 9.Yano Y, Beal SL, Sheiner LB. Evaluating pharmacokinetic/pharmacodynamic models using the posterior predictive check. J Pharmacokinet Pharmacodyn. 2001;28:171–92. doi: 10.1023/a:1011555016423. [DOI] [PubMed] [Google Scholar]
- 10.Fatkenheuer G, Pozniak AL, Johnson MA, Plettenberg A, Staszewski S, Hoepelman AI, Saag MS, Goebel FD, Rockstroh JK, Dezube BJ, Jenkins TM, Medhurst C, Sullivan JF, Ridgway C, Abel S, James IT, Youle M, van der Ryst E. Efficacy of short-term monotherapy with maraviroc, a new CCR5 antagonist, in patients infected with HIV-1. Nat Med. 2005;11:1170–2. doi: 10.1038/nm1319. [DOI] [PubMed] [Google Scholar]
- 11.Lalezari J, Goodrich J, DeJesus E, Lampiris H, Gulick R, Saag M, Ridgway C, McHale M, van der Ryst E, Mayer H. Efficacy and safety of maraviroc (MVC) plus optimized background therapy (OBT) in viremic antiretroviral treatment experienced patients infected with CCR5-tropic HIV-1: 24-week results of a phase 2b/3 study in the USA and Canada. 14th Conference on Retroviruses and Opportunistic Infections; 2007; Los Angeles, CA. (Abstract 104bLB) [Google Scholar]
- 12.Nelson M, Fätkenheuer G, Konourina I, Lazzarin A, Clumeck N, Horban A, Tawadrous M, Sullivan J, Mayer H, van der Ryst E. Efficacy and safety of maraviroc (MVC) plus optimized background therapy (OBT) in viremic, antiretroviral treatment experienced patients infected with CCR5-tropic (R5) HIV-1 in Europe, Australia and North America: 24-week results. 14th Conference on Retroviruses and Opportunistic Infections; 2007; Los Angeles, CA. (Abstract 104aLB) [Google Scholar]