

Abstract
Objectives
To determine if ghrelin and adipocytokine (leptin, adiponectin, resistin) levels vary with menopause stage or with estradiol (E2), testosterone (T), follicle-stimulating hormone (FSH) and sex hormone-binding globulin (SHBG) concentrations measured in three stages of the menopause transition.
Methods
A study of adipocytokines and menopause was nested in a population-based, longitudinal study of Caucasian women [Michigan Bone Health and Metabolism Study (MBHMS)]. Annual serum and urine samples, available from the MBHMS repository, were selected to correspond to the pre-, peri-, and postmenopause stages of the menopause transition. Participants included forty women, stratified into obese vs. non-obese groups based upon their baseline body mass index, who had specimens corresponding to the three menopause stages.
Results
Mean resistin levels were approximately two times higher during premenopause compared to peri- or postmenopause. There were significantly lower adiponectin and higher ghrelin levels in the perimenopause stage, compared to either the pre- or postmenopause stage. Increases in FSH concentrations were significantly and positively associated with higher leptin in non-obese women (P<0.01) but not in obese women (P<0.23). Increases in FSH concentrations were also significantly (P<0.005) and positively associated with higher adiponectin concentrations but were negatively associated with ghrelin concentrations (P<0.005). Associations remained following adjustment for waist circumference, waist circumference change, chronological age, and time between measures.
Conclusions
Menopause stages and underlying FSH changes are associated with notable changes in levels of the metabolically-active adipocytokines and ghrelin and these changes may be related to selected health outcomes observed in women at mid-life.
Keywords: Menopause, adipocytokines, leptin, adiponectin, resistin, ghrelin, obesity
INTRODUCTION
Longitudinally, we have demonstrated changes in body fat and its distribution during the menopause transition [1], but the health-related implications for these body composition changes are ill-defined. In addition to being an energy reservoir, adipose tissue is an endocrine organ and site of sex steroid metabolism and leptin production [2–4]. It remains to be demonstrated whether sex steroid production or their change impacts the size and distribution of fat cells or, conversely, whether products associated with fat cells influence sex steroid level changes, particularly those associated with the menopause.
Reports suggest that adipocytokines and ghrelin are related to reproduction and menopause. In studies of infertility, high leptin levels reduce ovarian responsiveness to gonadotropin treatment [5] leading investigators to suggest that leptin represents a physiological link between obesity and infertility [6]. Agarwal [6] argued that high physiologic concentrations of leptin could interfere with the dominant follicle's estradiol (E2) production and with aromatase enzyme activity or expression. Such an effect could produce an inadequate luteinizing hormone (LH) surge and an immature or absent preovulatory follicle. Since the menopause transition includes a diminished number of follicles available for selection and the increasing likelihood that no viable dominant follicle is produced, factors that impinge upon follicle selection may alter age at menopause.
Compared to non-obese women, obese women may have a different age at menopause, different menopausal bleeding patterns and symptom pattern [7], but there have been limited study of the adipocytokines to explain this variation. In Japanese women, adiponectin levels were similar in premenopausal and postmenopausal women [8]. Ghrelin was negatively correlated with measures of adiposity in postmenopausal women, but exhibited no correlation with any measure of adiposity in premenopausal women [9]. Others have reported that estrogen is a negative regulator of resistin gene expression [10].
Using a nested prospective study design, we assayed adipocytokines and ghrelin from samples in 40 women using specimens from three stages of their menopause transition (pre-, peri, and postmenopause), combined with existing information about body size and sex steroid hormone concentrations. Recognizing that there are differences in adipocytokines by body size, an equal number of obese and non-obese women were evaluated to address the following questions:
Is there an association of menopause stage with the adipocytokines and ghrelin, and are these the same in obese and non-obese women?
Are follicle-stimulating hormone (FSH), estradiol (E2), total testosterone (T) and sex hormone-binding globulin (SHBG) concentrations measured in three menopause stages associated with adipocytokine and ghrelin measures and their changes?
With the increasing prevalence of obesity, it is important to identify if adipose-tissue derived adipocytokines alter risks for health outcomes during the menopause experience.
METHODS AND MATERIALS
Study Population and Sample Selection
Specimens and data were assembled from the longitudinal Michigan Bone Health and Metabolism Study (MBHMS) located in Tecumseh, Michigan. MBHMS enrollees were the premenopausal female offspring of the Tecumseh Community Health Study (TCHS) participants. MBHMS enrollees were recruited for study in 1988 when they were 20 to 40 years of age and premenopausal. In 1992, Tecumseh female residents whose parents had not participated in TCHS were identified and enrolled using a population-based sampling frame that included age, name, address and telephone number; 121 additional women were enrolled. Therefore, the MBHMS cohort consists of 664 women, aged 24 to 44 years in 1992. Women have been followed annually since 1992, and at follow-up visits, specimens (urine and blood) and information about menstrual bleeding patterns are collected.
This study includes three measures (premenopause, perimenopause, postmenopause) nested within the larger longitudinal MBHMS study as shown in Figure 1. Women were excluded from analyses if all menopause stages were not represented (i.e., if they were still pre- or perimenopausal at the latest MBHMS visit). Also excluded were hormone therapy (HT) users and those with hysterectomy or a bilateral oophorectomy, diabetes, or thyroid disease. Women selected were limited to two baseline body size groups (BMI 23–27 kg/m2 or BMI 29–36 kg/m2) so women who did not have a BMI in the ranges of interest were excluded. Written informed consent was obtained from all participants, and this study was approved by the University of Michigan Institutional Review Board.
Figure 1.
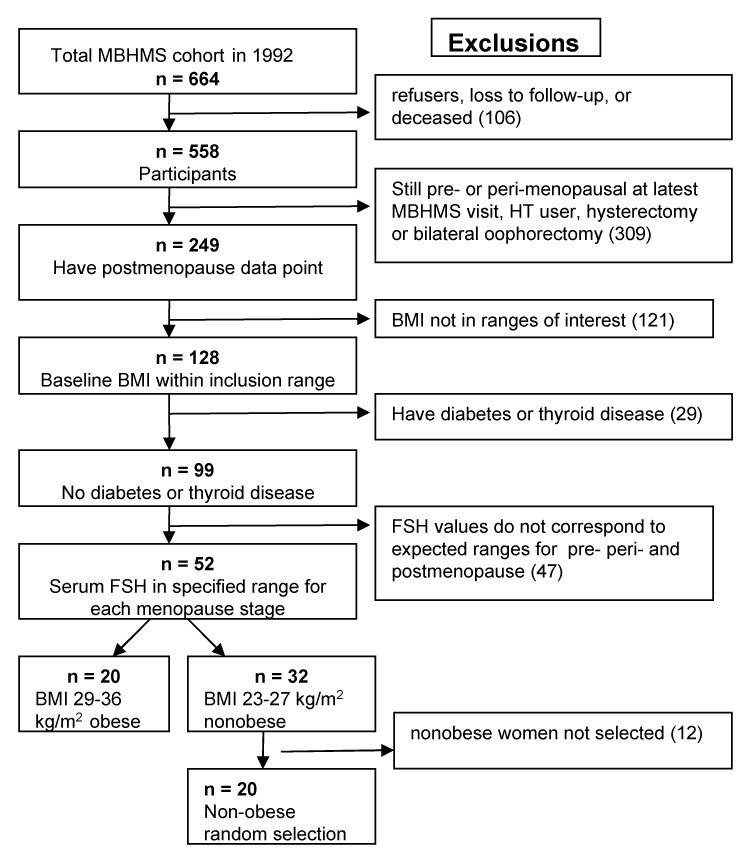
Selection process for nested, prospective study from population based cohort of women at mid-life
Measurements
Menopause stages were defined by menstrual bleeding regularity and follicle-stimulating hormone (FSH) levels. A woman was classified as premenopausal with menstrual regularity and an FSH < 10 mIU/mL at the study visit. Perimenopause was defined with menstrual irregularity and an FSH value between 10 and 40 mIU/mL. Postmenopausal women had at least twelve consecutive months of amenorrhea with no other medical cause and an FSH > 40 mIU/mL. Specimens were collected in days 2–7 of the follicular phase of the menstrual cycle in the morning and following an overnight fast. In postmenopausal women, specimens were collected on the anniversary of her study enrollment ± 15 days. Specimens were aliquoted and stored at −80 degrees Centigrade without thaw until assay.
Adipocytokines and Ghrelin
Serum adipocytokines (leptin, adiponectin, and resistin) and acylated ghrelin were determined spectrophotometrically using commercially available colorimetric enzyme immunoassay kits (leptin and acylated ghrelin kits, Cayman Chemical, Ann Arbor, MI and adiponectin and resistin, Linco, St. Charles, MO). The mean coefficient of variation percent (CV%) and standard errors for duplicate samples for each subject and lower limit of detection, respectively, were: adiponectin: 4.64 ± 0.34, 1.5 ng/mL; leptin: 4.22 ± 0.36, 1 ng/mL; resistin: 3.65 ± 0.24, 0.16 ng/mL; and, acylated ghrelin: 8.77 ± 1.24, 2 pg/mL.
Sex Steroid Hormones
Follicle-stimulating hormone (FSH) concentrations were measured with a two-site chemiluminometric immunoassay directed to different regions on the beta subunit with CV% of 12.0% and 6.0% and a lower limit of detection of 1.05 mIU/mL. Serum E2 concentrations were measured with a modified, off-line ACS:180 (E2-6) immunoassay to increase sensitivity, with a lower limit of detection of 1.0 pg/mL and CVs% of 10.6% and 6.4%. SHBG was assessed using a de novo two-site chemiluminescent assay developed on-site using rabbit anti-SHBG antibodies, with a CV% of 9.9% and 6.1% and lower limit of detection of 1.95 nM. Serum testosterone (T) concentrations were determined by competitive binding of a DMAE-labeled T derivative to a rabbit polyclonal anti--testosterone antibody premixed with monoclonal anti-rabbit IgG antibody immobilized on the solid phase paramagnetic particles. Inter- and intra-assay coefficients of variation were 10.5% and 8.5%, respectively, and the lower limit of detection was 2 ng/dl.
Anthropometric Measures
Height (cm) and weight (kg) were measured at annual visits using calibrated stadiometers and balance-beam scales, respectively. BMI was calculated by dividing the weight (in kilograms) by the square of the height (in meters). Data were organized as non-obese if the baseline BMI was 23 to 27 kg/m2 and obese if the baseline BMI was 29 to 36 kg/m2. Waist circumference was measured in centimeters at the narrowest point between the rib cage and iliac crest using a non-stretching tape.
Data analyses
Median and inter-quartile ranges were calculated for adipocytokines and ghrelin measures, sex steroid hormone measures (E2, FSH, SHBG, total T), age, and BMI. Non-normal measures were log-transformed for data analyses. Adipocytokines and ghrelin were modeled as the dependent variables while menopause state and sex steroid hormones were modeled as the independent variables. Longitudinal regression models were used to estimate beta coefficients as well as provide the LSmeans and standard errors for the adipocytokines at each menopause stage while adjusting for age at the pre-menopause stage, waist circumference, waist circumference change, and time interval between each menopause stage date of collection. By adjusting for premenopausal age as well as the duration of time between menopausal states, the changes in adipocytokines/ghrelin modeled are those across the menopause transition, independent of chronological aging. Adjustment was made for baseline waist circumference and waist circumference change between the previous and current menopausal state because waist increases across the menopause transition. A first-order autoregressive covariance structure was assumed for longitudinal models. P-values < 0.05 were considered statistically significant; all analyses were completed using SAS v9.1 software.
RESULTS
Non-obese women had a median age of 38.5 years at the premenopausal time point and 51.5 years at the postmenopausal time point (Table 1). Obese women had a median age of 40.0 and 52.0 years at the pre- and postmenopausal time points, respectively.
Table 1.
Ghrelin and adipocytokine concentrations and reproductive hormone concentrations in obese and non-obese women, characterized in three stages of the menopause transition (premenopause, perimenopause, and postmenopause)
| Non-obese women (n = 20) | Obese women (n = 20) | |||||
|---|---|---|---|---|---|---|
| Premenopause | Perimenopause | Postmenopause | Premenopause | Perimenopause | Postmenopause | |
| Median (IQR) | Median (IQR) | Median (IQR) | Median (IQR) | Median (IQR) | Median (IQR) | |
| Age | 38.5 (3.5) | 46.0 (3.5) | 51.5 (5.5) | 40.0 (5.5) | 47.5 (4.5) | 52.0 (4.5) |
| Body Mass Index (kg/m2) | 25 (2) | 26 (3) | 27 (3) | 33a (5) | 35a (6) | 35a (6) |
| Waist circumference (cm) | 78 (8) | 82 (13) | 88 (10) | 94 (12) | 102 (16) | 107 (13) |
| Analytes | ||||||
| Leptin (ng/mL) | 13.2 (6.4) | 22.3 (18.8) | 24.7 (8.1) | 37.2a (28.5) | 42.5b (41.4) | 35.0b (53.9) |
| Adiponectin (ng/mL) | 10822 (4755) | 9945 (5068) | 10145 (6128) | 8806 (4164) | 7915 (3469) | 8599 (3631) |
| Resistin (ng/mL) | 45.8 (23.8) | 22.3 (9.7) | 21.4 (9.2) | 48.2 (21.4) | 20.1 (5.0) | 21.4 (17.2) |
| Ghrelin (pg/mL) | 5.5 (33.6) | 39.1 (88) | 18.7 (33.9) | 4.9 (27.5) | 32.1 (87.5) | 6.6 (22.8) |
| Hormones | ||||||
| Follicle-stimulating hormone (FSH, mIU/mL) | 6.2 (3.4) | 17.5 (5.8) | 82.8 (32.3) | 4.6 (3.7) | 21.7 (12.3) | 51.2b (34.6) |
| Sex hormone-binding globulin (SHBG, nM) | 33 (26) | 45 (37) | 32 (39) | 25 (19) | 39 (43) | 32 (43) |
| Estradiol (E2, pg/mL) | 40 (24) | 36 (36) | 15 (7) | 55 (31) | 37 (40) | 17 (21) |
| Testosterone (ng/dL) | 20 (13) | 25 (23) | 34 (19) | 19 (10) | 25 (17) | 27 (18) |
IQR = Interquartile range, difference between 75th and 25th percentiles
Significant difference between obese women and non-obese women within menopause status category (P < 0.0001)
Significant difference between obese women and non-obese women within menopause status category (P < 0.05)
As shown in Table 1, in any given menopause status group, obese women had leptin concentrations that were greater than those of non-obese women (P < 0.05), and this difference persisted after adjustment for covariates (Figure 2). Adiponectin concentrations were lower in the obese group than the non-obese group although these values were not statistically significantly different (Table 1). Median resistin and ghrelin concentrations were not different in the two body size groups (Table 1).
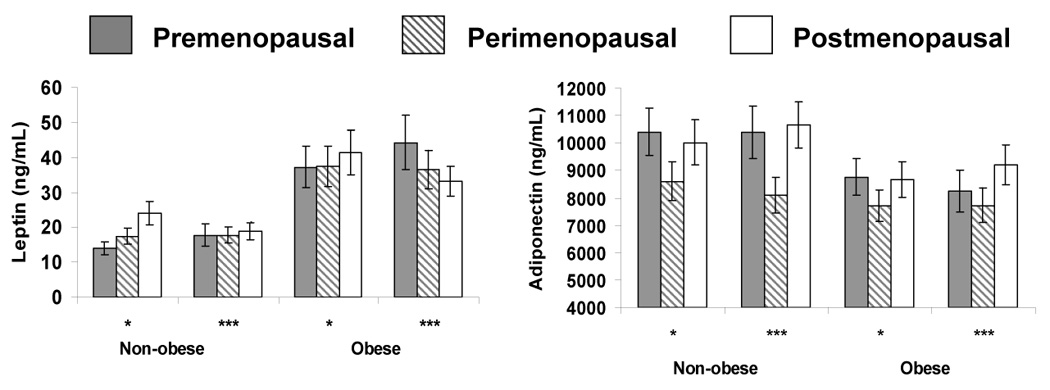
Figure 2.

Mean leptin and adiponectin concentrations (with standard deviation bars) by stages of the menopausal transition in 20 non-obese women and 20 obese women
*denotes unadjusted data; ***indicates adjustment for age at premenopause, premenopause waist circumference, waist circumference change, and the time interval between measures
Leptin, menopause stage, and hormones
While mean leptin levels increased in non-obese women from their pre- to postmenopause stage (P < 0.05) (Figure 2), this association was largely accounted for when adjusting for waist circumference, waist circumference change, and the time interval between menopause stages. In the obese group, there was no association of leptin with menopause stage before or after adjusting for covariates.
Baseline FSH levels were not associated with leptin levels, but FSH change [β (SE): 0.209 (0.08), p=0.014] was positively associated with leptin levels in non-obese women (Table 2). In obese women, there was no association between leptin change and change in FSH concentrations.
Table 2.
Regression modelsa for adipocytokine or ghrelin as predicted by serum hormone levels
| Premenopausal logFSH β (SE) | Change in logFSH β (SE) | Premenopausal logEstradiol β (SE) | Change in logEstradiol β (SE) | |
|---|---|---|---|---|
| logLeptin | ||||
| Non-obese | −0.054 (0.15) | 0.209 (0.08)* | 0.278 (0.18) | −0.146 (0.08) |
| Obese | −0.207 (0.16) | 0.234 (0.12) | 0.018 (0.14) | 0.060 (0.10) |
| logAdiponectin | 0.071 (0.06) | 0.085 (0.02)*** | −0.024 (0.05) | −0.017 (0.02) |
| logResistin | 0.067 (0.07) | −0.024 (0.04) | 0.022 (0.07) | 0.067 (0.04) |
| logGhrelin | −0.333 (0.25) | −0.849 (0.22)*** | −0.006 (0.23) | 0.436 (0.21)* |
| Premenopausal logTestosterone β (SE) | Change in logTestosterone β (SE) | Premenopausal logSHBG β (SE) | Change in logSHBG β (SE) | |
| logLeptin | ||||
| Non-obese | −0.273 (0.13) | −0.203 (0.23) | 0.167 (0.17) | −0.600 (0.20)** |
| Obese | 0.196 (0.19) | −0.290 (0.26) | −0.115 (0.24) | −0.156 (0.21) |
| logAdiponectin | −0.052 (0.06) | 0.115 (0.07) | 0.098 (0.07) | 0.088 (0.06) |
| logResistin | −0.066 (0.08) | 0.174 (0.11) | 0.066 (0.10) | −0.047 (0.09) |
| logGhrelin | 0.112 (0.25) | −1.031 (0.49)* | −0.693 (0.39) | 0.843 (0.47) |
adjusted for age at premenopausal state, concurrent waist circumference, waist change, and elapsed time between menopause states
p≤0.05
p≤0.01
p≤0.005
E2, T, and their respective changes were not significantly associated with leptin concentrations. Change in SHBG was negatively associated with leptin levels in the non-obese [β (SE): −0.60 (.20), p=0.009] and obese group [β (SE): −0.16 (.21), P>0.05], but the association was significant only in the non-obese group, adjusted for covariates.
Adiponectin, menopause stage and hormones
Mean adjusted adiponectin levels were lower in women during their perimenopausal stage relative to their pre- or postmenopausal stages (Figure 2) in both obese and non-obese women. Differences persisted after adjusting for the covariates.
Change in levels of FSH was positively associated with change in adiponectin concentrations (P<0.005), following adjustment for covariates (Table 2). Change in E2, T, and SHBG concentrations were not predictive of adiponectin concentrations.
Resistin, menopause stage and hormones
Resistin levels were twice as high in women during the premenopause as compared to the peri- and postmenopause stages (Figure 3) (P<0.05) in both obese and non-obese groups. Neither baseline nor changes in FSH, E2, T, and SHBG concentrations predicted resistin concentrations (Table 2).
Figure 3.
Mean resistin and ghrelin concentrations (with standard deviation bars) by stages of the menopausal transition in 20 non-obese women and 20 obese women
*denotes unadjusted data; ***indicates adjustment for age at premenopause, premenopause waist circumference, waist circumference change, and the time interval between measures
Ghrelin, menopause stage and hormones
Ghrelin concentrations were markedly higher in the perimenopause stage, compared to both premenopause and postmenopause stages (Figure 3). Levels remained higher in obese and non-obese women following adjustment for covariates.
Change in FSH levels were negatively associated with ghrelin concentrations (P<0.005), although baseline FSH was not predictive of ghrelin concentrations (Table 2). However, change in T levels negatively predicted ghrelin levels (P≤0.05) while change in E2 concentrations were positively associated ghrelin concentrations (P<0.05) following adjustment for covariates.
DISCUSSION
This study describes the association of adipocytokines and ghrelin among obese and non-obese women studied in each of the three menopause stages of their menopause. Women were recruited from an epidemiological study of women's health rather than being recruited from clinical practices. The nature and direction of associations with menopause stage varied according to analyte. Leptin levels, as expected based on its origin in adipocytes, were markedly different based on body size. Notably, leptin concentrations varied with changes in FSH or menopause stage only among non-obese women; associations were not detected in the obese women. In contrast, adiponectin and ghrelin concentrations were different in the perimenopause stage compared to the postmenopause stage; these observations were corroborated by statistically significant associations with FSH change. Levels of resistin were twice as great during the premenopause stage as compared to the peri- or postmenopause stages. Importantly, these relationships remained after incorporating waist circumference, change in waist circumference, age, and the time intervals between each of these stages in statistical models.
In non-obese women, leptin levels increased from the premenopause stage to the postmenopause stage, though this pattern was not observed in obese women, who had consistently higher leptin levels at each stage. This leptin rise in non-obese women during the menopause transition may include a direct role for leptin during the ovulatory process [11]. Leptin reportedly influences gonadotropin-releasing hormone (GnRH) secretion by the hypothalamus and pituitary secretion of LH and FSH [12]. Leptin may influence steroidogenesis in granulosa cells through a concentration-related inhibition of the insulin-like growth factor I (IGF-I) augmentation of FSH-stimulated E2 production [6].
Resistin concentrations were remarkably higher in the premenopause stage compared to the perimenopause and postmenopause stages in both obese and non-obese women. Interestingly, there was no association of baseline level of FSH or change in FSH from peri- to postmenopause state. The absence of an association with baseline FSH levels may reflect the modest daily, early morning variation in FSH in the days 2–7 window of the premenopause compared with FSH variation in the peri and early postmenopause stages. Further, resistin levels were markedly lower at the perimenopause and postmenopause. This pattern was not associated with the rise in FSH through the perimenopause into the postmenopause, a pattern not explained by the literature. It was recently reported that resistin is produced in rat testis [13], but there are no published data indicating resistin production in the ovary (rat or human). It is possible that resistin is produced in the ovary and declines with increasing ovarian age. Future studies that correlate resistin with inhibin or AMH could help identify if resistin is more sensitive to the earliest events of the menopausal transition compared to the other adipocytokines [14,15].
Adiponectin levels were lower in the perimenopause in both obese and non-obese groups and that this observation was supported by the association with change in FSH. Adiponectin production was generally reduced in the obese. Adiponectin decreases glucose concentrations, is involved in free fatty acid oxidation and lipolysis, increases insulin sensitivity and suppresses the synthesis of proinflammatory cytokines [4]. It is notable that adiponectin levels were significantly lower during the perimenopause as compared to both pre- and postmenopause stage. These lower adiponectin levels may be a component of a constellation of metabolic activities associated with increase in waist circumferences around the final menstrual period [1].
Ghrelin levels were higher in the perimenopause in obese and non-obese women. In animal models, ghrelin stimulates the release of growth hormone from the pituitary [16] and alters feeding behavior and energy metabolism [17–20]. Ghrelin is down-regulated in human obesity and is up-regulated under conditions of negative energy balance such as anorexia nervosa [21]. Further investigations are warranted to determine if differences in adiponectin and ghrelin in the perimenopause are a part of those physiological events associated with fat deposition and increasing waist circumference around the final menstrual period.
Leptin concentrations were associated with both obesity status and SHBG. In another study, leptin was negatively associated with SHBG concentrations [22] consistent with our report. It is generally accepted that SHBG concentrations are lower in the overweight and obese, thereby altering the amount of bioavailable estrogen and T. Our finding of a strong, negative correlation between leptin levels and SHBG change is limited to non-obese women in the premenopause.
Increasing ghrelin levels were associated with less change in total T levels and more change in E2. Previous reports of associations of adipocytokines and T are limited to men and animal models. A case report indicates that normalization of leptin levels in a man with idiopathic hypothalamic hypogonadism lead to an improvement in T and E2 levels [23]. In men, circulating T levels were associated with differences in adiponectin concentration and higher adiponectin concentrations in eugonadal men vs. hypogonadal men [24]. It is unknown if adiponectin levels are associated with the aromatase-mediated conversion of T to E2 in women. We identified no association of adiponectin concentrations in this study of women and the role of ghrelin with T concentrations in women awaits further investigation.
A study strength is that women serve as their own controls. Other strengths include the availability of both menstrual bleeding data and FSH measures to corroborate the menopausal status and the ability to evaluate women with natural menopause; thus, the capacity to select women for study free of competing health conditions or HT use. A limitation of this preliminary study is the sample size which reduces our ability to test interactions between body size, the gonadotropins, and measures of carbohydrate metabolism or growth hormone metabolism. The most biologically relevant limitation is the relative absence many data points per woman across the transition to understand whether the menopause changes influence the adipocytokines or the converse. It is also possible that directionality is unique to a particular cytokine. Based on a post hoc false discovery rate approach, the associations of adipcytokines and ghrelin with FSH are unlikely to have occurred as a result of the impact of multiple tests on Type I error.
In summary, the menopause transition reflects important changes in metabolites associated with adipose tissues. Leptin levels increased across the menopause in non-obese women and this change was independently associated with FSH levels. Further, adiponectin and ghrelin were associated with a specific menopause stage and change in FSH levels. Resistin levels were high in the premenopause and dropped markedly at the perimenopause to levels that were sustained in the postmenopause. While the clinical relevance of adipocytokines and ghrelin during the menopause is yet to be defined, this study indicates that there are marked and changing interrelationships in the hormone-adipocytokine interface during menopause that may have important health-related effects.
ACKNOWLEDGEMENT
Grants or fellowships supporting the writing of the paper: This work was supported by AR041384 (Sowers, PI). Dr. Mancuso has grant support from NIH (HL077417). Dr. Eyvazzadeh has an Obstetrics and Gynecology Health Services Research Training grant (T32HD049340-01A1).
Footnotes
Publisher's Disclaimer: This is a PDF file of an unedited manuscript that has been accepted for publication. As a service to our customers we are providing this early version of the manuscript. The manuscript will undergo copyediting, typesetting, and review of the resulting proof before it is published in its final citable form. Please note that during the production process errors may be discovered which could affect the content, and all legal disclaimers that apply to the journal pertain.
REFERENCES
- 1.Sowers M, Zheng H, Tomey K, Karvonen-Gutierrez C, Jannausch M, Li X, Yosef M, Symons J. Changes in body composition in women over six years at midlife: ovarian and chronological aging. J Clin Endocrinol Metab. 2007;92(3):895–901. doi: 10.1210/jc.2006-1393. [DOI] [PMC free article] [PubMed] [Google Scholar]
- 2.Siiteri PK. Adipose tissue as a source of hormones. Am J Clin Nutr. 1987;45(1 Suppl):277–282. doi: 10.1093/ajcn/45.1.277. [DOI] [PubMed] [Google Scholar]
- 3.Zhang Y, Proenca R, Maffei M, Barone M, Leopold L, Friedman JM. Positional cloning of the mouse obese gene and its human homologue. Nature. 1994;372(6505):425–432. doi: 10.1038/372425a0. [DOI] [PubMed] [Google Scholar]
- 4.Meier U, Gressner AM. Endocrine regulation of energy metabolism: review of pathobiochemical and clinical chemical aspects of leptin, ghrelin, adiponectin, and resistin. Clin Chem. 2004;50:1511–1525. doi: 10.1373/clinchem.2004.032482. [DOI] [PubMed] [Google Scholar]
- 5.Tsai EM, Yang CH, Chen SC, Liu YH, Chen HS, Hsu SC, Lee JN. Leptin affects pregnancy outcome of in vitro fertilization and steroidogenesis of human granulosa cells. J Assist Reprod Genet. 2002;19:169–176. doi: 10.1023/A:1014889928191. [DOI] [PMC free article] [PubMed] [Google Scholar]
- 6.Agarwal SK, Vogel K, Weitsman SR, Magoffin DA. Leptin antagonizes the insulin-like growth factor-1 augmentation of steroidogenesis in granulosa and theca cells of the human ovary. J Clin Endocrinol Metab. 1999;84:1072–1076. doi: 10.1210/jcem.84.3.5543. [DOI] [PubMed] [Google Scholar]
- 7.Gold EB, Bromberger J, Crawford S, Samuels S, Greendale GA, Harlow SD, Skurnick J. Factors associated with age at natural menopause in a multiethnic sample of midlife women. Am J Epidemiol. 2001;153:865–874. doi: 10.1093/aje/153.9.865. [DOI] [PubMed] [Google Scholar]
- 8.Nishizawa H, Shimomura I, Kishida K, Maeda N, Kuriyama H, Nagaretani H, Matsuda M, Kondo H, Furuyama N, Kihara S, Nakamura T, Tochino Y, Funahashi T, Matsuzawa Y. Androgens decrease plasma adiponectin, an insulin-sensitizing adipocyte-derived protein. Diabetes. 2002;51:2734–2741. doi: 10.2337/diabetes.51.9.2734. [DOI] [PubMed] [Google Scholar]
- 9.Iwamoto I, Yoshimitsu N, Fujino T, Douchi T. Menopausal status influences the relationship between serum ghrelin levels and fat mass in healthy women. J Endocrinol Invest. 2005;28:405–409. doi: 10.1007/BF03347218. [DOI] [PubMed] [Google Scholar]
- 10.Huang SW, Seow KM, Ho LT, Chien Y, Chung DY, Chang CL, Lai YH, Hwang JL, Juan CC. Resistin mRNA levels are downregulated by estrogen in vivo and in vitro. FEBS Lett. 2005;579:449–454. doi: 10.1016/j.febslet.2004.12.010. [DOI] [PubMed] [Google Scholar]
- 11.Duggal PS, Van Der Hoek KH, Milner CR, Ryan NK, Armstrong DT, Magoffin DA, Norman RJ. The in vivo and in vitro effects of exogenous leptin on ovulation in the rat. Endocrinology. 2000;141:1971–1976. doi: 10.1210/endo.141.6.7509. [DOI] [PubMed] [Google Scholar]
- 12.Nagatani S, Guthikonda P, Thompson RC, Tsukamura H, Maeda KI, Foster DL. Evidence for GnRH regulation by leptin: leptin administration prevents reduced pulsatile LH secretion during fasting. Neuroendocrinology. 1998;67:370–376. doi: 10.1159/000054335. [DOI] [PubMed] [Google Scholar]
- 13.Nogueiras R, Barreiro ML, Caminos JE, Gaytan F, Suominen JS, Navarro VM, Casanueva FF, Aguilar E, Toppari J, Dieguez C, Tena-Sempere M. Novel expression of resistin in rat testis: functional role and regulation by nutritional status and hormonal factors. J Cell Sci. 2004;117:3247–3257. doi: 10.1242/jcs.01196. [DOI] [PubMed] [Google Scholar]
- 14.van Rooij IA, Tonkelaar I, Broekmans FJ, Looman CW, Scheffer GJ, de Jong FH, Themmen AP, te Velde ER. Anti-mullerian hormone is a promising predictor for the occurrence of the menopausal transition. Menopause. 2004;11:601–606. doi: 10.1097/01.gme.0000123642.76105.6e. [DOI] [PubMed] [Google Scholar]
- 15.Overlie I, Morkrid L, Andersson AM, Skakkebaek NE, Moen MH, Holte A. Inhibin A and B as markers of menopause: a five-year prospective longitudinal study of hormonal changes during the menopause transition. Acta Obstet Gynecol Scand. 2005;84:281–285. doi: 10.1111/j.0001-6349.2005.00490.x. [DOI] [PubMed] [Google Scholar]
- 16.Kojima M, Hosoda H, Date Y, Nakazato M, Matsuo H, Kangawa K. Ghrelin is a growth-hormone-releasing acylated peptide from stomach. Nature. 1999;402:656–660. doi: 10.1038/45230. [DOI] [PubMed] [Google Scholar]
- 17.Tschop M, Smiley DL, Heiman ML. Ghrelin induces adiposity in rodents. Nature. 2000;407:908–913. doi: 10.1038/35038090. [DOI] [PubMed] [Google Scholar]
- 18.Wren AM, Small CJ, Ward HL, Murphy KG, Dakin CL, Taheri S, Kennedy AR, Roberts GH, Morgan DG, Ghatei MA, Bloom SR. The novel hypothalamic peptide ghrelin stimulates food intake and growth hormone secretion. Endocrinology. 2000;141:4325–4328. doi: 10.1210/endo.141.11.7873. [DOI] [PubMed] [Google Scholar]
- 19.Masuda Y, Tanaka T, Inomata N, Ohnuma N, Tanaka S, Itoh Z, Hosoda H, Kojima M, Kangawa K. Ghrelin stimulates gastric acid secretion and motility in rats. Biochem Biophys Res Commun. 2000;276:905–908. doi: 10.1006/bbrc.2000.3568. [DOI] [PubMed] [Google Scholar]
- 20.Nakazato M, Murakami N, Date Y, Kojima M, Matsuo H, Kangawa K, Matsukura S. A role for ghrelin in the central regulation of feeding. Nature. 2001;409:194–198. doi: 10.1038/35051587. [DOI] [PubMed] [Google Scholar]
- 21.Shiiya T, Nakazato M, Mizuta M, Date Y, Mondal MS, Tanaka M, Nozoe S, Hosoda H, Kangawa K, Matsukura S. Plasma ghrelin levels in lean and obese humans and the effect of glucose on ghrelin secretion. J Clin Endocrinol Metab. 2002;87:240–244. doi: 10.1210/jcem.87.1.8129. [DOI] [PubMed] [Google Scholar]
- 22.Mingrone G, Greco AV, Giancaterini A, Scarfone A, Castagneto M, Pugeat M. Sex hormone-binding globulin levels and cardiovascular risk factors in morbidly obese subjects before and after weight reduction induced by diet or malabsorptive surgery. Atherosclerosis. 2002;161:455–462. doi: 10.1016/s0021-9150(01)00667-0. [DOI] [PubMed] [Google Scholar]
- 23.Ogura T, Tobe K, Mimura Y, Otsuka F, Yamauchi T, Imai A, Tsukamoto C, Iwasaki Y, Matsuura Testosterone modulates serum leptin concentrations in a male patient with hypothalamic hypogonadism. J Endocrinol Invest. 2000;23(4):246–250. doi: 10.1007/BF03343716. [DOI] [PubMed] [Google Scholar]
- 24.Lanfranco F, Zitzmann M, Simoni M, Nieschlag E. Serum adiponectin levels in hypgonadal males: influence of testosterone replacement therapy. Clin Endocrinol. 2004;60:500–507. doi: 10.1111/j.1365-2265.2004.02007.x. [DOI] [PubMed] [Google Scholar]