Abstract
Unlike F4-neuroprostanes (F4-NeuroPs), which are relatively selective in vivo markers of oxidative damage to neuronal membranes, there currently is no method to assess the extent of free radical damage to myelin with relative selectively. The polyunsaturated fatty acid adrenic acid (AdA) is susceptible to free radical attack and, at least in primates, is concentrated in myelin within white matter. Here, we characterized oxidation products of AdA as potential markers of free radical damage to myelin in human brain. Unesterified AdA was reacted with a free radical initiator to yield products (F2-dihomo-IsoPs) that were 28 Da larger than but otherwise closely resembled F2-isoprostanes (F2-IsoPs), which are generated by free radical attack on arachidonic acid. Phospholipids derived from human cerebral gray matter, white matter, and myelin similarly oxidized ex vivo showed that the ratio of esterified F2-dihomo-IsoPs to F4-NeuroPs was ∼10-fold greater in myelin-derived than in gray matter-derived phospholipids. Finally, we showed that F2-dihomo-IsoPs are significantly increased in white matter samples from patients with Alzheimer's disease. We propose that F2-dihomo-IsoPs may serve as quantitative in vivo biomarkers of free radical damage to myelin from primate white matter.
Keywords: damage, myelin, Alzheimer's disease, brain lipids
Compared with other organs, the primate central nervous system is enriched in two major PUFAs: adrenic acid (AdA; 22:4 ω6) and docosahexaenoic acid (DHA; 22:6 ω3) (1). In primate brain, AdA has its highest levels in myelin, which is most abundant in white matter; however, AdA also is found in synaptic vesicles that are found in gray matter (1). DHA has its highest levels in neuronal membranes that are present mostly as cell bodies and dendrites in gray matter and as axons in white matter (1). Compared with AdA and DHA, arachidonic acid (AA; 20:4 ω6) is more evenly distributed in brain. Because PUFA peroxidations can be self-propagating, their high concentrations in brain make this organ especially vulnerable to free radical damage. Indeed, free radical damage is thought to contribute significantly to the progression of many diseases of the central nervous system, including hypoxia/ischemia, trauma, multiple sclerosis, and human immunodeficiency virus-associated dementia, as well as to age-related neurodegenerative diseases, such as Alzheimer's disease (AD), Parkinson's disease, and amyotrophic lateral sclerosis (2).
Specific markers for DHA and AA peroxidations by free radicals are F4-neuroprostanes (F4-NeuroPs) (3) and F2-isoprostanes (F2-IsoPs) (3, 4). These isoprostanoids are chemically and metabolically stable: F4-NeuroPs can form up to 128 regioisomers and stereoisomers, whereas F2-IsoPs can form up to 64 isomers (5). Unlike enzymatic oxidations of hydrolyzed AA or DHA, free radicals initiate the oxidation of AA and DHA esterified to phospholipids. Both F2-IsoPs and F4-NeuroPs have been used repeatedly in the quantification of free radical damage to human brain from patients with various neurological diseases as well as the corresponding animal models (3). Although F2-IsoPs reflect free radical damage to all tissue elements because of the pervasive distribution of AA, F4-NeuroPs provide a unique and relatively selective window into neuronal membrane free radical damage, because DHA is highly concentrated in this structure (5).
White matter consists of several types of glia, myelin derived from resident oligodendroglia, and axons projecting through from gray matter. White matter is unequivocally damaged in diseases like multiple sclerosis and in hypoxic/ischemic injuries like stroke and periventricular leukomalacia (6). However, even AD shows white matter loss that is disproportionately greater than expected from the amount of neuronal death (7), raising the possibility of direct damage to white matter despite being considered a disease of gray matter; indeed, reduced tissue concentrations of white matter AdA have been reported in AD (8, 9). We have shown that F4-NeuroPs and F2-IsoPs are increased in white matter involved by recent periventricular leukomalacia, indicating oxidative damage to axons and perhaps other tissue elements in this disease (6) but leaving open the issue of oxidative damage to myelin, because there is no relatively selective measure of oxidation of this organelle. In the present study, F2-IsoP-like products arising from free radical attack on AdA were characterized and quantified in human brain, and we suggest that these may be useful markers of free radical damage to myelin in primate white matter.
EXPERIMENTAL PROCEDURES
Incubation of unesterified polyunsaturated fatty acids with a free radical initiator
Liposomes of AA, DHA, or AdA (Nuchek Prep, Elysian, MN) were prepared as described previously (10). Briefly, PUFA (10 mg) was vortexed with 10 ml of phosphate-buffered saline (10 mM potassium phosphate, pH 7.4, and 10 mM sodium chloride). The dispersion was ultrasonicated for 3 min while cooling on ice. The resulting liposomes were mixed at 37°C with the hydroperoxide generator 2,2′-azo-bis(2-methylpropionamidine)dihydrochloride (AAPH; Aldrich Chemical Co.) using a gyrorotary water bath set at 80 rpm; aliquots (200 μl) were removed and rapidly cooled over ice.
Quantification of isoprostanoids
Isoprostanoids were quantified by stable isotope dilution assay using the internal standard [3,3′,4,4′-D4]15-F2t-IsoP added just before solid-phase extraction exactly according to previously published detailed methods (11). Isoprostanoids were released by saponification after extractive isolation (Folch) of tissue, sequentially extracted on C18 and silica cartridges, and derivatized as described for F2-IsoPs (11) using authentic 17-F4c-NeuroP as a standard (12). Products were converted to pentafluorobenzyl esters for isolation by TLC. More than 95% of AdA-derived F2-IsoP-like esters were detected ±2 cm relative to a codeveloped 17-F4c-NeuroP methyl ester (Rf = 0.30). Esters were partitioned into ethyl actetate, converted to trimethylsilyl ethers for capillary GC, and detected by mass spectrometry after conversion to negative ions by chemical (CH4) ionization (NICI), as described previously (6).
Structural characterization of products from unesterified AdA
Pentafluorobenzyl esters of fatty acid oxidation products were reacted with N,O-bis(trimethylsilyl)trifuoroacetamide or N,O-bis(trimethyl-D9-silyl)trifuoroacetamide (99.6% deuterated; CDN Isotopes, Pointe-Claire, Quebec, Canada) and analyzed by NICI-GC-MS (11) to determine the number of hydroxyl moieties, whereas the configuration of hydroxyl moieties was assessed using n-butyl boronate (Boron Molecular, Research Triangle Park, NC) and N,O-bis(trimethylsilyl)-trifluoroacetamide (BSTFA) (13, 14). The resulting butylboronyldiester trimethylsilylether pentafluorobenzyl esters were dried under N2, rapidly suspended in undecane, and analyzed using NICI-GC-MS. The number of double bonds in oxidized products was determined by catalytic hydrogenation using PtO4 (Adam's catalyst) stirring in CH3OH to which H2 was introduced for 12 min; samples were transferred to a Pasteur pipette containing a 1.0 inch silica gel (100–200 mesh, Unisil; Clarkson Chromatography, South Williamsport, PA) and eluted with 5 ml of CH3OH to remove catalyst particles.
LC-MS was carried out using a ThermoFinnigan TSQ Quantum Ultra mass spectrometer in negative ion mode. Pentafluorobenzyl esters of F2-IsoPs were separated by normal-phase HPLC using 12% isopropanol in hexanes at a flow rate of 1 ml/min on a Beckman Ultrasphere 5μ (4.6 mm × 25 cm) silica column. The atmospheric pressure chemical ionization source was fitted with a deactivated fused silica capillary (100 μm inner diameter). Nitrogen was used as both the sheath gas and the auxiliary gas, at 45 and 17 p.s.i., respectively. The mass spectrometer was operated in negative ion mode with a capillary temperature of 300°C, vaporizer temperature of 460°C, discharge current of 20 mA, and −94 V tube lens voltage. Collision-induced dissociation (CID) was performed from 20 to 30 eV under 1.5 mTorr of argon. Spectra that are shown were obtained at 25 eV. Spectra were displayed by averaging scans across chromatographic peaks. Selective reaction monitoring (SRM) was performed according to characteristic fragmentation patterns of isoprostanes (11). Data acquisition and analysis were performed using Xcaliber software, version 1.3.
Human brain samples and myelin preparation
Human brain was obtained from the University of Washington AD Research Center Neuropathology Core. All tissue was obtained after appropriate consent was given and used in accordance with institutional review board approval. Human cerebral cortical gray matter from temporal lobe (500 mg wet weight) and white matter (25.4 g wet weight) from centrum semiovale and corpus callosum (postmortem interval between death and tissue freezing was between 2 and 11 h) were from adult men and women without clinical history or pathologic evidence of neurologic disease (controls; n = 6) and had been stored at −70°C. Myelin was isolated from white matter using differential flotation and osmotic shock at 4°C (15) and stored at −20°C. In addition to these samples, four prospectively collected consecutive samples of frontal lobe white matter from patients with AD (average age ± SD = 84 ± 9 years) diagnosed according to consensus criteria (16) and four controls (average age ± SD = 87 ± 5 years), all with postmortem interval < 6 h (average ± SD wet weight = 508 ± 192 mg), were flash-frozen in liquid nitrogen at the time of autopsy and stored at −70°C until analyzed. As needed, protein concentrations were assessed using a bicinchoninic acid kit (Pierce Chemical Co., Rockford, IL).
SDS-PAGE and Western blots
Aliquots reflecting 500 μg wet weight of original sample were boiled for 5 min in Laemmli buffer (17) and then separated by SDS-PAGE using 8–16% gels (Bio-Rad, Hercules, CA). Proteins were visualized directly using Coomassie blue stain or transferred to polyvinylidene fluoride membranes for Western blotting (18). Primary antibodies for the 25 kDa synaptosome-associated protein (C-18), septin 3 (H-50), myelin-associated oligodendrocytic basic protein (P-18), proteolipid protein (G-17), synaptophysin (H-93), and myelin basic protein (D-18) were purchased from Santa Cruz Biotechnology (Santa Cruz, CA). Antibodies for neurofilaments (2F11) and a 95 kDa postsynaptic density protein (K28/43) were obtained from Dako (Carpinteria, CA) and Upstate Biotech (Lake Placid, NY).
Quantification of polyunsaturated fatty acids and aldehydes in phospholipids from myelin, white matter, and gray matter
Total fatty acids and aldehydes were quantified using a gas chromatograph fitted with an autosampler and flame ionization detector (models 7673 and 5890; Hewlett Packard, Palo Alto, CA). After 250 μg of methyl docosatrienoate (22:3n-3) was added as an internal standard (19), the fatty acids esterified to phospholipids in ∼100 mg (wet weight) of tissue were transmethylated, and the fatty aldehydes were converted to dimethylacetals (20). Fatty acids and aldehydes were identified by matching sample retention times with those of standards (Agilent Technology, Wilmington, DE), with modifications to improve separation for DHA (21). Palmitaldehyde was purchased from Sigma (St. Louis, MO). Individual and mixes of fatty acid methyl esters were purchased from Nuchek Prep and Supelco (Bellefonte, PA). Detector responses were determined using Mix 566B (Nuchek Prep) at four concentrations. Data represent the average of two injections.
Incubations of esterified AdA with a free radical initiator
Human myelin was isolated as described above from 500 mg (wet weight) of white matter extracted in 5 ml using a modified Folch procedure (22, 23), filtered under N2, and partitioned into organic solvents. 2,6-Di-tert-butyl-p-cresol (50 μg/ml) was added to all organic solvents, which were of HPLC or Optima grade (Fisher Scientific, Pittsburgh, PA). Total phospholipids were isolated by silicic acid chromatography (24). High-performance TLC was used to monitor fraction contents (23). Limited lipolysis was apparent because only small amounts of free fatty acids and trace amounts of diglycerides were detected in the CHCl3 (neutral lipid) fraction. No phospholipids eluted in the acetone (glycolipid) fraction. Because some glycolipids were detected in the phospholipid fraction, myelin and white matter phospholipids were separated a second time.
Phospholipid liposomes, 2.2 mM for gray matter, 1.8 mM for white matter, and 2.3 mM for myelin (concentrations were estimated based on total fatty acid and aldehyde content as described above), were incubated with 3.0 mM AAPH, and 200 μl aliquots were transferred to ice-cold CHCl3/CH3OH/0.88% KCl (6.7:3.3:2, v/v). Samples were rapidly mixed by inversion and sedimented at 3,000 g for 10 min at 4°C. The organic phase was mixed with ice-cold CH3OH/0.88% KCl (1:1, v/v) and sedimented again. The washed lower phase was cooled to −20°C and purged for 5.0 min with N2 bubbles before concentrating the sample under a N2 stream. Oxidized phospholipids were suspended in CH3OH and stored at −20°C. Esterified oxidized fatty acids were released by saponification (11), extracted, derivatized, and analyzed as described above for unesterified oxidized fatty acids.
Statistics
ANOVA, t-tests, and regression analyses were performed using GraphPad Prism (San Diego, CA) with α set to 0.05.
RESULTS
Identification and quantification of unesterified AdA products
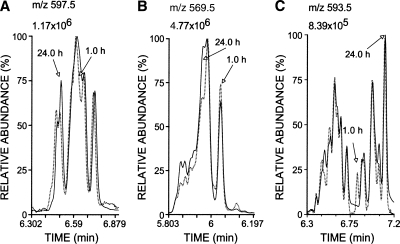
Liposomes of AdA were mixed with AAPH, a water-soluble free radical initiator, to test whether AdA generates isoprostanoid products analogous to F2-IsoPs or F4-NeuroPs. After 1 or 24 h of incubation at 37°C, reactants were separated by solid-phase extraction, derivatized like F2-IsoPs and F4-NeuroPs, and then analyzed by NICI-GC-MS with selected ion monitoring for the expected AdA-derived F2-IsoP-like isoprostanoids with m/z 597.5 (Scheme 1). For comparison purposes, AA and DHA were likewise incubated, and the F2-IsoP and F4-NeuroP products were similarly processed and analyzed. Like AA and DHA (25), AdA reacted with AAPH produced multiple compounds that underwent little change in proportions over time (Fig. 1). The carboxyl anions formed from silylated F2-IsoPs and F4-NeuroPs reflected isomers with common m/z of 569.5 and 593.5, respectively (Fig. 1B, C); carboxyl anions of silylated AdA products suggested isomers with a common m/z of 597.5, which is 28 Da [(CH2)2] greater than that of F2-IsoPs. Omission of either the esterification or silylation step resulted in an inability to detect these products by full scans during NICI-GC-MS. As expected, the profile of AdA products consisted of five major peaks, like F2-IsoPs, whereas both had less complex profiles than F4-NeuroPs that closely resembled published chromatograms (5, 25).
Scheme 1.
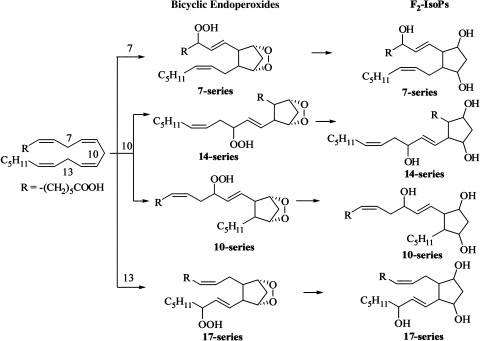
Formation of 7-, 10-, 14-, and 17-series F2-isoprostanes (F2-IsoPs).
Fig. 1.
Oxidation of adrenic acid (AdA) (A) produced multiple isoprostanoids that more closely resembled F2-IsoPs (B) than F4-neuroprostanes (F4-NeuroPs) (C). A concentration of 1.5 mM unesterified AdA, arachidonic acid (AA), or docosahexaenoic acid (DHA) was sonicated and incubated with 1.0 mM 2,2′-azo-bis(2-methylpropionamidine)dihydrochloride (AAPH) for 1 or 24 h. After solid-phase extraction, products were converted to trimethylsilylether pentafluorobenzyl esters. Ions reflecting carboxyl anions at m/z 597.5 (A; AdA-derived F2-IsoP-like compounds), 569.5 (B; F2-IsoPs), or 593.5 (C; F4-NeuroPs) were monitored using negative ion chemical ionization gas chromatography-mass spectrometry (NICI-GC-MS). Profiles at 1 h were normalized so that the peak with maximum intensity matched that found in the 24 h profile.
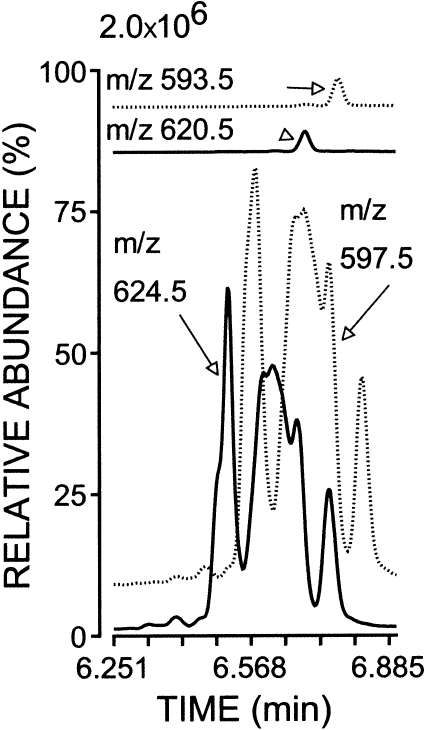
AdA-derived F2-IsoP-like compounds and authentic 17-F4c-NeuroP were converted to pentafluorobenzyl esters and silylated with [D0]BSTFA or [D9]BSTFA to determine the number of hydroxyl groups. Compared with [D0]BSTFA, silylation with [D9]BSTFA increased the mass of 17-F4c-NeuroP by the expected 27 Da [3 × (CD3)3Si-] for the three hydroxyl groups. Silylation with [D9]BSTFA uniformly increased by 27 Da the mass of AdA-derived F2-IsoP-like compounds without altered peak proportions (Fig. 2) and without the generation of ions with +9 or +18 Da increase in mass (data not shown). Moreover, reactions with [D0]BSTFA and [D9]BSTFA did not alter the area ratios of AdA-derived F2-IsoP-like isoprostanoids to 17-F4c-NeuroP (75.0 ± 1.1 vs. 74.3 ± 1.7; n = 5–7). Although the retention times were similar for the [D0] and [D27] derivatives, an isotopic effect was evident, because deuterated 17-F4c-NeuroP eluted 4.8 s before its protium derivative. Similarly, all AdA-derived F2-IsoP-like isoprostanoids eluted 4.2 s before the nondeuterated derivative. These findings indicated that pentafluorobenzyl esters of AdA-derived F2-IsoP-like compounds were sialylated similarly to 17-F4c-NeuroP.
Fig. 2.
Silylation with N,O-bis(trimethyl-D9-silyl)trifluoroacetamide increased the mass of derivatized AdA-derived F2-IsoP-like compounds by 27 Da. Isoprostanoids were converted to pentafluorobenzyl esters and silylated with ((CH3)3Si)2NCOCF3 or ((CD3)3Si)2NCOCF3. NICI-GC-MS tracings for the protium derivative of 17-F4c-NeuroP (m/z 593.5) and AdA-derived F2-IsoP-like compounds (m/z 597.5) are shown as dotted lines. Tracings of the deuterated derivative of 17-F4c-NeuroP (m/z 620.5) and AdA-derived F2-IsoP-like compounds (m/z 624.5) are presented as solid lines.
Next, we determined whether two of the three hydroxyls occurred in the cis configuration. AdA-derived F2-IsoP-like compounds were converted to pentafluorobenzyl esters and reacted with n-butylboronic acid followed by BSTFA for analysis with NICI-GC-MS. Butylboronic acid forms a diester with diols on the same side of the prostanoid ring (cis), but not with trans diols (13). Standards (15-F2t-IsoP and 17-F4c-NeuroP) with two hydroxyl moieties in the cis configuration on the cyclopentane ring also were analyzed. Both the 15-F2t-IsoP and 17-F4c-NeuroP were converted [98.1 ± 0.4% (relative SD) (n = 6) and 100% (n = 4), respectively] to a butylboronyldiester trimethylsilylether pentafluorobenzylester. In a similar manner, AdA-derived F2-IsoP-like isoprostanoids were converted [98.4 ± 0.2% (relative SD); n = 4] to a butylboronyldiester trimethylsilylether pentafluorobenzyl ester.
AdA-derived F2-IsoP-like compounds next were subjected to catalytic hydrogenation to evaluate the extent of unsaturation. AdA products generated by AAPH were isolated by solid-phase extraction. Half of the isolated products were reacted with H2 and PtO2. Hydrogenated and nonhydrogenated samples were converted to trimethylsilylether pentafluorobenzyl esters and analyzed by NICI-GC-MS. For comparison purposes, the F2-IsoPs and F4-NeuroPs generated by AAPH were similarly evaluated. Importantly, the profile of hydrogenated AdA-derived F2-IsoP-like compounds had a similar number of major peaks as hydrogenated F2-IsoPs (data not shown), suggesting that they were simple homologs of F2-IsoPs. Hydrogenation increased the mass of AdA-derived F2-IsoP-like compounds from m/z 597.5 to 601.5 (Δ4 Da). Scans over a range of m/z 593.5–601.5 revealed no other increases in mass. As expected, hydrogenation also increased the mass of derivatized F2-IsoPs from m/z 569.5 to 573.5 (Δ4 Da) and the mass of derivatized F4-NeuroPs from 593.5 to 601.5 (Δ8 Da). The use of appropriate scans demonstrated that only the fully reduced compounds were formed. Thus, catalytic hydrogenations completely reduced the two double bonds in AdA-derived F2-IsoP-like compounds and F2-IsoPs and the four double bonds in F4-NeuroPs.
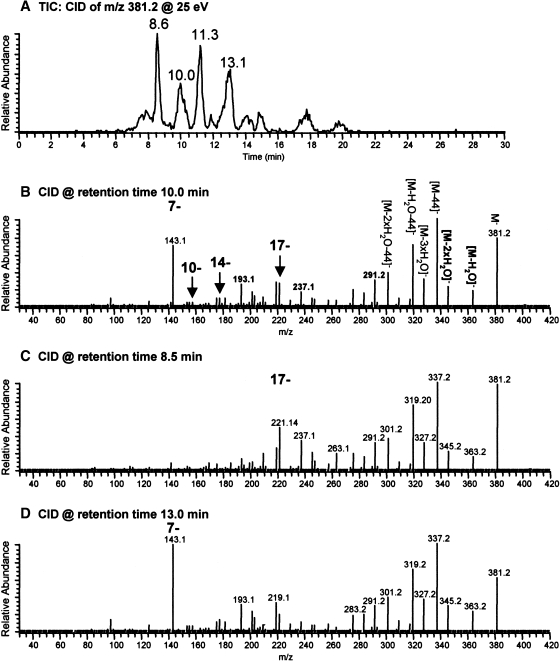
Next, we determined whether AdA oxidation products, like F2-IsoPs, form four series of regioisomeric isoprostanoids, the 7-, 10-, 14-, and 17-series (Scheme 1) (26, 27). CID experiments were carried out to study the structure of these different regiosiomers. The fragmentation patterns of F2-IsoPs in CID experiments have been studied extensively, and similar types of fragments can be anticipated in CID AdA-derived F2-IsoP-like compounds (28). The total ion chromatogram of m/z 381 is shown in Fig. 3A, and a series of peaks can be seen that correspond to the different isomers of AdA-derived F2-IsoP-like compounds. For example, the peak at retention time 10.0 min is a mixture of all of the possible regioisomers (Fig. 3B), whereas the peak at 8.5 min comprises primarily 17-series regioisomers (Fig. 3C) based upon predicted fragmentation patterns for different regioisomers. The peak at 13 min corresponds to the 7-series of AdA-derived F2-IsoP-like compounds (Fig. 3D).
Fig. 3.
Collision-induced dissociation (CID) spectra of AdA-derived F2-IsoP-like compound pentafluorobenzyl esters analyzed by normal-phase LC-atmospheric pressure chemical ionization-MS. A: Total ion chromatogram (TIC) of m/z 381.2 at 25 eV. B: CID spectrum of the peak at 10.0 min. C: CID spectrum of the peak at 8.5 min. D: CID spectrum of the peak at 13 min.
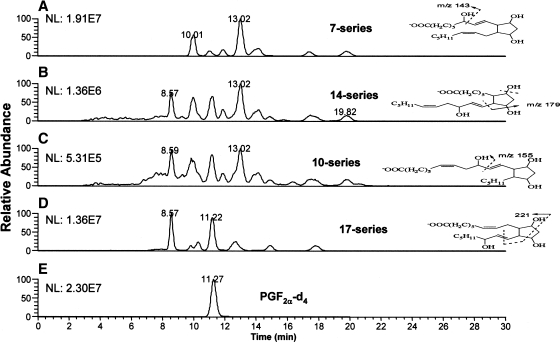
SRM experiments were conducted to select the parent ion of m/z 381 to the corresponding characteristic fragmentation of each regioisomer of AdA-derived F2-IsoP-like compounds (Fig. 4). For example, a fragmentation of m/z 143 resulted from the α-cleavage of 7-series isomers, whereas 17-series isomers had a characteristic fragment of m/z 221. Most of the diastereomers of each class can be separated by this normal-phase LC method. Theoretically, eight diastersomers from each class can be formed, and seven peaks were observed for both the 7- and 17-series. It is likely that the major isomers are those with the cis-alkyl side chains of the cyclopentane rings. As is evident, the 7- and 17-series are major regioisomers compared with the 14- and 10-series. The formation of dioxolane-isoprostanes from 14- and 10-series isomers may be responsible for the regioselectivity, as in the case of arachidonate oxidation (29). In combination, these structural data from derivatization, CID, and SRM experiments establish that the F2-IsoP-like compounds generated from AdA oxidation are F2-dihomo-IsoPs.
Fig. 4.
Selective reaction monitoring (SRM) of AdA-derived F2-IsoP-like compound pentafluorobenzyl esters analyzed by LC-atmospheric pressure chemical ionization-MS. A: SRM, m/z 381–143, 7-series. B: SRM, m/z 381–179, 14-series. C: SRM, m/z 381–155, 10-series. D: SRM, m/z 381–221, 17-series. E: Internal standards (PGF2α-d4), SRM, m/z 357–197 at 30 eV. NL, normalized intensity.
The formation of F2-dihomo-IsoPs from the oxidation of AdA liposomes showed time and concentration dependence with the free radical initiator. In our first experiments, AdA (1.5 mM) was incubated with AAPH (1.0 mM); aliquots were removed at 0, 0.5, 1, 2, 4, 8, 16, and 24 h and mixed with authentic 17-F4c-NeuroP. After isolation, derivatization, and analysis, F2-dihomo-IsoPs were quantified by integrating total areas. Means ± SEM (n = 4) for the area of F2-dihomo-IsoPs (m/z 597.5) divided by the area of 17-F4c-NeuroP (m/z 593.5) were plotted against AAPH exposure time. The concentrations of F2-dihomo-IsoPs increased linearly with time: slope ± SEM = 3.39 ± 0.13 and correlation coefficient = 0.90. Next, 3.0 mM AdA was incubated with varying concentrations of AAPH (0, 0.2, 0.4, 0.8, 1.0, 1.4, and 2.0 mM) for 4 h, and F2-dihomo-IsoPs were quantified similarly (n = 5). The amount of F2-dihomo-IsoPs increased linearly with AAPH concentration: mean ± SEM slope = 7.16 ± 0.53 and correlation coefficient = 0.97.
Quantification of F2-dihomo-IsoPs esterified to phospholipids from human cerebrum
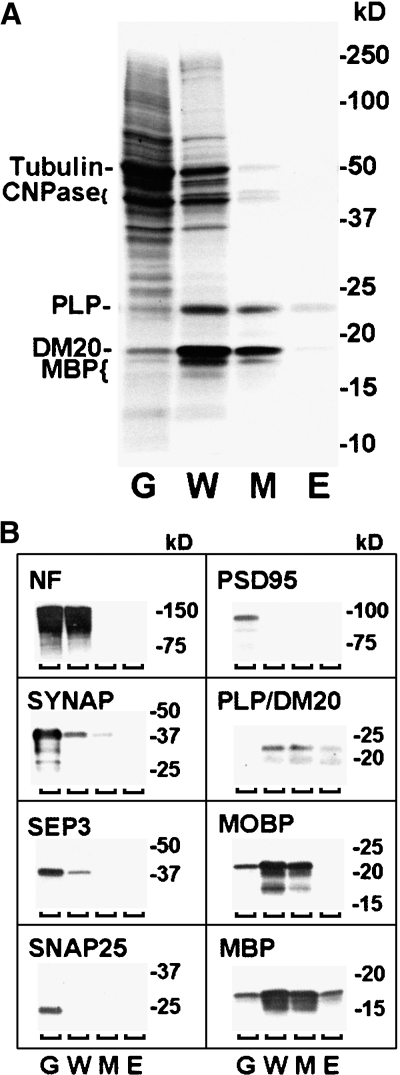
We first prepared phospholipid fractions from gray matter, white matter, and myelin of human cerebrum and evaluated them by SDS-PAGE (Fig. 5). As expected, the myelin fraction was distinct from gray and white matter in lacking significant amounts of high molecular mass proteins (Fig. 5A) (30). Western blots (Fig. 5B) demonstrated that the myelin fraction was enriched in proteolipids and myelin basic proteins and showed that the myelin fraction contained myelin-associated oligodendrocytic basic protein. Western blots also demonstrated that proteolipids and myelin binding proteins were present in the Folch extracts of myelin. As expected, neurofilament protein was abundant in both gray and white matter but was undetected in the myelin fraction (Fig. 5B). Furthermore, several synaptic proteins were much more abundant in gray matter than in white matter and were largely lacking in the myelin fraction. The protein constituents indicated that our myelin fraction contained predominantly myelin and was largely free of neuronal elements.
Fig. 5.
Constituents of human cerebral myelin fraction. Homogenized aliquots reflecting 500 μg of original tissue were applied to an SDS-PAGE gel (8–16%) for electrophoresis. Molecular mass standards were added to the far right lane. A: BioSafe Rapid Coomassie stain showed that myelin (M), in contrast to gray matter (G) or white matter (W), contained predominantly proteolipid protein (PLP; 30 kDa), a splice isoform of proteolipids (DM20; 20 kDa), and myelin basic proteins (MBP; 21.5, 18.5, and 17.5 kDa). Traces of 2′,3′-cyclic nucleotide-3′-phosphodiesterases 1 and 2 (CNPase; 46 and 48 kDa) and tubulin (55 kDa) were evident. Some proteolipid and basic proteins (barely visible) were present in the Folch extract (E) of myelin. B: Western blots showed that, like gray matter, white matter had abundant neurofilaments (NF; 150–160 kDa). However, white matter had only low levels of neuronal synaptophysin (SYNAP; 38 kDa) and septin 3 (SEP3; 40 kDa), and myelin had no detectable synaptosome-associated protein (SNAP25; 25 kDa) or 95 kDa postsynaptic density protein (PSD95; 95 kDa). White matter also had high amounts of myelin components like proteolipids and isoforms, myelin-associated oligodendrocytic basic protein (MOBP; 25 kDa plus splice variants), and myelin basic proteins. In contrast to white matter, myelin had no detectable neurofilaments, septin 3, or postsynaptic density 95 proteins and only trace levels of synaptophysin. Myelin and white matter had comparable amounts of myelin-associated oligodendrocytic basic protein, myelin basic proteins, and proteolipids. As in A, proteolipids and myelin basic proteins were detected in the Folch extract of myelin.
Phospholipid samples were subjected to acidic methanolysis (transesterification) after internal standard was added to determine the extent of AdA enrichment in phospholipids isolated from the myelin fraction (21, 31). Gray and white matter phospholipids were also transesterified for comparison. Phospholipids from myelin and white matter samples had PUFA contents representing 18–19% of the total fatty acids. In contrast, phospholipids from gray matter samples contained ∼30% PUFA. The percentage of PUFA consisting of AdA + AA + DHA ranged from 81% to 92% in the three phospholipid fractions. However, AdA/DHA molar ratios varied by 12-fold: AdA/DHA was 4.4, 2.6, and 0.38 in myelin, white matter, and gray matter phospholipids, respectively. Similar AdA/DHA enrichments have been reported by various investigators (8, 32). Thus, esterified AdA was highly concentrated in myelin-derived phospholipids, whereas DHA was concentrated in gray matter-derived phospholipids.
Much of the PUFA present in myelin is esterified to phospholipid plasmalogens. Because of acidic lability, plasmalogens may undergo rapid hydrolysis during postmortem autolysis (33). To assess the extent of postmortem changes in our phospholipid fractions, major fatty aldehydes in plasmalogens were converted to dimethyl-acetals and quantified as described above. The mol% of plasmalogens relative to total phospholipids was 31.0 for myelin, 26.8 for white matter, and 10.8 for gray matter; these values compare well with published values (34). These data confirmed our Western blot results on the enrichment of the phospholipid fractions and showed that these isolated phospholipids lacked significant PUFA losses attributable to postmortem hydrolysis.
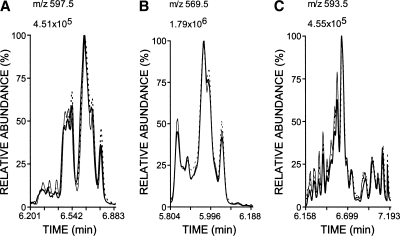
Phospholipids derived from gray matter, white matter, and myelins were oxidized with AAPH, and products formed in situ were released by saponification and then analyzed using NICI-GC-MS (Fig. 6). Esterified AdA (Fig. 6A), like AA (Fig. 6B) and DHA (Fig. 6C), was converted to multiple isoprostanoid isomers that varied little in proportion between 1 h (data not shown) and 24 h; F2-dihomo-IsoP peaks were more similar to the F2-IsoPs than to F4-NeuroPs. These data demonstrated that esterified AdA generated F2-dihomo-IsoPs. In these qualitative studies, the type and proportions of isoprostanoid products formed from AdA, DHA, and AA varied somewhat between esterified and nonesterified PUFA (5).
Fig. 6.
Esterified isoprostanoids were similar in phospholipids from different cerebral sources. After extractive isolation (Folch) plus silicic acid column chromatography, phospholipids (1.8–2.3 mM) from gray matter (black solid lines), white matter (dashed lines), and myelin (gray solid lines) were sonicated and incubated with 3 mM AAPH for 24 h. Isoprostanoids were released by saponification, isolated by solid-phase extraction, and derivatized. Ions at m/z 597.5 (A; F2-dihomo-IsoPs), 569.5 (B; F2-IsoPs), and 593.5 (C; F4-NeuroPs) were monitored during NICI-GC-MS. White matter and myelin profiles were normalized so that the peak with maximum intensity matched that found in gray matter profiles. Values shown below m/z indicate 100% relative abundance.
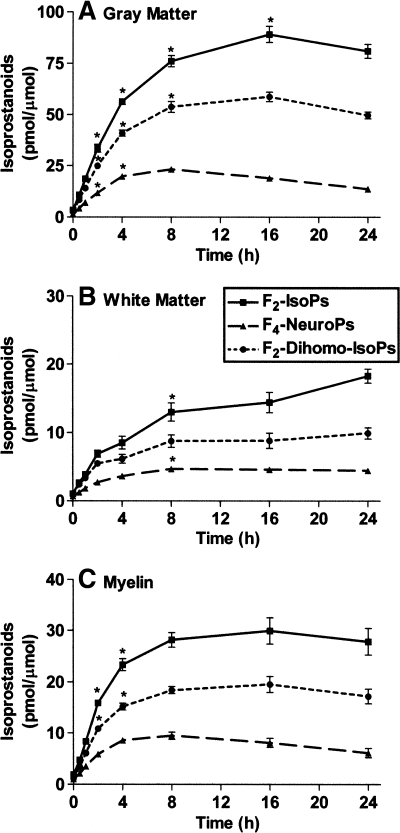
Next, we quantified the amount of isoprostanoids formed in human cerebral phospholipid preparations. Phospholipids were incubated with AAPH for up to 24 h as described above, and [D4]15-F2t-IsoP was added to each sample that was analyzed using NICI-GC-MS. Data for each isoprostanoid was expressed relative to initial parent fatty acid concentration in each liposome preparation: AA for F2-IsoPs, DHA for F4-NeuroPs, and AdA for F2-dihomo-IsoPs. The relative amount of each isoprostanoid formed varied significantly with phospholipid source, time, and interaction between these terms (P < 0.0001 for each) (Fig. 7). We calculated the initial slopes over 0–2 h for the three phospholipid sources for each of the three isoprostanoids (P < 0.0001 for each of the nine best-fit lines). The initial rate of relative formation for all three isoprostanoids had the same rank order with respect to phospholipid source: gray matter > myelin > white matter (Table 1). At later time points, the relative amounts of all three isoprostanoids stopped increasing significantly or even decreased, likely related to substrate depletion.
Fig. 7.
Esterified isoprostanoid formation was time- and phospholipid source-dependent. AAPH was incubated with phospholipids, and the resulting isoprostanoids were quantified by NICI-GC-MS analyses. Fatty acid levels were determined by GC-flame ionization detection. Data are means ± SEM (n = 4 or 5) of each isoprostanoid divided by its initial parent fatty acid level (F2-IsoPs divided by AA, F4-NeuroPs divided by DHA, and F2-dihomo-IsoPs divided by AdA) in each phospholipid preparation: gray matter-derived phospholipids (A), white matter-derived phospholipids (B), and myelin-derived phospholipids (C). Two-way ANOVA showed that the normalized amount of each isoprostanoid varied significantly with phospholipid liposome source, time, and interaction between these terms (P < 0.0001 for each). Posthoc analysis using one-way ANOVA for the amount of each isoprostanoid in the different phospholipid sources had P < 0.0001, and Bonferroni-corrected multiple comparisons of later time points (⩾2 h) had P < 0.05 (asterisks) compared with the immediately previous time point.
TABLE 1.
Initial relative formation of isoprostanoids in each phospholipid source
| F2-IsoPs
|
F2-Dihomo-IsoPs
|
F4-NeuroPs
|
||||
|---|---|---|---|---|---|---|
| Phospholipid Source | Slope 95% CI | r2 | Slope 95% CI | r2 | Slope 95% CI | r2 |
| Gray matter | 13.67–16.41 | 0.98 | 10.6–12.15 | 0.97 | 4.21–6.05 | 0.91 |
| White matter | 2.44–3.33 | 0.91 | 1.84–2.60 | 0.89 | 0.82–1.20 | 0.87 |
| Myelin | 6.68–7.50 | 0.99 | 4.60–5.18 | 0.99 | 2.18–2.71 | 0.97 |
CI, confidence interval; F2-IsoP, F2-isoprostane; F4-NeuroP, F4-neuroprostane. Data represent the formation of isoprostanoids relative to the initial parent fatty acid concentration in each phospholipid preparation [F2-IsoPs and arachidonic acid, F2-dihomo-IsoPs and adrenic acid (AdA), and F4-NeuroPs and docosahexaenoic acid (DHA)] at 0, 0.5, 1, and 2 h after the addition of 2,2′-azo-bis(2-methylpropionamidine)dihydrochloride (AAPH; n = 4 or 5). Two-way ANOVA had P < 0.0001 for time, phospholipid source, and interaction between these terms. Results presented are 95% CI for the slope of the best-fit line (pmol/μmol vs. time) over 0–2 h and correlation coefficient (r2).
We calculated the F2-dihomo-IsoP/F4-NeuroP ratio because this may provide an index of the relative oxidation of AdA versus DHA (Table 2). Initially, the ratio of AdA to DHA was very similar to the F2-dihomo-IsoP/F4-NeuroP ratio, suggesting that basal isoprostanoid levels largely reflect initial PUFA concentration in the different preparations. Next, phospholipids were oxidized with AAPH for up to 24 h. The 30 min time point showed that the F2-dihomo-IsoP/F4-NeuroP ratio did not change in gray matter phospholipids, increased 39% in white matter phospholipids, and increased 48% in myelin phospholipids, demonstrating that F2-dihomo-IsoPs are relatively selectively formed by the oxidation of myelin. By 24 h, these relative changes were even greater, with a 50% increase in gray matter phospholipids, a 64% increase in white matter phospholipids, and a 156% increase in myelin phospholipids. Viewed from another perspective, the F2-dihomo-IsoP/F4-NeuroP ratio was 9- to 10-fold greater in myelin phospholipids than in gray matter phospholipids oxidized with AAPH.
TABLE 2.
Ratios of AdA to DHA and their isoprostanoid products in oxidized phospholipid preparations
| Initial | 30 min of AAPH | 24 h of AAPH | ||
|---|---|---|---|---|
| Phospholipid Source | AdA/DHA | F2-Dihomo-IsoPs/F4-NeuroPs | F2-Dihomo-IsoPs/F4-NeuroPs | F2-Dihomo-IsoPs/F4-NeuroPs |
| Gray matter | 0.4 | 0.7 ± 0.0 | 0.7 ± 0.0 | 1.4 ± 0.1 |
| White matter | 2.6 | 3.6 ± 0.4 | 5.0 ± 0.6 | 5.9 ± 0.5 |
| Myelin | 4.4 | 4.8 ± 0.3 | 7.1 ± 0.2 | 12.3 ± 0.2 |
Data are ratios ± SEM (n = 4 or 5) of initial AdA/DHA or F2-dihomo-IsoPs/F4-NeuroPs as well as the latter ratio after incubation with AAPH for 30 min or 24 h. The F2-dihomo-IsoP/F4-NeuroP ratio was also determined at 1, 2, 4, 8, and 16 h (n = 4 or 5); however, all values were bracketed by these two time points. Two-way ANOVA had P < 0.0001 for the phospholipid source, time, and interaction between these terms.
Next, we quantified isoprostanoid concentrations in human frontal lobe white matter, a region of brain that according to neuroimaging studies may be affected by AD (7, 35), by the same method described above for ex vivo oxidized phospholipids, and normalized these to wet weight of starting tissue. In controls, the average ± SEM F2-IsoPs = 1.5 ± 0.1, F4-NeuroPs = 11.3 ± 0.6, and F2-dihomo-IsoPs = 14.5 ± 0.5 ng/g; these values for F2-IsoPs and F4-NeuroPs are similar to our previous results from studies on white matter (6). In patients with AD, the average ± SEM F2-IsoPs = 2.5 ± 0.8, F4-NeuroPs = 27.0 ± 7.0, and F2-dihomo-IsoPs = 28.7 ± 7.8 ng/g. Comparing control and AD values, t-tests had P < 0.05 for F4-NeuroPs and F2-dihomo-IsoPs but not for F2-IsoPs. We interpret these data as showing that two elements in white matter, axons and myelin, undergo increased free radical damage in AD. The ratio of F2-dihomo-IsoPs to F4-NeuroPs was not different between controls and patients with AD.
Finally, as an assessment of the potential for F2-dihomo-IsoPs as noninvasive markers of lipid peroxidation, we measured F2-IsoPs and F2-dihomo-IsoPs in 1 ml of urine from each of six adult volunteers (11). Average ± SEM F2-IsoPs = 1.9 ± 0.3 ng/ml; no F2-dihomo-IsoPs were detected in these samples.
DISCUSSION
We tested the hypothesis that oxidation of AdA would yield isoprostanoids homologous to the F2-IsoPs but containing two additional carbon atoms, and we termed these AdA oxidation products F2-dihomo-IsoPs. Multiple isomers of isoprostanoids were generated by reacting AdA with a radical initiator, similar to what was observed with F2-IsoPs generated from AA but distinct from the single regiostereoisomer that is formed from the enzyme-catalyzed oxidation of unesterified AdA or AA (36, 37). AdA-derived isoprostanoids shared many structural features with F2-IsoPs: both had similar numbers of isomers, similar CID patterns, two double bonds, a hydrocarbon ring, and three hydroxyl moieties with two in the cis configuration. As with F2-IsoPs and F4-NeuroPs (5), the presence of cis hydroxyl moieties suggests that the AdA-derived isoprostanoids arise by hydrolysis of an endoperoxide located on a cyclopentane ring. Finally, the amount of F2-dihomo-IsoPs generated was proportional to the duration and concentration of the radical initiator. Together, these studies demonstrated that multiple F2-dihomo-IsoP isomers were formed by reacting unesterified AdA with a radical initiator.
Our data suggested that F2-dihomo-IsoPs provide a relatively selective window into oxidative damage to myelin. Similar to what others have published (8, 32), the ratio of esterified AdA to total DHA was 0.4 for gray matter-derived and 4.4 for myelin-derived phospholipids, values that were similar to the initial ratio of esterified F2-dihomo-IsoPs to F4-NeuroPs in these fractions. Moreover, the ratio of esterified F2-dihomo-IsoPs to F4-NeuroPs was 9- to 10-fold greater in myelin phospholipids than in gray matter phospholipids upon oxidation with AAPH for 30 min to 24 h. Our analysis of the phospholipid preparations showed little contamination of myelin protein in the gray matter fraction and little neuronal protein in the myelin fraction. Thus, it is unclear whether the small amounts of F4-NeuroPs detected in myelin-derived phospholipids were generated from DHA esterified to myelin phospholipids or from trace contaminating neuronal elements. In any case, relative to F4-NeuroPs, the F2-dihomo-IsoPs were enriched by ∼1 order of magnitude in oxidized myelin phospholipids.
Although a limited sample, we applied our new tool to the evaluation of white matter damage in patients with AD compared with age-matched controls. Similar to what we observed previously in patients with white matter damage from periventricular leukomalacia (6), white matter from patients with AD had increased F4-NeuroPs, indicating oxidative damage to axons in white matter. However, the addition of F2-dihomo-IsoPs proved insightful, because these also were increased significantly in patients with AD, indicating that oxidative damage also was increased significantly in myelin in white matter from patients with AD. This finding is consistent with previous neuroimaging studies that have suggested that white matter, especially in the frontal lobe, may be targeted by processes of AD (7, 35).
The efficiency of esterified isoprostanoid formation, calculated as the amount of isoprostanoid relative to the amount of parent PUFA, varied with isoprostanoid and phospholipid source. In all phospholipid preparations, the initial rates of isoprostanoid formation were greatest for F2-IsoPs, followed by F2-dihomo-IsoPs, followed by F4-NeuroPs. For all isoprostanoids, the efficiency of formation was highest in gray matter-derived phospholipids, intermediate in myelin-derived phospholipids, and least in white matter-derived phospholipids. Although these results are interesting to consider, there are limitations to extrapolating these results to the in vivo condition, because phospholipids were extracted and purified to remove unesterified fatty acids as well as redox active molecules such as hemoglobin (pro-oxidant) and vitamin E (antioxidant). One possible explanation for the variation in oxidation efficiency with phospholipid source is that gray matter phospholipids had 70% more total PUFA than white matter or myelin phospholipids, perhaps promoting peroxidation by AAPH. However, PUFA levels in myelin- and white matter-derived phospholipids were similar; therefore, this cannot explain the ∼2-fold greater efficiency of isoprostanoid formation in myelin- versus white matter-derived phospholipids. Moreover, the types and levels of plasmalogens in myelin- and white matter-derived phospholipids were similar, and so is an unlikely explanation for differences in the efficiency of isoprostanoid formation. Although the full explanation remains unclear, our data clearly showed that the rank order for the efficiency of isoprostanoid production in human cerebral phospholipids was greatest for F2-IsoPs in gray matter.
Primate brain is unique in that two PUFAs are highly enriched in different membranes in white matter: DHA in axonal membranes and AdA in myelin. In the present study, novel peroxidation products of AdA (F2-dihomo-IsoPs) were identified and contrasted with close homologs derived from AA or DHA. In contrast to DHA-derived F4-NeuroPs, which are established biomarkers for neuronal membrane peroxidation (5), F2-dihomo-IsoPs were enriched in oxidized phospholipids derived from myelin. Moreover, a region of white matter affected by AD showed significant increases in F4-NeuroPs and F2-dihomo-IsoPs, but not F2-IsoPs, compared with age-matched controls. We suggest that the quantification of F2-dihomo-IsoPs and F4-NeuroPs may help to clarify the in vivo contributions of free radical damage to myelin and axons in white matter damage from aging and in multiple disease processes.
Acknowledgments
The authors are grateful to Dr. Bob K. Ernst (Department of Microbiology, University of Washington, Seattle, WA) for allowing us to use his GC-flame ionization detection system so extensively and to Ms. Angela Wilson (Department of Pathology, University of Washington) for performing isoprostanoid measurements on human brain and urine samples.
Abbreviations
AA, arachidonic acid
AAPH, 2,2′-azo-bis(2-methylpropionamidine)dihydrochloride
AD, Alzheimer's disease
AdA, adrenic acid
BSTFA, N,O-bis(trimethylsilyl)trifluoroacetamide
CID, collision-induced dissociation
DHA, docosahexaenoic acid
F2-IsoP, F2-isoprostane
F4-NeuroP, F4-neuroprostane
NICI-GC-MS, negative ion chemical ionization gas chromatography-mass spectrometry
SRM, selective reaction monitoring
Published, JLR Papers in Press, February 5, 2008.
Footnotes
This work was supported by National Institutes of Health Grants AG-24011, AG-05136, AG-23801, DK-48831, CA-77839, GM-15431, ES-13125, and NS-48595 and by the Nancy and Buster Alvord Endowment.
References
- 1.Sastry P. S. 1985. Lipids of nervous tissue: composition and metabolism. Prog. Lipid Res. 24 69–176. [DOI] [PubMed] [Google Scholar]
- 2.Montine T. J., M. D. Neely, J. F. Quinn, M. F. Beal, W. R. Markesbery, L. J. Roberts, and J. D. Morrow. 2002. Lipid peroxidation in aging brain and Alzheimer's disease. Free Radic. Biol. Med. 33 620–626. [DOI] [PubMed] [Google Scholar]
- 3.Montine T. J., K. S. Montine, W. McMahan, W. R. Markesbery, J. F. Quinn, and J. D. Morrow. 2005. F2-isoprostanes in Alzheimer and other neurodegenerative diseases. Antioxid. Redox Signal. 7 269–275. [DOI] [PubMed] [Google Scholar]
- 4.Pratico D. 2002. Alzheimer's disease and oxygen radicals: new insights. Biochem. Pharmacol. 63 563–567. [DOI] [PubMed] [Google Scholar]
- 5.Roberts L. J., 2nd, T. J. Montine, W. R. Markesbery, A. R. Tapper, P. Hardy, S. Chemtob, W. D. Dettbarn, and J. D. Morrow. 1998. Formation of isoprostane-like compounds (neuroprostanes) in vivo from docosahexaenoic acid. J. Biol. Chem. 273 13605–13612. [DOI] [PubMed] [Google Scholar]
- 6.Back S. A., N. L. Luo, R. A. Mallinson, J. P. O'Malley, L. D. Wallen, B. Frei, J. D. Morrow, C. K. Petito, C. T. Roberts, Jr., G. H. Murdoch, et al. 2005. Selective vulnerability of preterm white matter to oxidative damage defined by F2-isoprostanes. Ann. Neurol. 58 108–120. [DOI] [PubMed] [Google Scholar]
- 7.Bartzokis G. 2004. Age-related myelin breakdown: a developmental model of cognitive decline and Alzheimer's disease. Neurobiol. Aging. 25 5–18. [DOI] [PubMed] [Google Scholar]
- 8.Skinner E. R., C. Watt, J. A. Besson, and P. V. Best. 1993. Differences in the fatty acid composition of the grey and white matter of different regions of the brains of patients with Alzheimer's disease and control subjects. Brain. 116 717–725. [DOI] [PubMed] [Google Scholar]
- 9.Han X., D. M. Holtzman, and D. W. McKeel, Jr. 2001. Plasmalogen deficiency in early Alzheimer's disease subjects and in animal models: molecular characterization using electrospray ionization mass spectrometry. J. Neurochem. 77 1168–1180. [DOI] [PubMed] [Google Scholar]
- 10.Nourooz-Zadeh J., B. Halliwell, and E. E. Anggard. 1997. Evidence for the formation of F3-isoprostanes during peroxidation of eicosapentaenoic acid. Biochem. Biophys. Res. Commun. 236 467–472. [DOI] [PubMed] [Google Scholar]
- 11.Milatovic D., M. VanRollins, K. Li, K. S. Montine, and T. J. Montine. 2005. Suppression of murine cerebral F2-isoprostanes and F4-neuroprostanes from excitotoxicity and innate immune response in vivo by alpha- or gamma-tocopherol. J. Chromatogr. B Analyt. Technol. Biomed. Life Sci. 827 88–93. [DOI] [PubMed] [Google Scholar]
- 12.Musiek E. S., J. K. Cha, H. Yin, W. E. Zackert, E. S. Terry, N. A. Porter, T. J. Montine, and J. D. Morrow. 2004. Quantification of F-ring isoprostane-like compounds (F4-neuroprostanes) derived from docosahexaenoic acid in vivo in humans by a stable isotope dilution mass spectrometric assay. J. Chromatogr. B Analyt. Technol. Biomed. Life Sci. 799 95–102. [DOI] [PubMed] [Google Scholar]
- 13.Pace-Asciak C., and L. S. Wolfe. 1971. N-Butylboronate derivatives of the F prostaglandins. Resolution of prostaglandins of the E and F series by gas-liquid chromatography. J. Chromatogr. 56 129–133. [DOI] [PubMed] [Google Scholar]
- 14.Nourooz-Zadeh J., E. H. Liu, B. Yhlen, E. E. Anggard, and B. Halliwell. 1999. F4-isoprostanes as specific markers of docosahexaenoic acid peroxidation in Alzheimer's disease. J. Neurochem. 72 734–740. [DOI] [PubMed] [Google Scholar]
- 15.Norton W. T. 1974. Isolation of myelin from nerve tissue. Methods Enzymol. 31 435–444. [DOI] [PubMed] [Google Scholar]
- 16.The National Institute on Aging and Reagan Institute Working Group on Diagnostic Criteria for the Neuropathological Assessment of Alzheimer's Disease. 1997 Consensus recommendations for the postmortem diagnosis of Alzheimer's disease. Neurobiol. Aging. 18 (Suppl.): S1–2. [PubMed]
- 17.Laemmli U. K. 1970. Cleavage of structural proteins during the assembly of the head of bacteriophage T4. Nature. 227 680–685. [DOI] [PubMed] [Google Scholar]
- 18.Wang Q., R. L. Woltjer, P. J. Cimino, C. Pan, K. S. Montine, J. Zhang, and T. J. Montine. 2005. Proteomic analysis of neurofibrillary tangles in Alzheimer disease identifies GAPDH as a detergent-insoluble paired helical filament tau binding protein. FASEB J. 19 869–871. [DOI] [PubMed] [Google Scholar]
- 19.Moriguchi T., S. Y. Lim, R. Greiner, W. Lefkowitz, J. Loewke, J. Hoshiba, and N. Salem, Jr. 2004. Effects of an n-3-deficient diet on brain, retina, and liver fatty acyl composition in artificially reared rats. J. Lipid Res. 45 1437–1445. [DOI] [PubMed] [Google Scholar]
- 20.Lepage G., and C. C. Roy. 1984. Improved recovery of fatty acid through direct transesterification without prior extraction or purification. J. Lipid Res. 25 1391–1396. [PubMed] [Google Scholar]
- 21.Masood A., K. D. Stark, and N. Salem, Jr. 2005. A simplified and efficient method for the analysis of fatty acid methyl esters suitable for large clinical studies. J. Lipid Res. 46 2299–2305. [DOI] [PubMed] [Google Scholar]
- 22.Ways P., and D. J. Hanahan. 1964. Characterization and quantification of red cell lipids in normal man. J. Lipid Res. 5 318–328. [PubMed] [Google Scholar]
- 23.Christie, W. W. 2003. Lipid Analysis: Isolation, Separation, Identification, and Structural Analysis of Lipids. 3rd edition. Oily Press, Bridgewater, England.
- 24.Rouser, G., G. Kritchevsky, and A. Yamamoto. 1967. Column chromatographic and associated procedures for separation and determination of phosphatides and glycolipids. In Lipid Chromatographic Analysis. G. V. Marinetti, editor. M. Dekker, New York. 99–162.
- 25.Nourooz-Zadeh J., E. H. Liu, E. Anggard, and B. Halliwell. 1998. F4-isoprostanes: a novel class of prostanoids formed during peroxidation of docosahexaenoic acid (DHA). Biochem. Biophys. Res. Commun. 242 338–344. [DOI] [PubMed] [Google Scholar]
- 26.Morrow J. D., K. E. Hill, R. F. Burk, T. M. Nammour, K. F. Badr, and L. J. Roberts, 2nd. 1990. A series of prostaglandin F2-like compounds are produced in vivo in humans by a non-cyclooxygenase, free radical-catalyzed mechanism. Proc. Natl. Acad. Sci. USA. 87 9383–9387. [DOI] [PMC free article] [PubMed] [Google Scholar]
- 27.Yin H., and N. A. Porter. 2005. New insights regarding the autoxidation of polyunsaturated fatty acids. Antioxid. Redox Signal. 7 170–184. [DOI] [PubMed] [Google Scholar]
- 28.Yin H., N. A. Porter, and J. D. Morrow. 2005. Separation and identification of F2-isoprostane regioisomers and diastereomers by novel liquid chromatographic/mass spectrometric methods. J. Chromatogr. B Analyt. Technol. Biomed. Life Sci. 827 157–164. [DOI] [PubMed] [Google Scholar]
- 29.Yin H., J. D. Morrow, and N. A. Porter. 2004. Identification of a novel class of endoperoxides from arachidonate autoxidation. J. Biol. Chem. 279 3766–3776. [DOI] [PubMed] [Google Scholar]
- 30.Morell, P., and R. H. Quarles. 1999. Myelin formation, structure and biochemistry. In Basic Neurochemistry. G. J. Siegel, editor. Lippincott, Williams & Wilkins, Philadelphia, PA. 69–94.
- 31.Lepage G., and C. C. Roy. 1986. Direct transesterification of all classes of lipids in a one-step reaction. J. Lipid Res. 27 114–120. [PubMed] [Google Scholar]
- 32.Svennerholm L. 1968. Distribution and fatty acid composition of phosphoglycerides in normal human brain. J. Lipid Res. 9 570–579. [PubMed] [Google Scholar]
- 33.Yanagihara T., and J. N. Cumings. 1969. Alterations of phospholipids, particularly plasmalogens, in the demyelination of multiple sclerosis as compared with that of cerebral oedema. Brain. 92 59–70. [DOI] [PubMed] [Google Scholar]
- 34.Horrocks, L. A. 1972. Content, composition, and metabolism of mammalian and avian lipid that contain ether groups. In Ether Lipids. F. Snyder, editor. Academic Press, New York. 177–272.
- 35.Stahl R., O. Dietrich, S. J. Teipel, H. Hampel, M. F. Reiser, and S. O. Schoenberg. 2007. White matter damage in Alzheimer disease and mild cognitive impairment: assessment with diffusion-tensor MR imaging and parallel imaging techniques. Radiology. 243 483–492. [DOI] [PubMed] [Google Scholar]
- 36.Sprecher H., M. VanRollins, F. Sun, A. Wyche, and P. Needleman. 1982. Dihomo-prostaglandins and -thromboxane. A prostaglandin family from adrenic acid that may be preferentially synthesized in the kidney. J. Biol. Chem. 257 3912–3918. [PubMed] [Google Scholar]
- 37.VanRollins M., L. Horrocks, and H. Sprecher. 1985. Metabolism of 7,10,13,16-docosatetraenoic acid to dihomo-thromboxane, 14-hydroxy-7,10,12-nonadecatrienoic acid and hydroxy fatty acids by human platelets. Biochim. Biophys. Acta. 833 272–280. [DOI] [PubMed] [Google Scholar]


