

Abstract
Grb2-associated binder 1 (GAB1) is a scaffold protein involved in numerous interactions that propagate signaling by growth factor and cytokine receptors. Here we explore in silico and validate in vivo the role of GAB1 in the control of mitogenic (Ras/MAPK) and survival (PI3K/Akt) signaling stimulated by epidermal growth factor (EGF). We built a comprehensive mechanistic model that allows for reliable predictions of temporal patterns of cellular responses to EGF under diverse perturbations, including different EGF doses, GAB1 suppression, expression of mutant proteins and pharmacological inhibitors. We show that the temporal dynamics of GAB1 tyrosine phosphorylation is significantly controlled by positive GAB1-PI3K feedback and negative MAPK-GAB1 feedback. Our experimental and computational results demonstrate that the essential function of GAB1 is to enhance PI3K/Akt activation and extend the duration of Ras/MAPK signaling. By amplifying positive interactions between survival and mitogenic pathways, GAB1 plays the critical role in cell proliferation and tumorigenesis.
Signaling through the epidermal growth factor (EGF1) receptor (EGFR) is crucial for many cellular processes, including growth, cell cycle progression, differentiation, and apoptosis (1,2). Stimulation by growth factors of the EGF family causes dimerization of EGFR monomers and activates their intrinsic tyrosine kinase activity. Subsequent transphosphorylation of multiple tyrosine residues on the cytoplasmic tail of EGFR conveys a biochemical message to various adaptor proteins and enzymes with specific phosphotyrosine binding domains. EGFR-mediated phosphorylation and activation of multiple binding partners initiates signal propagation through a number of interacting branches including the mitogen activated protein kinase (MAPK) cascade and the phosphatidylinositol 3-kinase (PI3K)/Akt survival pathway (Fig. 1).
Fig. 1. Flow chart representation of the EGFR-Gab1-Erk/Akt network.
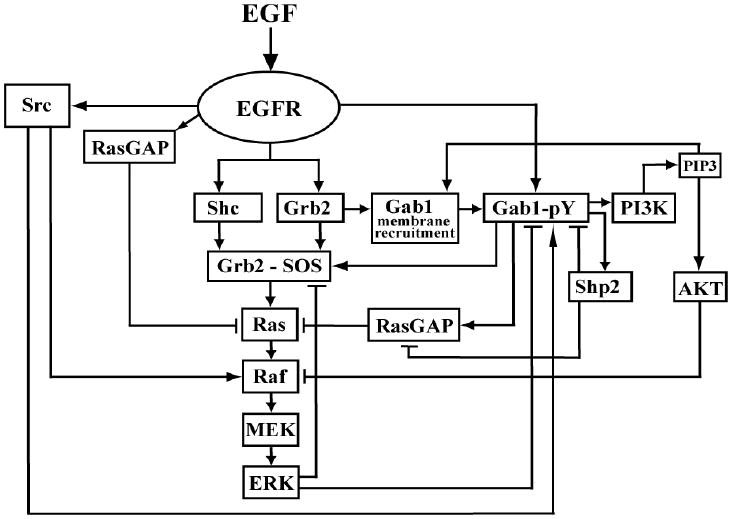
The reaction stoichiometry and kinetic constants of the EGFR network model are given in Supplementary Tables S1-S3.
The adaptor proteins Grb2 (growth factor receptor binding protein 2) and Shc (src homology and collagen domain protein) play key roles in signaling downstream of EGFR. Grb2 associates with activated EGFR either directly or through tyrosyl-phosphorylated Shc (3). This association is mediated by the SH2 (src homology 2) domain of Grb2 that binds to specific phosphotyrosine residues on EGFR or Shc. Simultaneously, through its N-terminal SH3-domain, Grb2 associates with the cytoplasmic guanine nucleotide exchange factor (GEF) SOS (homolog of the Drosophila melanogaster Son of sevenless) (4,5). EGF-induced recruitment of the SOS-Grb2 complex to the plasma membrane is critical for the initiation of the MAPK/ERK pathway (Raf/MEK/ERK cascade) (6-8). SOS catalyzes the transformation of an inactive GDP-bound form (Ras-GDP) of the small membrane-anchored GTP-ase Ras into its active GTP-bound form (Ras-GTP). Subjected to multiple controls, Ras acts as a gatekeeper of the MAPK/ERK cascade and a critical switch that responds to a number of signals that determine the cell’s fate (9-11). Signaling of activated Ras is turned off by the activation of GTPase activating protein (RasGAP/p120-GAP), which stimulates GTP hydrolysis by Ras (12). Inhibitory feedback phosphorylation of SOS by ERK provides an additional mechanism for the inhibition of Ras signaling (13-15).
EGF-induced membrane recruitment of the SOS-Grb2 complex can be mediated not only by EGFR, but also involves the Grb2-associated binder (GAB) adaptor proteins (3,16). The GAB proteins are also critical components of a major route of PI3K activation by EGFR and are involved in the recruitment of the p85 regulatory subunit of PI3K to the plasma membrane (17-19). All members of GAB family contain the N-terminal pleckstrin homology (PH) domain that mediates membrane targeting, several proline-rich motifs serving as binding sites for SH3-domain containing proteins, such as Grb2 and the soluble tyrosine kinase Src, and multiple tyrosine phosphorylation sites that recruit a variety of effectors, including PI3K, RasGAP, and protein tyrosine phosphatase SHP2, (20-22). The relative abundance of GAB1/2/3 isoforms varies in different cell types (23). Here we use HEK293 cells and focus on the functional role of GAB1 in EGF-induced signaling.
The association of GAB1 with EGFR is thought to occur predominantly via Grb2 (19), resulting in tyrosine phosphorylation of GAB1 on several sites which bind SH2 domains of p85, RasGAP, and SHP2. GAB1-mediated recruitment of p85 results in PI3K activation and the production of phosphatidylinositol (3,4,5)-triphosphate (PIP3) in the plasma membrane. This GAB1 - PI3K interaction generates positive feedback in PI3K stimulation (Fig. 1): the PH domain of GAB1 binds PIP3 and this leads to a further recruitment of GAB1 to the membrane, which further activates PI3K (18,24). In addition, the plasma membrane recruitment of GAB1 influences the Ras/MAPK pathway in multiple ways (Fig. 1). GAB1 can bind Grb2-SOS complex, which activates Ras and tyrosyl-phosphorylated GAB1 can bind RasGAP, which negatively regulates Ras. Intriguingly, protein phosphatase SHP2 that binds to GAB1 was reported to be a positive regulator of the MAPK pathway (20,22,25-28). This positive effect is related to the formation of the GAB1-SHP2 complexes and subsequent dephosphorylation of the docking sites on GAB1 involved in RasGAP binding (28), which results in an elevation of active Ras-GTP.
GAB1−/− mice die early in the embryonic development due to a combined effect of loss-of-function mutations in multiple RTK pathways (22,29). Some of these effects can be explained by the essential function of GAB1 in activation of the PI3K/Akt survival pathway and by the findings that cells from GAB1−/− mice or with GAB1 mutants lacking SHP2 binding sites showed impaired MAPK/ERK activation (19,20,26,30,31). However, reports on the significance of GAB1 and PI3K for MAPK activation have been controversial. The expression of the constitutively active catalytic subunit p110α of PI3K stimulated the MAPK pathway in some cells, but not in the others (32). Likewise, treatment with the PI3K inhibitors wortmannin and LY294002 led to inhibition of Ras and ERK activation in the nontransformed Vero cells (25), but had no effect on ERK-PP in opossum kidney cells (33), bovine tracheal myocytes (34) and rat hepatocytes (data from this laboratory, not shown), and even increased ERK activation in the ErbB4 expressing CHO cells; the latter was attributed to inhibitory phosphorylation of Raf1 by Akt, the downstream target of PI3K (35). Thus, although many mechanisms of the GAB involvement in PI3K – MAPK crosstalk are understood at the molecular level, their physiological control within the overwhelmingly complex network of protein and protein-lipid interactions remains elusive. Systems Biology approaches may help link both well-known and conjectured molecular mechanisms to physiological responses of complex cellular networks through quantitative, predictive and testable mathematical models.
In the present paper, we combined experimental analysis of EGF-induced signaling with the development of a comprehensive computational model of the EGFR network. Our goal is to unlock the functional role of the scaffold adaptor protein GAB1 in the activation of the Ras/MAPK and PI3K/Akt pathways and in the interactions between these pathways. This combined experimental and computational modeling approach enabled us to assess how GAB1 modulates multiple feedforward and feedback regulatory mechanisms that control the MAPK temporal dynamics and couple EGF-induced Ras/MAPK and PI3K/Akt signaling. The model described similarities and differences in the changes of the Ras/MAPK dynamics after GAB1 suppression or PI3K inhibition, and these predictions were verified experimentally. The model predicts that the relative abundance of EGFR, GAB, and SHP2 is a critical controlling factor in the PI3K and MAPK pathway interactions. Our findings support the view that GAB1 serves as an additional signaling platform initiating the Ras/MAPK pathway. This GAB1 role is especially important at low EGF and/or EGFR levels. Our results have important ramifications for the identification of therapeutics targets in the PI3K/Akt survival and MAPK proliferation pathways.
MATERIALS AND METHODS
Reagents and commercial antibodies
All routine reagents were obtained from Sigma (St Louis, MO) unless otherwise noted. The following primary monoclonal and polyclonal antibodies were used: anti-EGF receptor, anti-Akt1/PKBα PH Domain, anti-α-tubulin (clone DM1A) (both from Upstate Biotechnology, Lake Placid, NY), anti-phospho-Akt (Ser473), anti-ERK, anti-phospho-ERK (Thr202/Tyr204), anti-MEK1/2, anti-phospho-MEK1/2 (Ser217/221), anti-SHP2 (all from Cell Signalling, Beverley, MA), anti-phospho-EGF receptor (Tyr1173) (BioSource, Camarillo, CA), anti-Gab1 (H-198), anti-phospho-Gab1 (Tyr627), anti-Grb2 (C-23) (all from Santa Cruz Biotechnology, Santa Cruz, CA), anti-Ras (BD Transduction Laboratories, San Diego, CA) and anti-Glyceraldehyde-3-Phosphate Dehydrogenase (GAPDH) (clone 6C5) (CHEMICON, Temecula, CA). Secondary horse anti-mouse HRP-linked IgG antibodies were purchased from Cell Signalling (Beverley, MA), Peroxidase Conjugated ImmunoPure Goat Anti-Rabbit IgG (H+L), and Rabbit Anti-Sheep IgG (H+L), (both from Pierce Biotechnology, Rockford, IL).
Cell culture and transfection
Human embryonic kidney Hek293 and epidermoid carcinoma A431 cell lines obtained from ATCC (Manassas, VA) were cultured in DMEM/F-12 medium supplemented with 10% fetal bovine serum (FBS) (both from Gibco, Grand Island, NY) and penicillin-streptomycin solution (100 μg/ml each) (Fisher Scientific, Pittsburgh, PA) in a humidified 5% CO2 incubator at 37°C. Cells were split 1:3 every 3 days to maintain subconfluency.
One hour or less before transfection adherent cells were trypsinized and resuspended in antibiotics-free serum-reduced OPTI-MEM I medium (Gibco, Grand Island, NY) 2 × 10⁵ cells/ml. The cells were set aside in the incubator at 37°C while a master mix of transfection complexes was prepared according to the manufacturer’s instructions, with 6.25 μl of 20 μM stock siRNA and 7 μl siPORT NeoFX transfection reagent (Ambion, Austin, TX) in OPTI-MEM I medium per well. 200 μl of newly formed transfection complexes were dispensed into empty wells of 6-well culture plates (Nunc™, Denmark) and subsequently gently mixed with 2.3 ml cell overlay volume giving a final concentration of 50 nM Gab1 siGENOME SMARTpool siRNA (Dharmacon, Lafayette, CO). Control cells were transfected with siCONTROL Non-Targeting siRNA Pool (Dharmacon, Lafayette, CO) or left untreated. Control and transfected cells were incubated in normal cell culture conditions for 12-24 hours before 1 ml of complete medium with antibiotics was added into each well. 48 hours after transfection, old medium was removed by suction, adhered cells were washed with phosphate buffered saline (PBS) and 2.5 ml of fresh complete medium was poured into each well. 60 hours after transfection the complete medium was replaced with 2.5 ml of FBS-free medium and cells were starved for 12 hours. The phenotypic and functional efficiency of RNAi-based knockdown of Gab1 protein expression was measured at protein level by Western blotting analysis. Routinely 70-85% of Gab1 protein depletion was achieved.
Cell stimulation, treatment with inhibitors and protein extraction
72 hours after from transfection with siRNA and 12 hours serum-starvation, cells were stimulated with 20 nM EGF for the indicated time periods. 30 min before stimulation cells were additionally incubated with 200 nM PI3-kinase inhibitor wortmannin (Cell Signaling, Beverley, MA), 5 μM MEK inhibitor U0126 and 5 μM ERK inhibitor 5-Iodotubericidin (both from Calbiochem, La Jolla, CA) as indicated. Cells were scraped in 700 μl per well ice-cold lysis buffer (150 mM NaCl, 2.5 mM EGTA (pH 7.4), 25 mM Hepes (pH 7.4), 5% glycerol, 1% Igepal CA-630, 10 μl/ml Phosphatase Inhibitor Cocktail Set II (Calbiochem, San Diego, CA) and one Complete protease inhibitor cocktail tablet per 10 ml (Roche Diagnostics, Indianapolis, IN)).
Alternatively, in experiments without siRNA transfection, Hek293 or A431 cells were seeded in 6-well plates at a concentration of 3 × 10⁵ cells per well incubated for 24 hours and starved 12 hours before treatment with inhibitor(s) and stimulation with a ligand.
Cells were collected in tubes, vigorously vortexed for 10 seconds and solubilized for 30 min on ice. Detergent-insoluble material was removed by centrifugation at 10,000 × g for 10 min at 4°C. Protein concentrations were determined using the bicinchoninic acid solution (Pierce Biotechnology, Rockford, IL). Proteins from each total cell lysate were immediately dissolved in 5× Laemmli buffer (BIO-RAD Laboratories, Hercules, CA) with 5% β-mercaptoethanol and boiled for 5 min at 95°C.
Immunoprecipitation and immunoblotting
300 μg of each total cell lysate was incubated with the indicated antibody (2-5 μg) while rocking for 2 hours at room temperature and then incubated with 30 μl of protein-A-Sepharose 4B beads (Sigma, St Louis, MO) overnight at 4°C. Tyrosine-phosphorylated proteins from total cell lysates were collected with 20 μl of monoclonal anti-phosphotyrosine agarose beads (clone PT-66) (Sigma, St Louis, MO) overnight at 4°C. The beads were washed with PBS three times, proteins eluted in 2× Laemmli buffer (BIO-RAD Laboratories, Hercules, CA), boiled for 5 min at 95°C and spun-down.
The resulting immunoprecipitates or proteins from total cell lysates were then subjected to SDS-PAGE using Novex 8% Tris-Glycine (Invitrogen, Carlsbad, CA) or NuPAGE 4-12% Bis-Tris (Invitrogen, Carlsbad, CA) gels. Gel areas with separated phosphorylated proteins of interest and house-keeping proteins were manually cut based on their molecular weight, combined, and transferred onto the same nitrocellulose membrane (BIO-RAD Laboratories, Hercules, CA) in order to avoid transfer-based variability. The membrane was rinsed with distilled water, blocked with 3% bovine serum albumin in TBST (5 mM Tris HCl (pH 8.0), 138 mM NaCl, 26.8 mM KCl, 0.05% Tween-20) for 2 hours at room temperature, and then probed with indicated primary antibodies overnight at 4°C. Antibodies against housekeeping proteins (GAPDH or Grb2) were used to normalize the sample loading. Additionally each membrane with visualized phosphorylated proteins was stripped with Restore Western blot stripping buffer (Pierce Biotechnology, Rockford, IL) for 12 minutes at room temperature, washed in TBST for 8 min, blocked and probed with an antibody against the relevant total protein as described above.
The membranes were washed extensively with TBST, followed by incubation with respective secondary antibodies for 1 hour at room temperature. After final washing with TBST for 45 minutes the bands were visualized by KODAK Image Station 440CF (Kodak Scientific Imaging Systems, New Haven, CT) using enhanced chemiluninescence detection with SuperSignal West Dura Extended Duration substrate (Pierce Biotechnology, Rockford, IL). Densitometric analysis was performed using KODAK Digital Science software.
Ras Assay
For Ras-GTP measurement, 300 μg of each supernatant was incubated with 20 μl of Raf-1 Ras binding domains bound to gluthatione-agarose beads (Ras Assay Reagent was from Upstate Biotechnology, Lake Placid, NY) overnight on rocking platform at 4°C. Protein complexes were collected by brief centrifugation and washed three times with ice-cold lysis buffer. Ras-GTP was released from agarose beads by adding 2× Laemmli buffer and boiling for 5 min at 95°C. 20 μg of the sample was separated by SDS-PAGE using Novex 14% Tris-Glycine gels (Invitrogen, Carlsbad, CA) and subjected to immunoblotting assay as described above.
COMPUTATIONAL MODELING ANALYSIS OF THE EGFR SIGNALING NETWORK
Fig. 1 presents a flow chart of signaling branches analyzed in a computational model of the EGFR network. We previously developed and validated in silico models of some parts of this network (11,36-39). The initial part of the EGFR network includes activation and subsequent tyrosine phosphorylation and dephosphorylation of EGFR. It also incorporates interactions of phosphorylated EGFR with its immediate adaptor and target proteins (including Shc, Grb2, RasGAP, Src, phospholipase C-γ (PLCγ), and p85) and the generation of the Ras-activating and deactivating signals via two canonical branches, which involve the formation of the EGFR-Grb2-SOS/EGFR-Shc-Grb2-SOS and EGFR-RasGAP complexes, respectively (a detailed kinetic description of this signaling module is given in Supplementary Table S1). Ranges of kinetic parameters were constrained based on the literature data and in vivo measurements of the signaling kinetics. A number of model predictions were validated (11,36,38,40), and, in addition, our kinetic description of this pathway was tested and used by other groups (35,41,42).
The processes of EGFR internalization, degradation and de novo synthesis are listed in Supplementary Table S1. The incorporation of multiple signaling branches initiated by the scaffold GAB1 (Supplementary Table S2) extends our previous models (11,36,38) and brings about additional regulatory interactions critical for the function of the EGFR network. A distinctive feature of this refined and extended model is the employment of a novel, domain-oriented approach that greatly facilitates the analysis of signaling networks involving scaffold proteins (43,44). In the model, scaffolds are GAB1, which has six binding sites and Grb2, which possesses three binding domains. Owing to their multiple domains, scaffolds generate a great variety of heterogeneous multi-protein complexes, each involved in multiple parallel reactions. For instance, some GAB1 forms reside in the cytoplasm, whereas others are recruited to the plasma membrane through binding of the PH domain of GAB1 to PIP3 or the GAB1 proline-rich region to the C-terminal SH3 domain of Grb2 associated with phosphorylated EGFR (16,19). Subsequent phosphorylation of GAB1 at numerous tyrosine residues creates docking sites for PI3K (45), SHP2 (45), RasGAP (28), and an additional site for Grb2, which binds via its SH2 domain (46,47). Each of these GAB1 docking sites is either dephosphorylated, phosphorylated and free, or phosphorylated and occupied by a partner protein. The binding partner, in turn, can be phosphorylated or dephosphorylated, or associated with various proteins. All these possibilities multiply, leading to a combinatorial explosion of different forms of both the membrane-recruited and cytoplasmic GAB1 and the number of differential equations describing their transformations (48,49). Likewise Grb2 can form a multitude of distinct complexes with GAB1, SOS, tyrosyl phosphorylated Shc and EGFR. The EGFR signaling network (Fig. 1) could generate tens of thousands of different chemical species that contain GAB1 and/or Grb2, all of which would have to be accounted for in a mechanistic model that describes all “micro-states” of the network. In striking contrast, modeling of this network using a domain-oriented approach (43,44) can significantly reduce the number of “macro”-variables required to describe all interactions in which GAB1 and Grb2 are involved (Supplementary Table S2). However, only an approximate macro-description is feasible for this network (43,44). Estimates of errors incurred demonstrate that their values do not exceed 2% (Supplementary Material).
The kinetics of GDP/GTP exchange and GTP hydrolysis in the Ras circuit is modeled as described previously (11) (Supplementary Table S1). A novel feature of the present model is that the Ras-activating (SOS) and deactivating (RasGAP) signals are carried out not only by EGFR, but also by the membrane-recruited GAB1. Importantly, the Grb2-SOS complexes can associate with both unphosphorylated GAB1 (via the Grb2 C-terminal SH3 domain and the GAB1 proline-rich region) and phosphorylated GAB1 (via the Grb2 SH2 domain and a docking site formed by specific phosphotyrosine residue on GAB1), whereas RasGAP binds only to tyrosyl-phosphorylated GAB1 (28).
Additional extensions to our previous model of the EGFR pathway are a detailed kinetic description of the MAPK cascade, which comprises Raf, MEK and ERK phosphorylation cycles, and activation of Akt by protein kinase PDK1 recruited to the plasma membrane by PIP3 (24,50) (Supplementary Table S3). Active Ras-GTP recruits the serine/threonine kinase Raf to the plasma membrane (51), initiating activation of the MAPK/ERK cascade. At the membrane, Raf is phosphorylated on serine and tyrosine residues by constitutively active and EGF-induced kinases, including Src (52,53). In the present model, Src-mediated phosphorylation of Raf is the second activating cue that follows the Ras-GTP signal and controls Raf activity. For full activation, both MEK and ERK require dual phosphorylation of the activation loop. Raf activates MEK by phosphorylation of two serine residues (54), and MEK activates ERK by phosphorylation of threonine and tyrosine residues (55,56). Activation is reversed by various phosphatases, including dual specificity phosphatases, such as the MAP kinase phosphatases (MKP), serine/threonine phosphatases and tyrosine phosphatases (57-59). It was reported that both dual phosphorylation and dephosphorylation of MEK and ERK occur through distributive, two-collision mechanisms (54,59-61). We used these data in the derivation of kinetic equations of the MAPK cascade (37,39,62).
Role of spatial localization in GAB1-mediated signaling
EGFR activation triggers the recruitment of cytoplasmic adaptor proteins and enzymes to the plasma membrane. In contrast to earlier suggestions that the role of this recruitment is to increase diffusion-limited (first-encounter) rates, the function of targeting cytoplasmic proteins to the membrane was recently shown to amplify the number of complexes formed between signalling partners (7,8). This increase is brought about by the concentration of interacting partners in a thin layer adjacent to the plasma membrane with a much smaller volume than the cytoplasmic volume. For a spherical cell of radius of 10 μm and the layer of 10-15 nm adjacent to the plasma membrane, the ratio of the cytosolic volume (Vcyt) to the near-membrane layer volume (Vmemb) equals about 250-300. In the model, the spatial localization effects are accounted for as follows; for all interactions that occur within the membrane layer (Vmemb), the values of the equilibrium association constants assumed for the cytoplasmic interactions (for instance, reported for in vitro experiments with solubilized proteins) are scaled by a factor Vcyt/Vmemb (11).
Complex feedback circuitry of the EGFR network
It is instructive to summarize the numerous feedback/crosstalk regulations incorporated in our model of the EGFR network. Positive feedback arises from the PIP3-mediated membrane recruitment of GAB1, resulting in further activation of PI3K that produces PIP3 (18,24). Through PIP3-induced GAB1 recruitment, PI3K also influences GAB1 signaling to the Ras/MAPK pathway. This involves temporal and spatial modulation of GEF and GAP signals by Grb2-SOS and RasGAP interactions with PIP3-GAB1. In addition, SHP2 engaged by phosphorylated GAB1 negatively regulates RasGAP signaling and, thus, facilitates Ras activation. Inhibitory phosphorylation of Raf by Akt (63,64) is taken into consideration as another reaction responsible for crosstalk between the PI3K/Akt and Ras/MAPK pathways. The MAPK cascade module is embedded in two negative feedback loops. First, activated ERK phosphorylates SOS leading to the disassembly of the Grb2-SOS complexes and switching off the catalytic process of Ras activation (13-15). The second negative feedback arises from inhibitory phosphorylation of GAB1 by ERK (65-68).
The complex temporal dynamics resulting from these numerous interactions is difficult to assess by merely qualitative arguments. Using an in silico model and testing its predictions against the experiments that exploit specific perturbations to the EGFR network, we provide insights into the intricate relationships between EGF stimulation and downstream responses.
RESULTS
PI3K inhibition reduces ERK activation owing to a disruption of PI3K-GAB1 positive feedback
PI3K inhibition suppresses Ras/ERK signaling
In order to explore potential crosstalk between the PI3K/Akt and Ras/ERK pathways in Hek293 cells, we first analyzed the temporal dynamics of EGFR and ERK activation by EGF in the presence or absence of the PI3K inhibitor wortmannin (Fig. 2). At saturating EGF concentrations (20 nM), wortmannin (200 nM) completely inhibited phosphorylation of the downstream PI3K target Akt (Fig. 2A) and significantly inhibited activation of ERK, as shown in Fig. 2B for dually, threonine/tyrosine phosphorylated ERK. In contrast, wortmannin had almost no effect on EGFR activation, as shown in Fig. 2C for tyrosine phosphorylation of Tyr1173. Likewise, the phosphorylation levels of the other EGFR sites, including Tyr992, required for RasGAP binding, Tyr1148 for Shc binding, and Tyr1068, known as the major binding site for Grb2, were not affected by wortmannin (data not shown). The EGF dose dependence showed that substantial ERK activation occurred at EGF concentrations as low as 0.05 nM. At such low EGF levels, wortmannin also strongly suppressed ERK phosphorylation, which occurred after a lag phase (Fig. 2D). The data obtained at both saturating and low EGF levels show that crosstalk between the PI3K and MAPK pathways occurs downstream of the EGF receptor. In concert with ERK inhibition, the presence of wortmannin substantially decreases active RasGTP fraction throughout the entire measured reaction period, up to 30 min following EGF activation (Fig. 2E). The wortmannin-induced impairment of Ras activation suggests that significant interactions between the PI3K and MAPK pathways occur upstream or at the level of the Ras cycle, but downstream of EGFR (as shown above). Interestingly, our data imply that reported inhibitory phosphorylation of Raf by Akt (63,64) cannot be the only or major mechanism of crosstalk between the PI3K/Akt and Ras/Raf/MEK/ERK pathways in Hek293 cells. In fact, strong inhibition of Raf by Akt would have resulted in activation, rather than inhibition of ERK following PI3K/Akt inhibition by wortmannin.
Fig. 2. Time-course of Akt, ERK, Ras and EGFR activation by EGF in Hek293 cells treated with the PI3K inhibitor wortmannin.
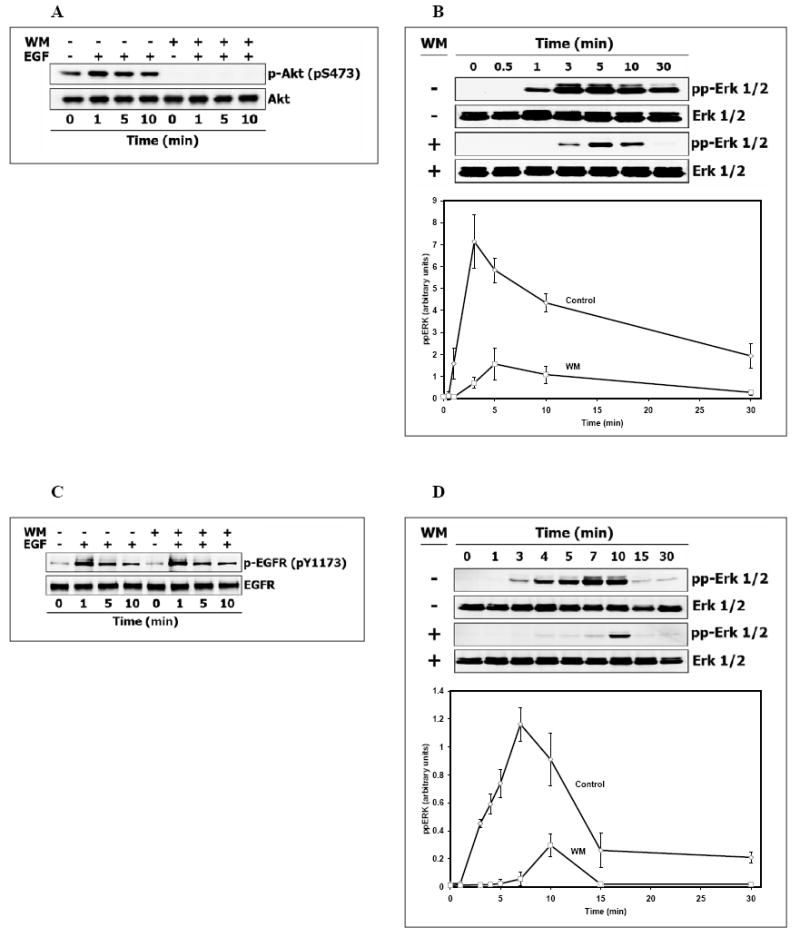
After preincubation at 37° C for 30 min in the presence or absence 200 nM wortmannin (WM), Hek293 cells were stimulated with 20 nM (A, B, C, E) or 0.05 nM EGF (D). Whole-cell lysates were prepared at the indicated times and analyzed by immunoblotting for (A) serine-phosphorylated Akt (S473), (B, D) threonine/tyrosine-phosphorylated Erk (T202/Y204), or (C) tyrosine-phosphorylated EGFR (Y1173). Membrane was stripped, reprobed for total level of each indicated protein and used as a loading control and for quantitation of phosphorylated Erk (plots B, and D) in the presence (□) or absence of WM (◊) (expressed in arbitrary units as a fraction of the total Erk). Data shown (plots B, and D) are the mean ± SEM from three independent experiments. (E). RasGTP was measured by affinity precipitation with Raf-1 Ras binding domain agarose beads and detected with anti-Ras antibody. Anti-Ras antibodies were also used to determine total Ras level in appropriate lysates (Materials and Methods).
Inhibition of the MAPK pathway increases EGF-induced Akt activity and sustains GAB1 phosphorylation
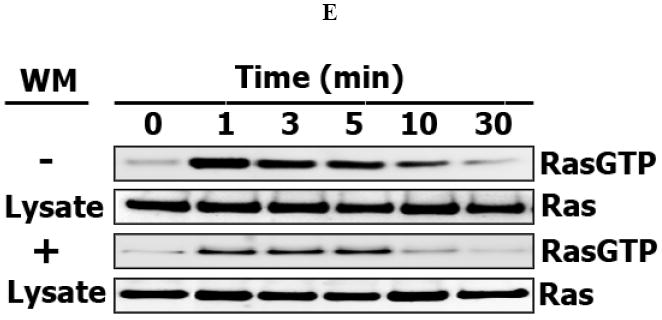
The specific inhibitor of MEK, U0126, and the specific inhibitor of ERK 2, 5-iodotubericidine, each increased the Akt phosphorylation (Fig.3A). These data show that, in contrast with the negative effect of PI3K inhibition on the MAPK pathway, inhibition of the MAPK cascade at the level of MEK or ERK facilitates activation of Akt, the downstream target of PI3K. We also found that GAB1 tyrosine phosphorylation is increased when MEK is inhibited, which confirms that negative feedback from ERK to GAB1 operates in Hek293 cells (Fig.3B) (66). In order to understand the mechanisms underlying crosstalk between the PI3K/Akt and MAPK pathways, we further explored effects of wortmannin-induced PI3K inhibition on GAB1 and SHP2 and employed a computer model of these pathways to analyze and verify the proposed mechanisms.
Fig. 3. Effect of MAPK pathway inhibition on Gab1 phosphorylation and Akt activation in EGF-stimulated Hek293 cells.
Hek293 cells were pretreated with MEK inhibitor U0126 (5 μM) or with ERK inhibitor 5-Iodotubericidin (IT-5) (5 μM) for 30 minutes, stimulated with 20 nM EGF. (A) Basal and EGF-induced serine-phosphorylation of Akt (S473) was detected in whole-cell lysates pretreated with indicated inhibitors for 5 minutes (upper panel) or with IT-5 inhibitor (lower panel). (B) Gab1 was detected in phosphotyrosine protein immunoprecipitates.
PI3K inhibition reduces GAB1 tyrosine phosphorylation and SHP2 recruitment
Although EGFR phosphorylation is not affected by wortmannin, the level of GAB1 tyrosine phosphorylation decreases dramatically (Fig.4A). At first glance, this decrease may seem counterintuitive. Since ERK is inhibited by wortmannin, ERK inhibition should reduce the effect of negative feedback from ERK on GAB1 (65,66,68) and increase (rather than decrease) GAB1 phosphorylation by EGFR and Src (Fig.3B). However, in silico examination (Fig.4B) demonstrates that the major role in the amplification of GAB1 tyrosine phosphorylation is played by the PI3K-GAB1 positive feedback loop. In fact, owing to the membrane localization effect (7,8), the PIP3-GAB1 complex interacts with Grb2 bound to EGFR with much higher affinity than cytoplasmic GAB1 does. This leads to an increase in GAB1 tyrosine phosphorylation by EGFR, and, consequently, in the GAB1-mediated PI3K recruitment to the membrane. The resulting additional production of PIP3 and the recruitment of GAB-1 complete this positive feedback loop and further increase GAB1 phosphorylation. This analysis implies that wortmannin disruption of the PI3K-GAB1 positive loop reduces GAB1 tyrosine phosphorylation (Fig. 4A). A decrease in the GAB1 phosphorylation level attenuates binding of GAB1 partners, including phosphatase SHP2 that can dephosphorylate RasGAP docking sites on GAB1 (Figs. 4C and 4D). Thus, the model establishes the key function of PI3K-GAB1 positive feedback in GAB1 tyrosine phosphorylation and PIP3 production and thereby provides an explanation for our experimental data (Figs. 3A and 3B) that the disruption of negative feedback from ERK to GAB1 by MEK or ERK inhibitors increases and prolongs phosphorylation of the GAB1 and Akt (Supplementary Figs. S1A and S1B).
Fig. 4. PI3K inhibitor wortmannin impairs tyrosine phosphorylation of Gab1 and attenuates binding of Gab1 partner SHP2 in Hek293 cells.
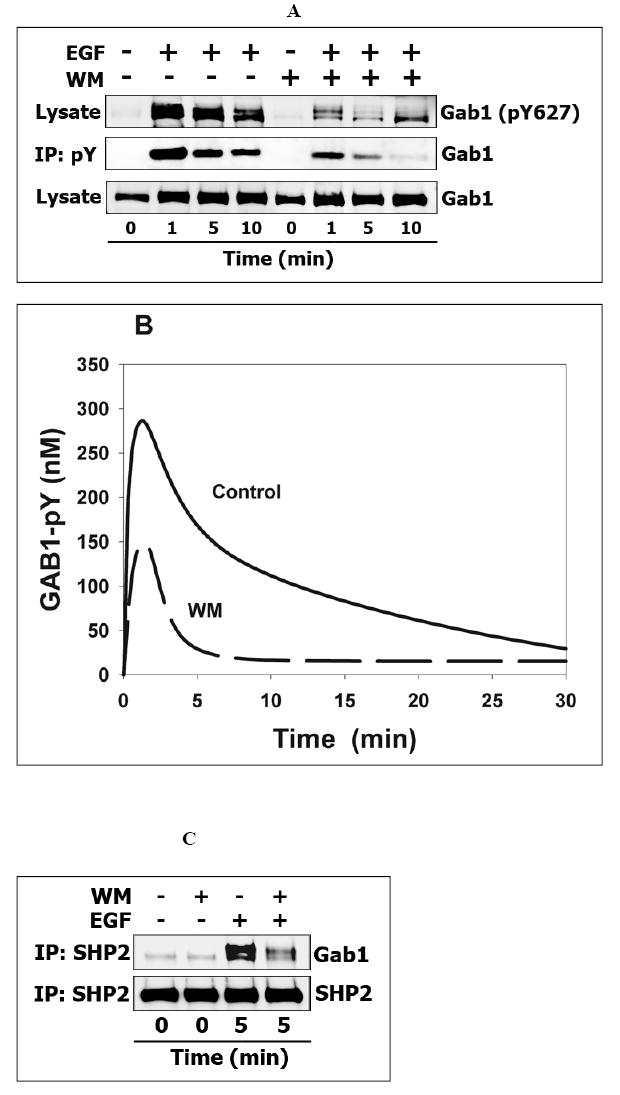
(A) The time-course of Gab1 tyrosine phosphorylation in response to 20 nM EGF in the presence or absence of wortmannin (WM) (200 nM). Cell lysates were prepared at the indicated times as mentioned above and analyzed by immunoblotting for phosphorylation of SHP2 binding site on Gab1 (Y627) (top line) and total Gab1 level (bottom line). All tyrosine phosphorylated proteins were immunoprecipitated from whole-cell lysates (see Materials and Methods) and immunoblotted with anti-Gab1 antibodies (middle line). (B) Computer simulations of the time-course of Gab1 tyrosine phosphorylation in the presence (dashed line) or absence of WM (in the presence of WM, the PI3K catalytic constant is assumed equal to zero). (C) WM induces partial SHP2 dissociation from Gab1 as revealed in SHP2 immunoprecipitates from WM-treated cells probed with anti-Gab1 antibodies. (D) Computer-simulated kinetics of the SHP2-GAB1 association in the presence (dashed line) or absence of WM.
Wortmannin affects the GEF and GAP signals by reducing GAB1 membrane targeting: insight from computational modeling
The time course of GAB phosphorylation has important ramifications for the temporal dynamics of the GEF and GAP signals that control Ras activation. These two opposing signals are generated by the plasma membrane recruitment of the Grb2-SOS complex and RasGAP, respectively, and are mediated by both EGFR and GAB1. The Grb2-SOS complex can associate with the membrane-bound GAB1-PIP3 via the Grb2 C-terminal SH3 domain and the GAB1 proline-rich domain, whereas binding of RasGAP is mediated by specific phosphotyrosines pTyr307/pTyr317 located within GAB1 central region (28). Phosphorylation of Tyr627 and Tyr659 on GAB1 is required for SHP2 binding to the GAB1-PIP3 complex (45). The phosphatase SHP2 can dephosphorylate the RasGAP docking sites on GAB1, decreasing the GAP signal associated with GAB1.
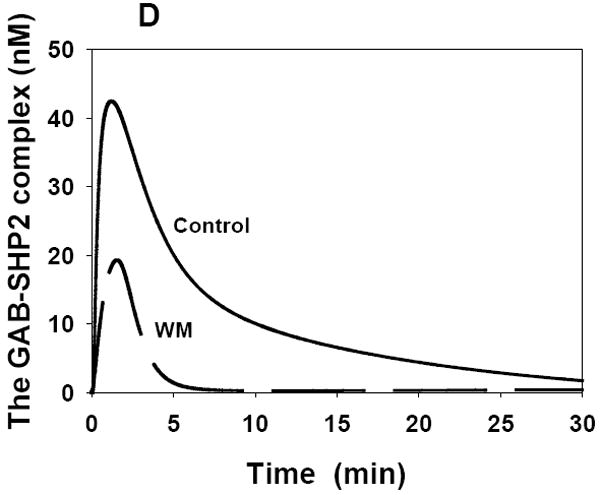
Computational analysis shows the salient differences in the temporal dynamics of the SOS and RasGAP signals. Upon the onset of EGF stimulation, the SOS signal that activates Ras rises more expeditiously than the deactivating RasGAP signal (Figs. 5A and 5B). This modest delay in the GAP signal compared with the GEF signal is brought about by the difference in the on rates of binding to GAB1 assumed in the model and by the fact that RasGAP association with GAB1 occurs only after tyrosine phosphorylation of the GAB1 docking sites, whereas the SOS signal is transmitted by unphosphorylated GAB1 bound to PIP3. This temporal dynamics of the two opposing signals results in the transient Ras-GTP pattern observed experimentally (11,69).
Fig. 5. Computer simulations of the GEF and GAP kinetics.
Simulated time-course of membrane-bound SOS (A) and membrane-bound RasGAP (B) in the presence (dashed line) and absence of wortmannin (WM). Membrane-bound forms SOS and RasGAP involve a number of complexes that contain EGFR or membrane-associated GAB1 and are listed in the Supplementary material. Stimulation with 20 nM EGF.
Wortmannin perturbs both the SOS signal and RasGAP signal, since the GAB1-PIP3 complex is no longer formed (provided PI3K is completely inhibited). However, the computational analysis shows that wortmannin-induced changes to the SOS and RasGAP signaling patterns are markedly different, largely because of the involvement of the phosphatase SHP2, bound to phosphorylated GAB1 (Figs. 4C and 4D), in the control of RasGAP signaling. When PI3K is inhibited, the amplitude and duration of the SOS signal greatly decreases (Fig. 5A). At times longer than about 5 min following the onset of EGF stimulation, the SOS signal becomes almost negligible in wortmannin-treated cells. In contrast to the SOS signal, the RasGAP signal is only modestly reduced by wortmannin. In fact, in control cells the recruitment of SHP2 by tyrosyl-phosphorylated GAB1 bound to PIP3 significantly attenuates GAB1-mediated RasGAP signaling. As a result, inhibition of PI3K by wortmannin is not as critical for the GAP signal as for the GEF signal (Fig. 5B). These distinct temporal patterns of the SOS and RasGAP signals and their different responses to inhibition of PI3K identified by computational modeling are essential for understanding the Ras/MAPK temporal dynamics and PI3K-MAPK crosstalk.
Computational analysis of the temporal dynamics of ERK activation in the presence and absence of PI3K inhibition
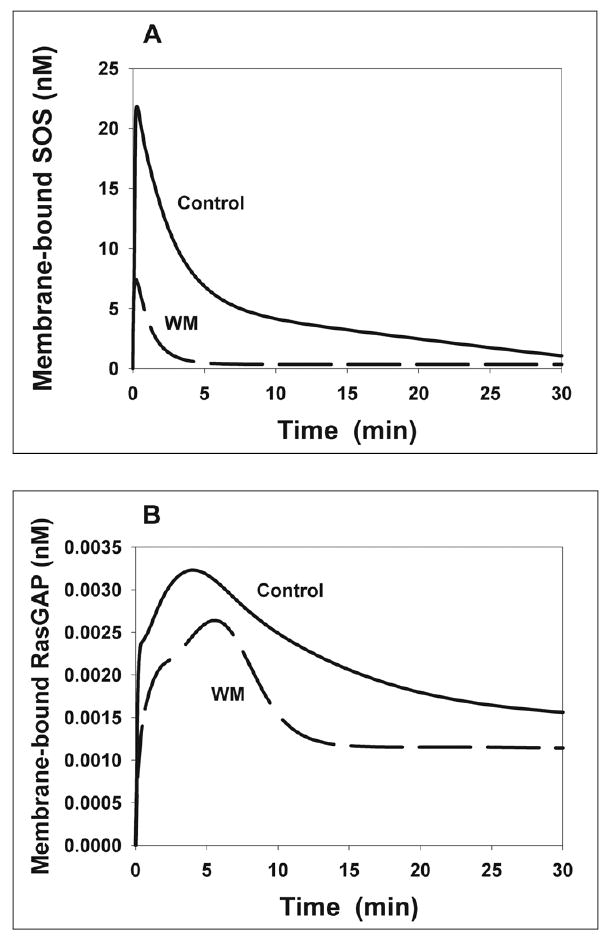
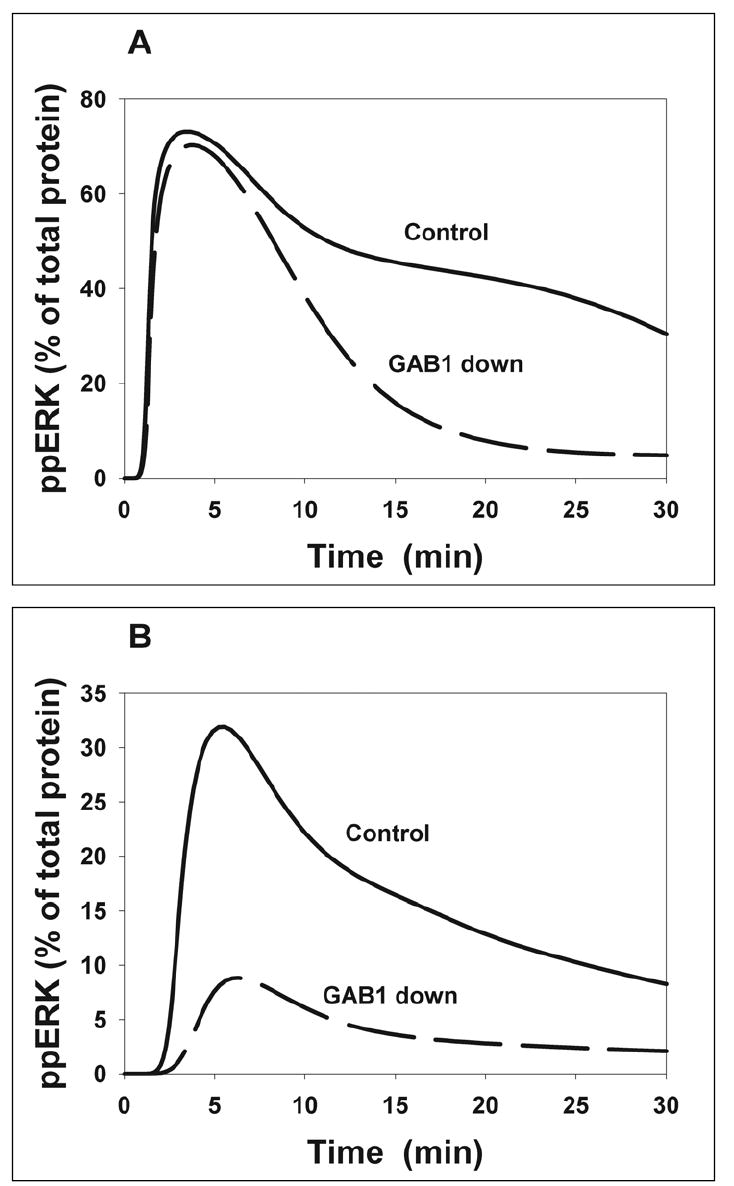
The ERK activation dynamics depends on a complex interplay of a multitude of regulatory signals and interactions. Using only qualitative arguments, it is almost impossible to predict the ERK dynamics that results from multiple non-linear interactions and feedback loops, and a testable computational model can help us provide insights into key causative relationships. Our computational model incorporated known positive and negative feedback loops of the EGFR network. In silico examination suggests that the major effect of GAB1/PI3K-and GAB1/SHP2-mediated feedback interactions is a substantial prolongation of the duration of ERK signaling. The time-courses of Ras and ERK activation for control and wortmannin-treated cells predicted by the model are shown in Fig. 6. At saturating EGF concentrations, the ERK activation level reaches a peak about 5 min after the onset of stimulation and later declines, first more rapidly and, then, more slowly for up to 30 minutes (Fig. 6B) in a general agreement with our experimental data (Fig. 2B). At low EGF levels, simulations show the lag phase in ERK activation (Fig. 6C), also compatible with the data (Fig. 2D). The model suggests that the wortmannin-induced decrease in ERK phosphorylation is primarily caused by a dramatic decline in the SOS signal (Fig. 5A). Computer simulations match the experimental data at both saturating and low EGF concentrations, yet the predominant role of GAB1 in the prolongation of ERK signaling suggested by the model requires direct experimental validation. To address this need, we first used the model to predict the temporal behavior of responses to EGF stimulation in a situation when the total abundance of GAB1 was decreased. Then, these signaling responses were assessed experimentally in HEK293 cells where the GAB1 protein expression was selectively suppressed using short interfering RNA (siRNA).
Fig. 6. Computer simulations of the wortmannin effects on the RasGTP and ERK kinetics.
The calculated time-course of the RasGTP fraction (A) and the threonine/tyrosine phosphorylated ERK fraction following stimulation with 20 nM (B) or 1 nM (C) EGF in the absence and presence (dashed line) of wortmannin (WM).
Computational modeling predictions and in vivo validation of the GAB1 function in the control of the EGFR network temporal dynamics
GAB1 suppression drastically reduces the duration of ERK signaling
The effects of GAB1 suppression and wortmannin on EGF-induced responses might be expected to be similar, because either perturbation suppresses the positive feedback loops mediated by GAB1. However, in silico analysis also emphasizes important distinctions between these two effects.
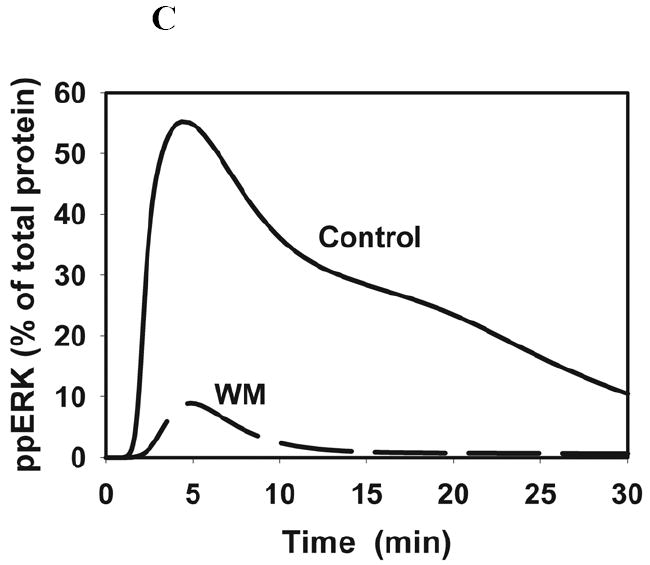
Simulations predict that at saturating EGF concentrations, a 40-70% decrease in the GAB1 protein level would not significantly change the maximal amplitude of ERK phosphorylation (Fig. 7A) in sharp contrast to the wortmannin effect. At low EGF, the calculated ERK activity substantially decreases when the GAB1 protein level is suppressed (Fig. 7B), yet the effect of wortmannin on ERK activation is even more pronounced (Fig. 6C). Similar to wortmannin, GAB1 suppression remarkably shortens the duration of modeled ERK activation (Fig. 7A), largely due to a dramatic decrease in the SOS signal (Supplementary Fig. S2). The model explains that the similarity between GAB1 suppression and wortmannin inhibition arises from a decline in PIP3 production caused by either perturbation, whereas the difference is brought about by a pleiotropic role of GAB1 in EGFR signaling. One of the reasons for this difference is the sequestration of the Grb2-SOS complex by cytoplasmic GAB1. Wortmannin does not change the GAB1 abundance, but significantly decreases the membrane recruitment of GAB1 (largely mediated by PIP3) and makes the excess of inactive GAB1 a scavenger of Grb2, whose association with GAB1 does not require GAB1 phosphorylation.
Fig. 7. Effects of GAB1 depletion on EGF-induced ERK activation predicted by the computational model.
GAB1 protein abundance was 300 nM in control and 100 nM in GAB1-depleted cells (dashed line). Stimulation with 20 nM (A) and 0.5 nM (B) EGF.
Although the signaling dynamics of ERK and MEK change in parallel, at high EGF levels saturation of ERK activation by MEK may occur. In this case, the influence of a partial GAB1 suppression on the maximal phosphorylation level can be greater for MEK than for ERK. In fact, simulations show a moderate, but noticeable decline in the peak of phosphorylated MEK and a dramatic decrease in the duration of the MEK signal in cells where the total GAB1 level is reduced to one third of the control level (Fig. 8A). Similar to ERK activation, the computed MEK activity is inhibited more strongly by wortmannin than by the GAB1 depletion. These theoretical predictions were tested against the experiments, in which HEK293 cells were transfected with siRNA specific for the Gab1 mRNA. 72 hours after siRNA transfection, the GAB1 protein level was 15-30% of the level in control cells. The transfection procedure itself did not cause non-specific changes in GAB1 protein level, as no depletion of GAB1 was observed in cells transfected with non-targeting siRNA in presence or absence of EGF stimulation (Fig. 8B). The experimental data corroborated in silico predictions of the effects of GAB1 suppression and PI3K inhibition by wortmannin on the temporal patterns of MEK activation (Fig. 8C).
Fig. 8. Functional consequences of endogenous Gab1 knockdown on EGF-induced MEK and AKT activation in vivo and in silico.
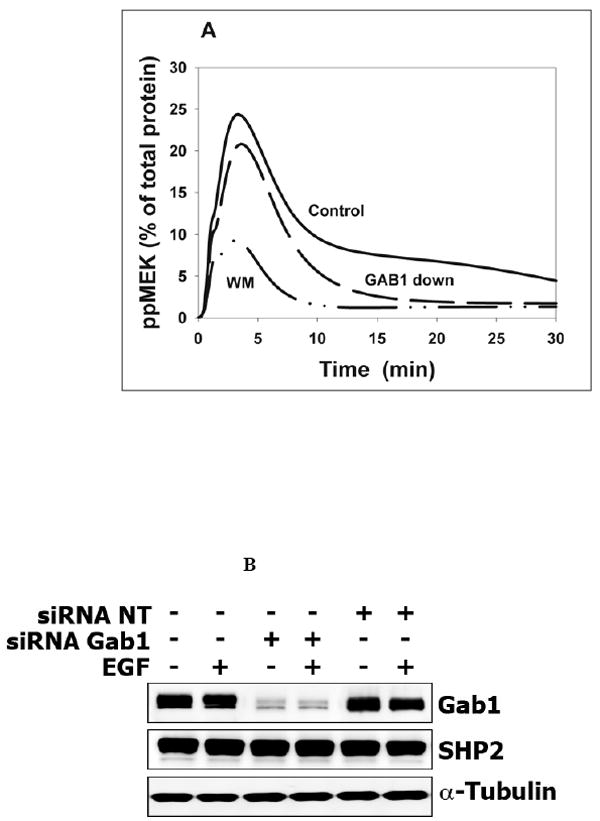
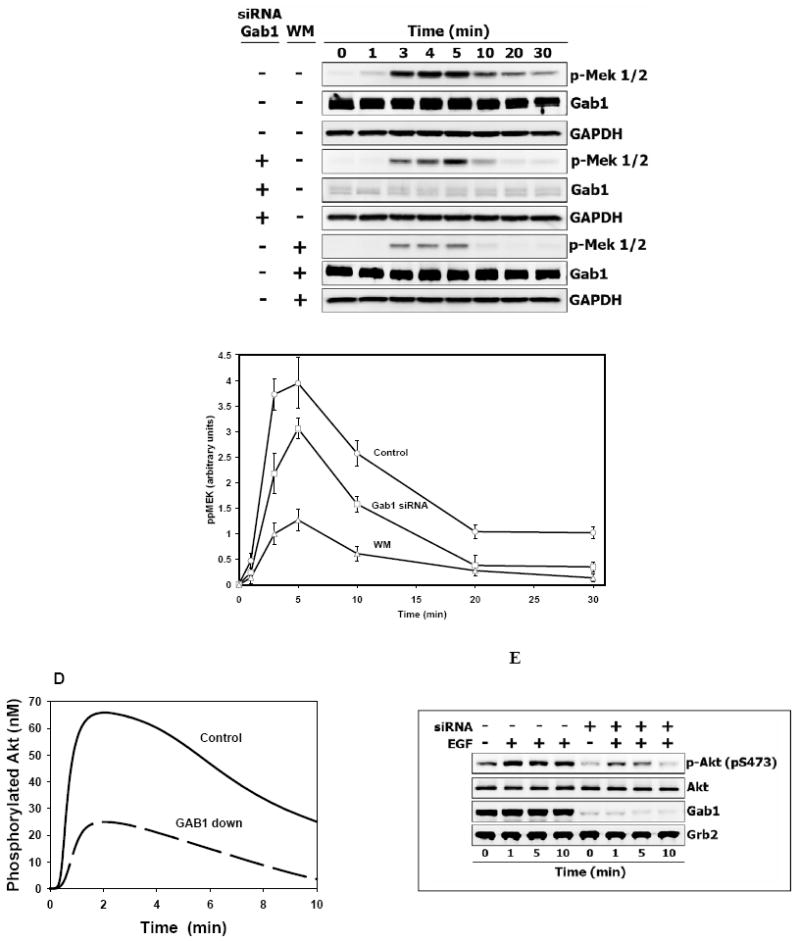
(A) Simulated kinetics of MEK phosphorylation in control cells (solid line), GAB1 suppression (dashed line, [GAB1]=100 nM), or the presence of wortmannin (WM, dashed-dotted), 20 nM EGF. (B). Validation of specific endogenous Gab1 knockdown by siRNA in Hek293 cells. Hek293 cells were transfected with 50 nM Gab1 siRNA, 50 nM Non-Targeting (NT) siRNA or left untreated for 72 hours as described in Materials and Methods. Lysates of quiescent or EGF stimulated (20 nM) cells (5 minutes) were probed with anti-Gab1 antibodies to estimate level of Gab1 suppression. Probing for SHP2 and α-tubulin protein levels was used as specificity and loading control. (C) Time course of MEK phosphorylation in Hek293 cells treated with 20 nM EGF. Cells were either transfected with 50 nM Gab1 siRNA for 72 hours (middle three lines) or 200 nM wortmannin for 30 minutes (bottom three lines) or left untreated (top three lines) before stimulation with EGF. Whole-cell lysates were immunoblotted with anti-phospho-Mek 1/2. Equal Gab1 suppression (~70%) and sample loading were determined with anti-Gab1 and anti-GAPDH antibodies, respectively. Experimental curves of MEK activation were determined in four independent experiments and plotted as the mean ± SEM. Wortmannin (Δ), GAB1 siRNA (□), Control (○). (D) Computer simulated and (E) experimental time course of AKT phosphorylation in Hek293 cells treated with 0.5 nM EGF. Cells were depleted of Gab1 as described above or left untreated before stimulation with ligand. Whole-cell lysates were immunoblotted with anti-phospho-Akt (S473). Membranes were stripped and reprobed with anti-Akt antibodies to show that Gab1 suppression did not affect Akt protein level. Additionally, equal Gab1 suppression (~85%) and sample loading were determined with anti-Gab1 and anti-Grb2 antibodies respectively.
Notably, recent in vivo data, obtained in GAB1−/− mouse embryonic fibroblasts, showed a striking similarity to our in silico patterns of ERK and MEK activation (70). In GAB1−/− cells, the ERK phosphorylation level decreased less than 10% at the maximal value, whereas after reaching the peak this level decayed much faster, and the duration of ERK signaling was greatly diminished compared to GAB1+/− cells. Although the temporal dynamics of MEK and ERK responses was similar, the decline in the peak phosphorylation level was more pronounced for MEK than for ERK (70).
GAB1 suppression decreases Akt activation
The function of GAB1 as an amplifier of growth factor-induced PI3K activation implies that Akt activity will decrease when GAB1 expression is down regulated. Indeed, in silico and in vivo data demonstrate that Akt phosphorylation declines and is more transient in Hek293 cells, in which the GAB1 protein level was about 15-20% of the level in control cells (Figs. 8D and 8E). Interestingly, GAB1 suppression also reduced basal Akt phosphorylation, which is not accounted for by the current model.
In silico predictions of EGF-induced responses in GAB1 mutants
It is instructive to compare the effects of partial GAB1 suppression with the effects of deletion of different GAB1 docking sites on the EGF-induced response dynamics. Using the model, we first predicted the time course of ERK activation in a GAB1 mutant deficient in the p85 PI3K docking site (Tyr447, Tyr472, Tyr589). The effect of deletion or substitution of these tyrosine residues on the temporal pattern of ERK phosphorylation appeared to be similar to the effect of wortmannin owing to the disruption of positive GAB-PI3K feedback (Fig. 9A). Both the peak phosphorylation level and the duration of ERK activation is greatly decreased in this GAB1 mutant (Fig. 9A).
Fig. 9.
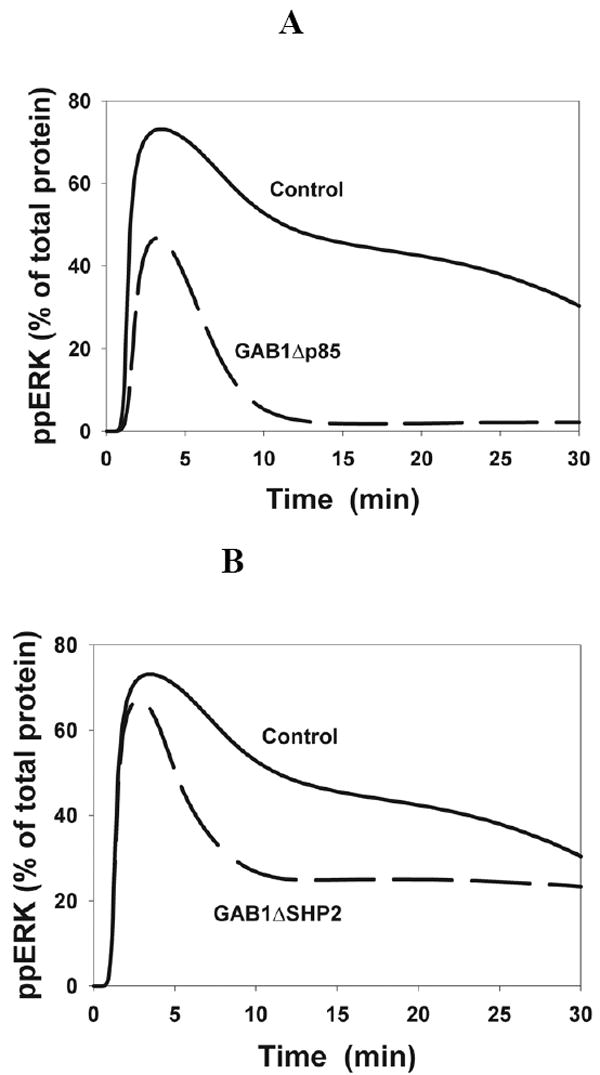
Time-course of ERK activation in GAB1 mutants predicted by the computational model. (A) Gab1Δp85, deletion of the p85 PI3K binding sites (dashed line); (B) Gab1ΔSHP2, deletion of the SHP2-binding sites (dashed line).
The deletion or substitution of tyrosine residues that form the SHP2 binding site on GAB1 is predicted to have a similar influence on the temporal pattern of ERK activation as GAB1 suppression, rather than wortmannin inhibition. Simulations show that the formation of GAB1-SHP2 complex prolongs the duration of ERK activation, but does not significantly increase the ppERK maximal level following stimulation with saturating EGF concentrations (Fig. 9B). These in silico predictions are in a remarkable agreement with recently reported data in GAB1Y627F mutants deficient in SHP2 binding (26).
DISCUSSION
GAB proteins belong to a family of scaffolds, which is conserved from worms to mammals and plays a vital role in signal transduction downstream of growth factor and cytokine receptors. Versatile GAB functioning was attributed to different molecular mechanisms and GAB-binding partners and effectors, including Grb2, c-Met and other RTKs, Crk, Shc, PI3K, RasGAP, phospholipase C gamma, PIP3, Src, and ERK (17,19,22,47,71). However, understanding of a complex network goes beyond a list of binding partners and interactions, and this paper presents an integrated in silico analysis and in vivo validation of the GAB1 function in the EGFR network. The combinatorial complexity of feasible protein-protein and protein-lipid complexes impedes conventional mechanistic modeling of the EGFR/Grb2/GAB/PI3K/Ras network (72). Here, we employ a kinetic description that approximates micro-states of a network of scaffold proteins in terms of macro-states of protein domains (43,44). This description reduced the number of equations and variables from hundreds of thousands to about 350.
Although the challenge of network complexity is partially addressed by a domain-oriented approach, experimental uncertainty of parameter values hampers the use of molecular-level models at a systems scale. The goal of our computational analysis is not to fit an isolated response curve, but to predict and explain an exceedingly large number of diverse patterns of signaling dynamics obtained from our own experiments and literature data. We applied in silico perturbations to our model and wherever possible verified the predicted temporal dynamics in vivo. Our strategy is similar to so-called pattern-oriented modeling, when a large number of quantitative and also qualitative patterns helps us exclude models that are too simple in structure or too uncertain experimentally (73). Although many parameter values remain uncertain, the structure and regulatory mechanisms incorporated in our model are realistic and robust. In fact, we tested the model by using perturbations resulting from different EGF concentrations, specific inhibitors, GAB1 suppression and mutant GAB1 proteins. Most importantly, these perturbations corresponded to single parameter changes, which represent the greatest challenge for any model, because a multitude of temporal patterns have to be described without changes in the rate constants. Our model generated reliable predictions of the temporal dynamics of diverse cellular responses with the same set of kinetic parameters.
In silico and in vivo findings of the present paper suggest that an essential function of GAB1 is to enhance and sustain the activation of the PI3K/Akt and Ras/MAPK pathways. Simulations and data obtained with the PI3K and MAPK pathway inhibitors (Figs.2 - 6) show that GAB1 tyrosine phosphorylation and PI3K/Akt activation are amplified by the tyrosyl-phosphorylated GAB1 → PI3K → PIP3 → tyrosyl-phosphorylated GAB1 positive feedback circuit, whereas negative feedback from ERK shortens the duration of GAB1 tyrosine phosphorylation and decreases Akt activity. The model predicts that the duration of the transient Ras activating signal is significantly controlled by the PIP3 temporal profile. GAB1-PI3K positive feedback increases the number of the Grb2-SOS complexes recruited to the plasma membrane via GAB1-PIP3 in phosphotyrosine-independent manner, whereas tyrosyl-phosphorylated GAB1 associated with PIP3 mediates the recruitment of SHP2 and subsequent dephosphorylation of RasGAP binding sites. Both mechanisms extend the time-period of Ras activation and are sensitive to perturbations of PI3K activity (e.g., using wortmannin) and also by changes in the GAB1 protein abundance.
This study supports the view that the GAB scaffolds function as signaling platforms that can propagate signaling from growth factors and cytokines similar to their cognate receptors. Therefore, the sensitivity to wortmannin should critically depend on the abundance of the receptors and GAB1 and the strength of the signal (32,74). In fact, in HEK293 cells stimulated with low EGF doses, wortmannin-induced suppression of ERK phosphorylation was found more pronounced in silico and in vivo (Figs. 2B, 2D, 6B and 6C). Our computational analysis shows that an increase in the EGFR concentration decreases the wortmannin sensitivity (Fig.10A). Experiments conducted in A431 cells in vivo, where the EGFR level is much higher than in Hek293 cells by one or two orders of magnitude, show that ERK phosphorylation is less sensitive to wortmannin (Fig.10B).
Fig. 10. Computer-simulated effects of wortmannin on ERK activation for cells with increased EGFR level (A) and experimental data for A431 cells.
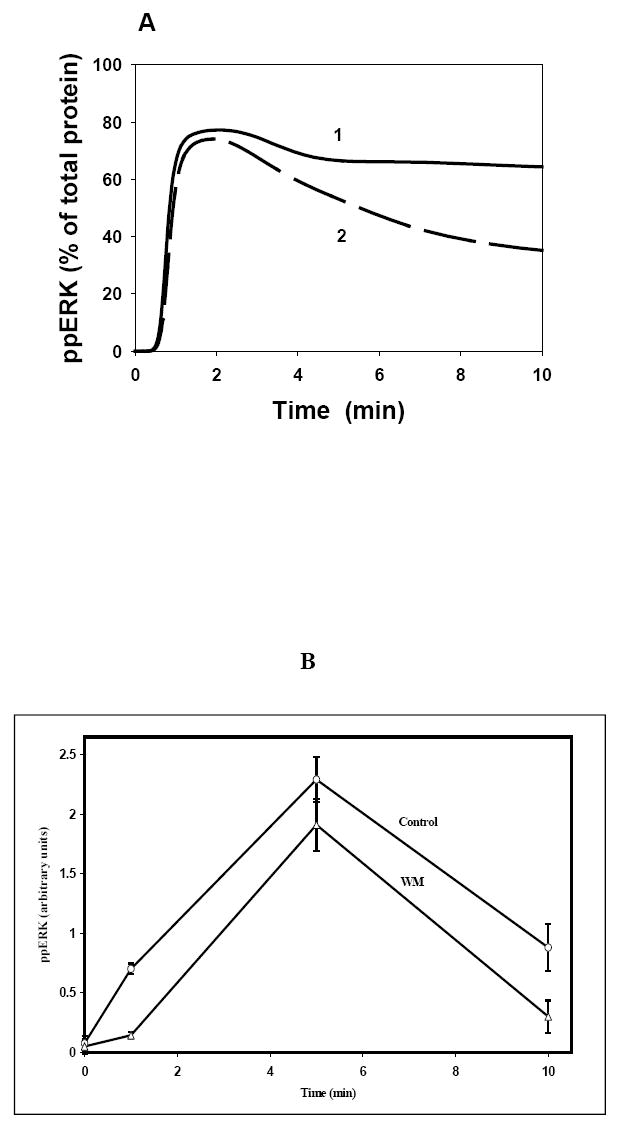
(A) The EGFR concentration was increased by a factor of 10 to 1080 nM. The time-course of EGF (20 nM) induced ERK activation in the absence (1) and the presence (2) of wortmannin (WM). (B) 12 hours starved A431 cells were pretreated with 200nM wortmannin (Δ) or left untreated (○) for 30 minutes before stimulation with 20 nM EGF at indicated time points. Data shown are the mean ± SEM from six independent experiments.
In conclusion, we presented a synergistic experimental and computational analysis of interactions between mitogenic and survival signaling branches of the EGFR network. This analysis has provided insight into intricate signaling responses of the MAPK and PI3K/Akt pathways to EGF and demonstrated that the essential function of the GAB scaffolds is to enhance PI3K/Akt activation and extend the duration of Ras/MAPK signaling.
Supplementary Material
Acknowledgments
This work was supported by the NIH Grant GM59570.
Footnotes
Abbreviations used: EGF - epidermal growth factor, EGFR - epidermal growth factor receptor, ERK - extracellular signal regulated kinase, ERK-PP – Thr202/Tyr204 phosphorylated ERK GAB1 - Grb2-associated binder 1, GEF - guanine nucleotide exchange factor, Grb2 - growth factor receptor binding protein 2, MAPK - mitogen activated protein kinase, MEK – dual specificity mitogen-activated protein kinase kinase, MKP - MAPK phosphatase, PH - pleckstrin homology domain, PI3K - phosphatidylinositol 3-kinase, PIP3 - phosphatidylinositol (3, 4, 5)-triphosphate, PLCγ - phosphoinositide phospholipase C gamma, PTB – phosphotyrosine binding domain, RasGAP/p120-GAP - GTPase-activating protein, RNAi – RNA interference, RTK - receptor tyrosine kinase, SH2/3 - Src homology 2/3 domain, Shc - Src homology 2 and alpha-collagen domain containing protein, SHP2 - Src homology 2 containing phosphotyrosine phosphatase, siRNA – short interfering RNA, SOS - son of sevenless, Src - src avian sarcoma viral oncogene homolog, WM – wortmannin.
References
- 1.Hunter T. Cell. 2000;100:113–127. doi: 10.1016/s0092-8674(00)81688-8. [DOI] [PubMed] [Google Scholar]
- 2.Schlessinger J. Science. 2004;306:1506–1507. doi: 10.1126/science.1105396. [DOI] [PubMed] [Google Scholar]
- 3.Schlessinger J. Cell. 2000;103:211–225. doi: 10.1016/s0092-8674(00)00114-8. [DOI] [PubMed] [Google Scholar]
- 4.Cheng AM, Saxton TM, Sakai R, Kulkarni S, Mbamalu G, Vogel W, Tortorice CG, Cardiff RD, Cross JC, Muller WJ, Pawson T. Cell. 1998;95:793–803. doi: 10.1016/s0092-8674(00)81702-x. [DOI] [PubMed] [Google Scholar]
- 5.Raabe T, Olivier JP, Dickson B, Liu X, Gish GD, Pawson T, Hafen E. Embo J. 1995;14:2509–2518. doi: 10.1002/j.1460-2075.1995.tb07248.x. [DOI] [PMC free article] [PubMed] [Google Scholar]
- 6.Egan SE, Giddings BW, Brooks MW, Buday L, Sizeland AM, Weinberg RA. Nature. 1993;363:45–51. doi: 10.1038/363045a0. [DOI] [PubMed] [Google Scholar]
- 7.Haugh JM, Lauffenburger DA. Biophys J. 1997;72:2014–2031. doi: 10.1016/S0006-3495(97)78846-5. [DOI] [PMC free article] [PubMed] [Google Scholar]
- 8.Kholodenko BN, Hoek JB, Westerhoff HV. Trends Cell Biol. 2000;10:173–178. doi: 10.1016/s0962-8924(00)01741-4. [DOI] [PubMed] [Google Scholar]
- 9.Vojtek AB, Der CJ. J Biol Chem. 1998;273:19925–19928. doi: 10.1074/jbc.273.32.19925. [DOI] [PubMed] [Google Scholar]
- 10.Cullen PJ. Curr Biol. 2001;11:R342–344. doi: 10.1016/s0960-9822(01)00189-0. [DOI] [PubMed] [Google Scholar]
- 11.Markevich NI, Moehren G, Demin O, Kiyatkin A, Hoek JB, Kholodenko BN. IEE Systems Biology. 2004;1:104–113. doi: 10.1049/sb:20045003. [DOI] [PubMed] [Google Scholar]
- 12.Denhardt DT. Biochem J. 1996;318:729–747. doi: 10.1042/bj3180729. [DOI] [PMC free article] [PubMed] [Google Scholar]
- 13.Cherniack AD, Klarlund JK, Conway BR, Czech MP. J Biol Chem. 1995;270:1485–1488. [PubMed] [Google Scholar]
- 14.Hu Y, Bowtell DD. Oncogene. 1996;12:1865–1872. [PubMed] [Google Scholar]
- 15.Langlois WJ, Sasaoka T, Saltiel AR, Olefsky JM. J Biol Chem. 1995;270:25320–25323. doi: 10.1074/jbc.270.43.25320. [DOI] [PubMed] [Google Scholar]
- 16.Saxton TM, Cheng AM, Ong SH, Lu Y, Sakai R, Cross JC, Pawson T. Curr Biol. 2001;11:662–670. doi: 10.1016/s0960-9822(01)00198-1. [DOI] [PubMed] [Google Scholar]
- 17.Holgado-Madruga M, Emlet DR, Moscatello DK, Godwin AK, Wong AJ. Nature. 1996;379:560–564. doi: 10.1038/379560a0. [DOI] [PubMed] [Google Scholar]
- 18.Rodrigues GA, Falasca M, Zhang Z, Ong SH, Schlessinger J. Mol Cell Biol. 2000;20:1448–1459. doi: 10.1128/mcb.20.4.1448-1459.2000. [DOI] [PMC free article] [PubMed] [Google Scholar]
- 19.Mattoon DR, Lamothe B, Lax I, Schlessinger J. BMC Biol. 2004;2:24. doi: 10.1186/1741-7007-2-24. [DOI] [PMC free article] [PubMed] [Google Scholar]
- 20.Schaeper U, Gehring NH, Fuchs KP, Sachs M, Kempkes B, Birchmeier W. J Cell Biol. 2000;149:1419–1432. doi: 10.1083/jcb.149.7.1419. [DOI] [PMC free article] [PubMed] [Google Scholar]
- 21.Lock LS, Royal I, Naujokas MA, Park M. J Biol Chem. 2000;275:31536–31545. doi: 10.1074/jbc.M003597200. [DOI] [PubMed] [Google Scholar]
- 22.Gu H, Neel BG. Trends Cell Biol. 2003;13:122–130. doi: 10.1016/s0962-8924(03)00002-3. [DOI] [PubMed] [Google Scholar]
- 23.Wolf I, Jenkins BJ, Liu Y, Seiffert M, Custodio JM, Young P, Rohrschneider LR. Mol Cell Biol. 2002;22:231–244. doi: 10.1128/MCB.22.1.231-244.2002. [DOI] [PMC free article] [PubMed] [Google Scholar]
- 24.Vanhaesebroeck B, Alessi DR. Biochem J. 2000;346(Pt 3):561–576. [PMC free article] [PubMed] [Google Scholar]
- 25.Yart A, Laffargue M, Mayeux P, Chretien S, Peres C, Tonks N, Roche S, Payrastre B, Chap H, Raynal P. J Biol Chem. 2001;276:8856–8864. doi: 10.1074/jbc.M006966200. [DOI] [PubMed] [Google Scholar]
- 26.Cai T, Nishida K, Hirano T, Khavari PA. J Cell Biol. 2002;159:103–112. doi: 10.1083/jcb.200205017. [DOI] [PMC free article] [PubMed] [Google Scholar]
- 27.Agazie YM, Hayman MJ. Mol Cell Biol. 2003;23:7875–7886. doi: 10.1128/MCB.23.21.7875-7886.2003. [DOI] [PMC free article] [PubMed] [Google Scholar]
- 28.Montagner A, Yart A, Dance M, Perret B, Salles JP, Raynal P. J Biol Chem. 2005;280:5350–5360. doi: 10.1074/jbc.M410012200. [DOI] [PubMed] [Google Scholar]
- 29.Itoh M, Yoshida Y, Nishida K, Narimatsu M, Hibi M, Hirano T. Mol Cell Biol. 2000;20:3695–3704. doi: 10.1128/mcb.20.10.3695-3704.2000. [DOI] [PMC free article] [PubMed] [Google Scholar]
- 30.Ren Y, Meng S, Mei L, Zhao ZJ, Jove R, Wu J. J Biol Chem. 2004;279:8497–8505. doi: 10.1074/jbc.M312575200. [DOI] [PubMed] [Google Scholar]
- 31.Lamothe B, Yamada M, Schaeper U, Birchmeier W, Lax I, Schlessinger J. Mol Cell Biol. 2004;24:5657–5666. doi: 10.1128/MCB.24.13.5657-5666.2004. [DOI] [PMC free article] [PubMed] [Google Scholar]
- 32.Duckworth BC, Cantley LC. J Biol Chem. 1997;272:27665–27670. doi: 10.1074/jbc.272.44.27665. [DOI] [PubMed] [Google Scholar]
- 33.Dixon RJ, Brunskill NJ. Kidney Int. 1999;56:2064–2075. doi: 10.1046/j.1523-1755.1999.00797.x. [DOI] [PubMed] [Google Scholar]
- 34.Page K, Li J, Wang Y, Kartha S, Pestell RG, Hershenson MB. Am J Respir Cell Mol Biol. 2000;23:436–443. doi: 10.1165/ajrcmb.23.4.3953. [DOI] [PubMed] [Google Scholar]
- 35.Hatakeyama M, Kimura S, Naka T, Kawasaki T, Yumoto N, Ichikawa M, Kim JH, Saito K, Saeki M, Shirouzu M, Yokoyama S, Konagaya A. Biochem J. 2003;373:451–463. doi: 10.1042/BJ20021824. [DOI] [PMC free article] [PubMed] [Google Scholar]
- 36.Kholodenko BN, Demin OV, Moehren G, Hoek JB. J Biol Chem. 1999;274:30169–30181. doi: 10.1074/jbc.274.42.30169. [DOI] [PubMed] [Google Scholar]
- 37.Kholodenko BN. Eur J Biochem. 2000;267:1583–1588. doi: 10.1046/j.1432-1327.2000.01197.x. [DOI] [PubMed] [Google Scholar]
- 38.Moehren G, Markevich N, Demin O, Kiyatkin A, Goryanin I, Hoek JB, Kholodenko BN. Biochemistry. 2002;41:306–320. doi: 10.1021/bi011506c. [DOI] [PubMed] [Google Scholar]
- 39.Markevich NI, Hoek JB, Holodenko BN. J Cell Biol. 2004;164:353–359. doi: 10.1083/jcb.200308060. [DOI] [PMC free article] [PubMed] [Google Scholar]
- 40.Suenaga A, Kiyatkin AB, Hatakeyama M, Futatsugi N, Okimoto N, Hirano Y, Narumi T, Kawai A, Susukita R, Koishi T, Furusawa H, Yasuoka K, Takada N, Ohno Y, Taiji M, Ebisuzaki T, Hoek JB, Konagaya A, Kholodenko BN. J Biol Chem. 2004;279:4657–4662. doi: 10.1074/jbc.M310598200. [DOI] [PubMed] [Google Scholar]
- 41.Schoeberl B, Eichler-Jonsson C, Gilles ED, Muller G. Nat Biotechnol. 2002;20:370–375. doi: 10.1038/nbt0402-370. [DOI] [PubMed] [Google Scholar]
- 42.Resat H, Ewald JA, Dixon DA, Wiley HS. Biophys J. 2003;85:730–743. doi: 10.1016/s0006-3495(03)74516-0. [DOI] [PMC free article] [PubMed] [Google Scholar]
- 43.Borisov NM, Markevich NI, Hoek JB, Kholodenko BN. Biophys J. 2005;89:951–966. doi: 10.1529/biophysj.105.060533. [DOI] [PMC free article] [PubMed] [Google Scholar]
- 44.Borisov NM, Markevich NI, Hoek JB, Kholodenko BN. BioSystems. 2005 in press. [Google Scholar]
- 45.Cunnick JM, Dorsey JF, Munoz-Antonia T, Mei L, Wu J. J Biol Chem. 2000;275:13842–13848. doi: 10.1074/jbc.275.18.13842. [DOI] [PubMed] [Google Scholar]
- 46.Songyang Z, Shoelson SE, McGlade J, Olivier P, Pawson T, Bustelo XR, Barbacid M, Sabe H, Hanafusa H, Yi T, et al. Mol Cell Biol. 1994;14:2777–2785. doi: 10.1128/mcb.14.4.2777. [DOI] [PMC free article] [PubMed] [Google Scholar]
- 47.Ingham RJ, Holgado-Madruga M, Siu C, Wong AJ, Gold MR. J Biol Chem. 1998;273:30630–30637. doi: 10.1074/jbc.273.46.30630. [DOI] [PubMed] [Google Scholar]
- 48.Goldstein B, Faeder JR, Hlavacek WS, Blinov ML, Redondo A, Wofsy C. Mol Immunol. 2002;38:1213–1219. doi: 10.1016/s0161-5890(02)00066-4. [DOI] [PubMed] [Google Scholar]
- 49.Hlavacek WS, Faeder JR, Blinov ML, Perelson AS, Goldstein B. Biotechnol Bioeng. 2003;84:783–794. doi: 10.1002/bit.10842. [DOI] [PubMed] [Google Scholar]
- 50.Shepherd PR, Withers DJ, Siddle K. Biochem J. 1998;333(Pt 3):471–490. doi: 10.1042/bj3330471. [DOI] [PMC free article] [PubMed] [Google Scholar]
- 51.O’Neill E, Kolch W. Br J Cancer. 2004;90:283–288. doi: 10.1038/sj.bjc.6601488. [DOI] [PMC free article] [PubMed] [Google Scholar]
- 52.Tran NH, Frost JA. J Biol Chem. 2003;278:11221–11226. doi: 10.1074/jbc.M210318200. [DOI] [PubMed] [Google Scholar]
- 53.King AJ, Wireman RS, Hamilton M, Marshall MS. FEBS Lett. 2001;497:6–14. doi: 10.1016/s0014-5793(01)02425-5. [DOI] [PubMed] [Google Scholar]
- 54.Alessi DR, Saito Y, Campbell DG, Cohen P, Sithanandam G, Rapp U, Ashworth A, Marshall CJ, Cowley S. Embo J. 1994;13:1610–1619. doi: 10.1002/j.1460-2075.1994.tb06424.x. [DOI] [PMC free article] [PubMed] [Google Scholar]
- 55.Kolch W. Biochem J. 2000;351(Pt 2):289–305. [PMC free article] [PubMed] [Google Scholar]
- 56.Chang L, Karin M. Nature. 2001;410:37–40. doi: 10.1038/35065000. [DOI] [PubMed] [Google Scholar]
- 57.Alessi DR, Gomez N, Moorhead G, Lewis T, Keyse SM, Cohen P. Curr Biol. 1995;5:283–295. doi: 10.1016/s0960-9822(95)00059-5. [DOI] [PubMed] [Google Scholar]
- 58.Pulido R, Zuniga A, Ullrich A. Embo J. 1998;17:7337–7350. doi: 10.1093/emboj/17.24.7337. [DOI] [PMC free article] [PubMed] [Google Scholar]
- 59.Zhao Y, Zhang ZY. J Biol Chem. 2001;276:32382–32391. doi: 10.1074/jbc.M103369200. [DOI] [PubMed] [Google Scholar]
- 60.Burack WR, Sturgill TW. Biochemistry. 1997;36:5929–5933. doi: 10.1021/bi970535d. [DOI] [PubMed] [Google Scholar]
- 61.Ferrell JE, Jr, Bhatt RR. J Biol Chem. 1997;272:19008–19016. doi: 10.1074/jbc.272.30.19008. [DOI] [PubMed] [Google Scholar]
- 62.Huang CY, Ferrell JE., Jr Proc Natl Acad Sci U S A. 1996;93:10078–10083. doi: 10.1073/pnas.93.19.10078. [DOI] [PMC free article] [PubMed] [Google Scholar]
- 63.Zimmermann S, Moelling K. Science. 1999;286:1741–1744. doi: 10.1126/science.286.5445.1741. [DOI] [PubMed] [Google Scholar]
- 64.Wellbrock C, Karasarides M, Marais R. Nat Rev Mol Cell Biol. 2004;5:875–885. doi: 10.1038/nrm1498. [DOI] [PubMed] [Google Scholar]
- 65.Roshan B, Kjelsberg C, Spokes K, Eldred A, Crovello CS, Cantley LG. J Biol Chem. 1999;274:36362–36368. doi: 10.1074/jbc.274.51.36362. [DOI] [PubMed] [Google Scholar]
- 66.Yu CF, Liu ZX, Cantley LG. J Biol Chem. 2002;277:19382–19388. doi: 10.1074/jbc.M200732200. [DOI] [PubMed] [Google Scholar]
- 67.Arnaud M, Crouin C, Deon C, Loyaux D, Bertoglio J. J Immunol. 2004;173:3962–3971. doi: 10.4049/jimmunol.173.6.3962. [DOI] [PubMed] [Google Scholar]
- 68.Lehr S, Kotzka J, Avci H, Sickmann A, Meyer HE, Herkner A, Muller-Wieland D. Biochemistry. 2004;43:12133–12140. doi: 10.1021/bi049753e. [DOI] [PubMed] [Google Scholar]
- 69.Sasagawa S, Ozaki Y, Fujita K, Kuroda S. Nat Cell Biol. 2005;7:365–373. doi: 10.1038/ncb1233. [DOI] [PubMed] [Google Scholar]
- 70.Yamasaki S, Nishida K, Yoshida Y, Itoh M, Hibi M, Hirano T. Oncogene. 2003;22:1546–1556. doi: 10.1038/sj.onc.1206284. [DOI] [PubMed] [Google Scholar]
- 71.Weidner KM, Di Cesare S, Sachs M, Brinkmann V, Behrens J, Birchmeier W. Nature. 1996;384:173–176. doi: 10.1038/384173a0. [DOI] [PubMed] [Google Scholar]
- 72.Blinov ML, Faeder JR, Goldstein B, Hlavacek WS. Biosystems. 2005 doi: 10.1038/nbt1105-1344. [DOI] [PubMed] [Google Scholar]
- 73.Grimm V, Revilla E, Berger U, Jeltsch F, Mooij WM, Railsback SF, Thulke HH, Weiner J, Wiegand T, DeAngelis DL. Science. 2005;310:987–991. doi: 10.1126/science.1116681. [DOI] [PubMed] [Google Scholar]
- 74.Wennstrom S, Downward J. Mol Cell Biol. 1999;19:4279–4288. doi: 10.1128/mcb.19.6.4279. [DOI] [PMC free article] [PubMed] [Google Scholar]
Associated Data
This section collects any data citations, data availability statements, or supplementary materials included in this article.