

Abstract
Many psychiatric patient groups smoke heavily, but little is known regarding the effects of this habit on functional brain imaging results. The present report assesses the effect of chronic smoking on the blood-oxygen-level-dependent (BOLD) response to a simple visual activation (VA) task and a breath hold (BH) task in patients with schizophrenia. Eight healthy controls and twelve patients with schizophrenia were studied. Half of each group had never smoked and the other half of each group had smoked for more than 10 pack years. Responses to the VA task were assessed in the visual cortex and responses to the BH task were assessed in gray matter generally. There were four fMRI dependent measures: (1) median percent signal change; (2) activation volume (in voxels); (3) time-to-peak of the impulse response function (IRF); and (4) time-to-trough of the IRF. All measures were tested as dependent variables in an ANCOVA with diagnosis and smoking status as crossed factors and age as a covariate. Heavy smokers had 22% larger percent signal change for the VA task and 50% larger percent signal change for the BH task. Patients had a 40% larger percent signal change for the breath-hold task. Other statistically significant effects of smoking history on activation volume and the timing of the brain responses were noted. If replicated, the results may have important implications for fMRI studies comparing groups with markedly different smoking habits, such as studies comparing patients with schizophrenia, 60–90% of whom smoke, and healthy controls, who smoke with a much lower frequency.
Introduction
Patients with schizophrenia are frequently smokers whereas control subjects typically are not (de Leon and Diaz, 2005). de Leon and Diaz (2005) report that the median smoking rate (across multiple studies) in patients with schizophrenia was 75% whereas the median smoking rate among control subjects was 24%. Moreover, patients smoke each cigarette longer and inhale the smoke more deeply than control smokers (Olincy et al, 1997). Other psychiatric disorders are also associated with increased smoking (Leonard et al, 2001).
Despite these marked diagnosis-related differences in smoking habits, we are not aware of any study that has taken this into account when analyzing patient differences on fMRI results. Two studies have compared non-smokers to smokers on cognitive tasks (Lawrence et al, 2002; Xu et al, 2007). Lawrence et al (2002) compared smokers to non-smokers on brain activation to a visual vigilance task. They found that smokers had a reduced response in the parietal cortex and caudate. On the other hand, Xu et al (2007) found that smokers had a significantly elevated response to the Stroop task in the right precentral sulcus. We are not aware of any study which has compared heavy smoking and non-smoking groups on BOLD fMRI responses to a simple sensory activation task. Although there have been other smoking-related fMRI studies (see Brody, 2006; Jacobsen, 2007 for review) these studies have been focused on nicotine craving and other cognitive aspects and not on the simple question of a change in the amplitude of the functional response in smokers.
Cigarette smoking causes lung damage and is the dominant risk factor for chronic obstructive pulmonary disease (Isager and Hagerup, 1971; Clark et al, 1998). Chronic smoking also contributes to atherosclerosis (Astrup, 1973; Mustard, 1981), and smoking is the strongest predictor of severe carotid artery stenosis (Whisnant et al, 1990). Moreover, chronic smoking is linked in several ways to hypertension (Kochar and Bindra, 1996), and to the development of diabetes (Eliasson, 2003). Furthermore, cigarette smoking causes increases in hematocrit and hemoglobin concentration (Whitehead et al, 1995) and blood viscosity (Lowe et al, 1980). Since a number of these effects have been shown to impact the BOLD fMRI signal (Hamzei et al, 2003; Levin et al, 2001; Gustard et al, 2003; Wessels et al, 2006), it was important to look for a potential relationship between the BOLD response to activation tasks and smoking history.
The present study examines the effects of smoking history and diagnosis on the BOLD response to 2 tasks: a simple visual activation (VA) task and a breath-hold (BH) task. The visual activation task was employed to assess smoking effects on a robust sensory activation paradigm.
The BOLD response to the BH task is thought to reflect cerebrovascular reactivity (Thomason et al, 2007). During this task subjects hold their breath after inspiration for 16 seconds and then breathe normally for 16 seconds. The key measure of the BOLD BH response is the increase in signal from the trough during the BH period to the peak during the normal breathing period. This increase is thought to reflect an increase in CO2, which leads to an increase in cerebral blood flow (CBF) (Meyer et al., 1966, Thomason et al., 2005), which leads to a decrease in dHb% in venules and veins, which leads to an increased signal. In contrast to cognitive and sensory BOLD activations, the BH-induced signal increase is understood to occur in the absence of an increase in neuronal metabolism and the rate of dHb production remains at a basal level. Thus, the increase in the BOLD signal from trough-to-peak during the BH paradigm is thought to provide a measure of non-cognitive, maximal BOLD response (cerebrovascular reactivity)(Thomason et al, 2007). The inclusion of both the VA and the BH task should facilitate the assessment of potential neural and cerebrovascular effects of a chronic smoking history.
The present study examines the effect of smoking history, schizophrenia, and their interaction, on the BOLD response to a simple visual activation task and on cerebrovascular reactivity in 12 patients with schizophrenia and 8 control subjects.
Materials and Methods
Subjects
Demographic data for the 20 subjects in the current study are provided in Table 1. There were 8 control subjects and 12 patients with schizophrenia. To be included in the heavy-smoker group, subjects had to have smoked for 10 or more pack years. There were 4 subgroups: Control-Non-Smokers (CON-NON), Control-Heavy Smokers (CON-SMO), Patient-Non-Smokers (PAT-NON), and Patient-Heavy-Smokers (PAT-SMO). There was no statistically significant difference between the mean age of the patients and controls, or the non-smokers and heavy-smokers. There was an increased age range in the patient group. The number of pack years in patients did not differ significantly from the number of pack years in controls (Mann-Whitney test, p = 0.91). Nine of 10 subjects in the heavy smoking groups were current smokers. One control heavy-smoker had quit several months before the fMRI study. Subjects abstained from cigarette smoking for at least 1 hour prior to the fMRI session. The study was approved by the Institutional Review Board at University of California – Irvine. Written informed consent was obtained after the procedure had been fully explained.
Table 1.
Subject Demographics
| Group: | Control Nonsmokers (CON-NON) | Control Smokers (CON-SMO) | Patient Nonsmokers (PAT-NON) | Patient Smokers (PAT-SMO) |
|---|---|---|---|---|
| N | 4 | 4 | 6 | 6 |
| Age (SD) | 44.8 (7.1) | 46.3 (2.2) | 48.5 (5.8) | 34.5 (10.8) |
| Age Range | 39–55 | 44–49 | 21–49 | 26–55 |
| M/F | 2/2 | 2/2 | 5/1 | 5/1 |
| Pack Years (mean, range) | 25.2 (16.5 – 35.0) | 40.9 (14.8 – 88.5) |
Patients met DSM-IV criteria for schizophrenia or schizoaffective disorder based on the Structured Clinical Interview for DSM-IV (SCID, First, 2002) administered by medical doctors or Ph.D. level psychologists. Of the twelve patients, eight were of the paranoid subtype, two were of the undifferentiated subtype and two had schizoaffective disorder. All were taking stable doses of atypical (n=11) or typical (n=1) antipsychotic medications. They had been ill a mean of 18.5 years (SD: 10.2). The total score for the SANS (scale for the assessment of negative symptoms, Andreasen, 1989) was 35.3 (sd = 14.6) and the total score for the SAPS (positive symptoms, Andreasen et al, 1990) was 25.1 (sd = 12.7) for the 11 patients with available data.
Image acquisition
The data were collected at the University of California-Irvine using a Picker 1.5T Eclipse scanner, with a read-only quadrature head coil. The functional data were collected with an EPI sequence (orientation: parallel to the AC-PC line, number of slices = 21, slice thickness = 4mm, no gap, TR=2.0 sec, TE = 40 ms, FOV = 22 cm, matrix = 64×64, voxel dimensions = 3.4375 mm × 3.4375 mm × 4 mm). The anatomical data were collected with a high-resolution T1-weighted sequence collected during the same scanning session (TR = 13 msec, TE = 3.7 msec, Flip Angle = 20, thickness = 1.5 mm, matrix = 256×256, voxel size = 0.9375 × 0.9375 × 1.5 mm).
Organization of the Methods and Results
Two tasks were evaluated, the visual activation task and the breath-hold task. Below, we present the general methods and the specific methods employed to assess the visual activation data, followed by a result section for this task. Then, we present the specific methods employed to assess the breath-hold task followed by a second results section. Next, we present the methods employed in relating the results of the two tasks and a results section describing these relationships.
Note that both tasks employed block designs with similar timing (16 sec “on” blocks and 16 sec “off” blocks)1 and identical task length; so much of the image processing and statistical analysis was identical for both.
Visual Activation (VA) Task
The VA task consisted of a block design with block durations of 16s on/off. During the on-block, a checkerboard stimulus appeared at 21 times, separated by irregular, brief intervals (ISI range = 500 – 1000 msec, average ISI = 762 msec, flash duration = 200 msec). Each time the checkerboard appeared, subjects pressed a button with the index finger of their dominant hand. During the off-block, subjects fixated on a central crosshair with no finger tapping. During each run of this task, 120 sequential volumes (240 sec) were collected, and each subject completed two runs.
fMRI Data Analysis Common to Both Tasks
Preprocessing
The first several steps of image processing were accomplished using Analysis of Functional NeuroImage (AFNI) software (Cox, 1996). The first 2 volumes were discarded to allow for T1-saturation effects to stabilize. All large spikes in the data were removed from each run (amplitude greater than +/− 4.5 standard deviations) and each run was motion corrected (i.e., spatially registered to the middle volume of the run, volume index = 60). The data were then slice-time corrected. A mean functional (T2*) image was created. The mean T2* image for each run was spatially normalized to an EPI canonical image in MNI space using tools available in SPM5 (http://www.fil.ion.ucl.ac.uk/spm/). This included affine transformations and 3 non-linear iterations. We limited the non-linear iterations to 3 to control the amount of deformation. The spatial transformations were applied to the time series data as well, and the time series images were resampled to a 4×4×4 mm voxel size. The impulse response functions (IRF) for each voxel were estimated using Keith Worsley’s package, FMRISTAT (Worsley et al, 2002) (http://www.math.mcgill.ca/keith/fmristat/), according to the FIR-Deconvolution method outlined at the FMRISTAT web page (see “Estimating the time course of the response”). Both tasks employed a block design with 16 sec “on” blocks and 16 sec “off” blocks. Thus, the IRFs were 32 seconds long (16 time points, 2 sec apart), covering the duration of the on and off block periods. Temporal drift was removed by adding a linear and a quadratic component to the model. The percent signal change IRFs were calculated by dividing the estimates (betas) by the model intercept (mean baseline level) and multiplying by 100.
Visual Cortex ROIs
A functional ROI, determined by the degree of activation in the visual cortex region, was produced for each run (2 runs per subject). The FIR-Deconvolution method of FMRISTAT estimates a beta-weight (and its standard deviation) for each time period. To determine which regions were activated by the task, the beta-weights for the 5 time points from 5 to 13 seconds (when the task activation should peak, see Figure 1) were contrasted with the 5 time points from 21 to 29 seconds (when the task activation should be in a trough) using Multistat, an analysis tool provided by FMRISTAT. This amounts to a contrast between the mean of the 5 time points in the area of the peak versus the mean of the 5 time points in the area of the trough. Multistat produced a t-value for the contrast among beta-weights, and brain areas were considered activated when the p-value associated with this t-value was <0.01. Only positive t-value regions were included. These maps of statistically significant voxels were further masked to include only voxels in the visual cortex area by employing a subject-specific, structurally based visual cortex ROI mask.
Figure 1.
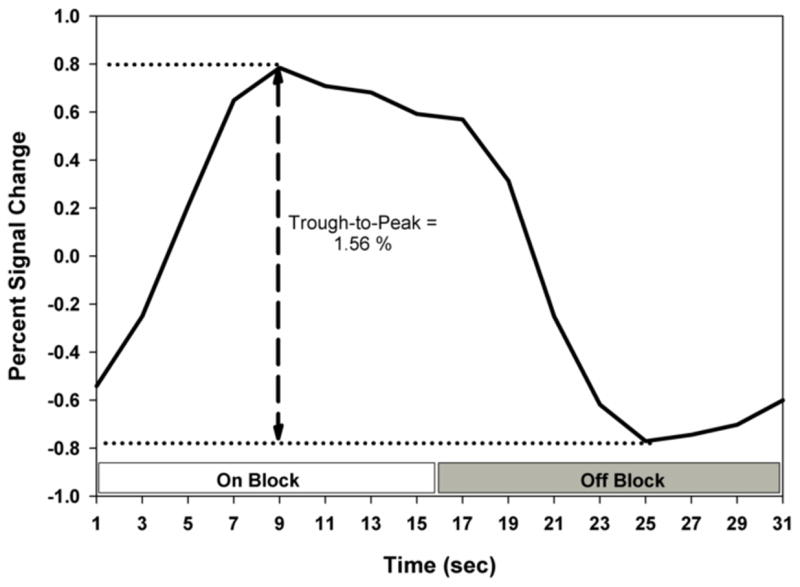
Illustration of the median percent signal change IRF and the trough-to-peak measurement. The on block and off block are indicated. The IRF in this figure is the average of six control non-smokers.
The first step in creating subject-specific, structurally based visual cortex ROI masks was to segment the structural images using Freesurfer (http://surfer.nmr.mgh.harvard.edu/fswiki). Using Freesurfer-analyzed images, high resolution masks were created for the visual cortex for each subject by combing the calcarine cortex, the cuneus and the occipital pole for both the left and right hemispheres. These masks were then registered to MNI space and downsampled to a 4×4×4 mm voxel size to match the functional images. Finally, these masks were dilated by 2 voxels in 3 dimensions. Only brain voxels were included. Examples of three representative ROIs are presented in Figure 2. These ROIs, which were both functionally and structurally defined, will be referred to as Visual Cortex ROIs.
Figure 2.
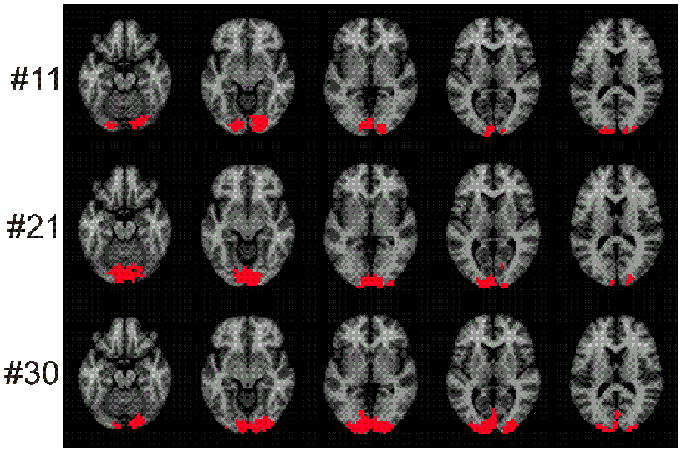
Three (of 40 total) representative ROIs for the visual activation task, chosen to show the range of ROI sizes. The voxels in the ROIs are shown in red. There were 20 subjects and 2 visual activation runs for 40 separate ROIs. These 40 ROIs were rank ordered by size. The figure presents the 11th, the 21st and the 30th ROI in this list. These are approximately the 25th, 50th and 75th percentiles, respectively.
Although our task did have a motor component, this was a very weak motor stimulus and the response patterns were quite variable. For this reason, only the visual activation was formally studied.
Computing Median Percent Signal Change
The percent signal change associated with visual activation was taken by finding the peak value among the 5 time points from 5 to 13 seconds post-stimulus onset and subtracting the minimal value for time points from 21 to 29 seconds for each voxel in the visual cortex ROI for each run of the visual activation task. The median percent signal change in each ROI was taken as the representative value for each ROI after it was determined that the distributions of percent signal change values in each ROI was typically quite skewed to the left (median skew: 2.04; interquartile range: 1.34 to 2.78). Only one of 40 (20 subjects, 2 runs each) distributions was skewed to the right.
Activation Volume
The activation volume measure used in the following analyses was the number of voxels which passed the above-mentioned activation threshold and were within the subject-specific structurally based ROI mask
Average time-to-peak and Average time-to-trough
To assess potential temporal shifts in the IRFs due to either diagnosis or smoking status, the average time-to-peak and the average time-to-trough were estimated for each run for each subject. For all voxels in each visual cortex ROI, the time-to-peak (time of maximum value between 5 and 13 sec) and the time-to-trough (time of minimum value between 21- 29 sec) was identified. Then, for each run, an average time-to-peak and an average time-to-trough were calculated across all voxels in the ROI.
Statistical Analysis
The data consisted of 4 measures per run (median percent signal change, activation volume, average time-to-peak, and average time-to-trough) for 2 runs per subject for 4 subject groups: Control Non-Smokers (n=4), control Heavy Smokers (n=4), Patient Non-Smokers (n=6) and Patient Heavy Smokers (n=6). All 4 measures were then tested in a mixed model ANCOVA (Proc Mixed, SAS, Cary, NC) with diagnosis, smoking status, and diagnosis-by-smoking-status as fixed effects and “runs” modeled as a random effect. Age was included as a covariate in all models because of the documented influence of this variable in prior studies (Fischer et al, 2005; Hesselman et al, 2001; Huettel et al, 2001; Kwee and Nakada, 2003; Lamar et al, 2004; Ross et al, 1997; Zarahn et al, 2006). The analysis included separate within-cell variance estimates for each of the four cells. Random components were fit with the restricted maximum likelihood (REML) technique. Degrees of freedom were estimated using the Kenward-Rogers technique described in the SAS documentation.
In addition, the run-to-run reliability was also estimated. For each of the four measures, the variance-due-to-subject (all 20 subjects included), variance-due-to-run and residual variance were estimated (SAS Proc Varcomp). The intraclass correlation coefficient ICC(1,1) was employed to evaluate the run-to-run reliability (Shrout and Fleiss, 1979; Friedman et al., 2007).
Results for the Visual Activation Task
Median Percent Signal Change
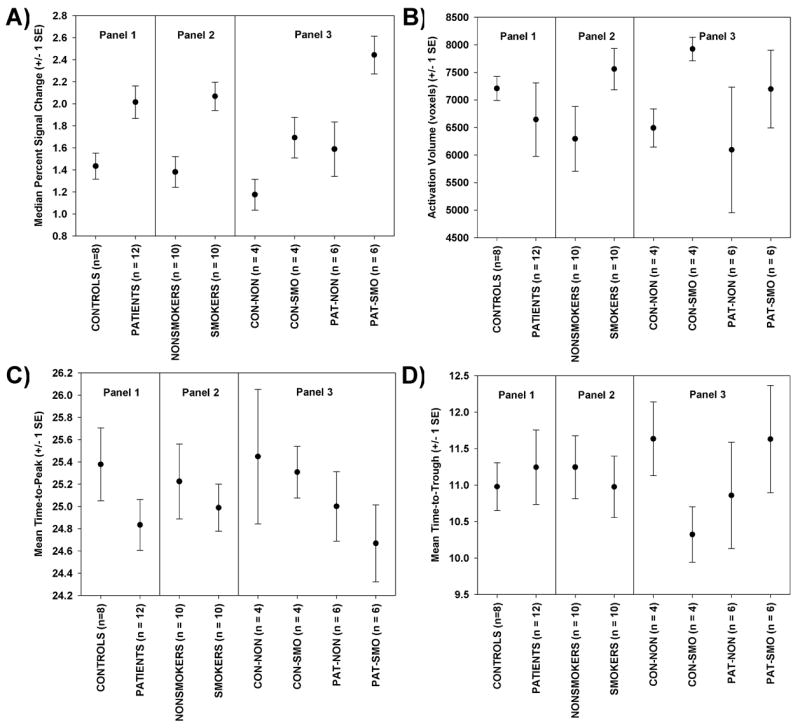
The ANCOVA table for median percent signal change is presented in Table 2. There was a statistically significant effect of smoking status on median percent signal change, which is further illustrated in Figure 3A. There was no significant effect of diagnosis, and the diagnosis-by-smoking status interaction was also not statistically significant. From Figure 3A we can see that the smoking groups had an elevated response. The elevation due to smoking appears to be somewhat larger in patients than controls. In control subjects, the smoking group had a 13.4% elevated response, and, in patient subjects, the smoking group had a 31.3% elevated response, when compared to the respective non-smoking subjects. The mean percent elevation due to smoking was 22.0%. As noted above, the median percent signal change was based on the median of voxel values in an ROI. Table 2 also includes the results for the less appropriate but more familiar mean of voxels. Median percent signal change (averaged across runs) was not correlated with pack years (Pearson r = 0.11, df = 8, p = 0.76).
Table 2.
ANCOVA Results for the Visual Activation Task
| Median Percent Signal Change | |||
|---|---|---|---|
| Effect | df | F-Value | ProbF |
| Age | 1, 24.9 | 2.18 | 0.1525 |
| Dx | 1, 28.1 | 0.03 | 0.8697 |
| SMOK | 1, 27.9 | 15.49 | 0.0005 |
| Dx*SMOK | 1, 27.3 | 2.20 | 0.1499 |
| Mean Percent Signal Change | |||
| Effect | df | F-Value | ProbF |
| Age | 1, 18.6 | 5.51 | 0.0301 |
| Dx | 1, 19.5 | 0.02 | 0.8983 |
| SMOK | 1, 19.3 | 5.30 | 0.0326 |
| Dx*SMOK | 1, 18.9 | 3.22 | 0.0889 |
| Activation Volume in Voxels | |||
| Effect | df | F-Value | ProbF |
| Age | 1, 17.8 | 0.73 | 0.4048 |
| Dx | 1, 28.0 | 0.23 | 0.6322 |
| SMOK | 1, 27.8 | 4.62 | 0.0405 |
| Dx*SMOK | 1, 27.2 | 0.51 | 0.4818 |
| Mean Time to Peak | |||
| Effect | df | F-Value | ProbF |
| Age | 1, 24.4 | 0.28 | 0.5994 |
| Dx | 1, 28.6 | 0.43 | 0.5182 |
| SMOK | 1, 28.4 | 3.57 | 0.0692 |
| Dx*SMOK | 1, 27.9 | 12.71 | 0.0013 |
| Mean Time to Trough | |||
| Effect | df | F-Value | ProbF |
| Age | 1, 20.4 | 0.08 | 0.7809 |
| Dx | 1, 28.5 | 0.14 | 0.7071 |
| SMOK | 1, 28.3 | 14.98 | 0.0006 |
| Dx*SMOK | 1, 27.7 | 1.62 | 0.2138 |
Figure 3.

For the visual activation task, plots of means and standard errors for the four key measures, displayed in 3 panels: by diagnosis (Panel 1), by smoking group (Panel 2), and for all four groups (Panel 3). (A) Median percent signal change, (B) activation Volume, (C) time to peak, and (D) time to trough.
Activation Volume
The ANCOVA table for activation volume is presented in Table 2. There was a statistically significant effect of smoking status on activation volume, but none of the other factors were statistically significant. The results are plotted in Figure 3B. Non-smokers had larger activation volumes than smokers. For control subjects, there was a 39.7% reduction in activation volume in smokers, and for patients, there was a 24% reduction. Overall, there was a mean reduction of 32.5% in activation volume in smokers compared to non-smoking subjects.
Mean Time-to-peak
The ANCOVA table for average time-to-peak is presented in Table 2, and the means are plotted in Figure 3C. There was a statistically significant interaction between diagnosis and smoking status. Post-hoc pair wise group tests, controlled for multiple comparisons (Tukey-Honestly Significant Difference test) revealed only 1 significant difference: patients who had smoked had a delayed response compared to patients who had not smoked (p = 0.0021). The average time-to-peak for patient non-smokers was 8.4 sec and the average time-to-peak for patient smokers was 10.13 sec, a 20.1% increase. While not significant in post-hoc testing (p = 0.052), it is important to note that the patient non-smokers had the shortest time-to-peak of any group, and in particular, showed a shorter time-to-peak than the control non-smokers, whose average time to peak was 9.8 sec. Thus, the interaction effect was likely attributable to both a fast time-to-peak in the patient non-smokers and a delayed time-to-peak in the patient smokers, relative to the control group pattern.
Mean Time-to-trough
The ANCOVA table for average time-to-trough is presented in Table 2, and the means are plotted in Figure 3D. There was a statistically significant effect of smoking status, but no effect of diagnosis and no effect of the interaction. The average time-to-trough for non-smokers was 25.5 sec and the average time-to-trough for smokers was 26.6 sec, a 4.3% increase.
Run-To-Run Reliability
The variance due to run, variance due to subject and residual variance are presented in Table 3. Variance due to run was estimated as 0.0 for median percent signal change and activation volume, and was a small percentage of total variance for time-to-peak (3.4%) and time to trough (8.9%). The run-to-run intraclass correlation coefficients [ICC(1,1)] for median percent signal change and activation volume were in the excellent range (above 0.75 in the nomenclature of Cichetti and Sparrow, 1981), and the ICC for time-to-peak was in the good range (0.6 to 0.74), whereas the ICC for time-to-trough was poor.
Table 3.
Run-to-run Reliability Assessment
| Measure | Variance due to Run | Variance due to Subject | Residual Variance | Total Variance | ICC(1,1) | Qualitative Reliability Category |
|---|---|---|---|---|---|---|
| median percent signal change | 0.000 | 0.057 | 0.018 | 0.076 | 0.76 | Excellent |
| Activation Volume | 0.000 | 52467 | 10465 | 62932 | 0.83 | Excellent |
| Time to Peak | 0.045 | 0.857 | 0.432 | 1.334 | 0.64 | Good |
| Time to Trough | 0.103 | 0.414 | 0.639 | 1.156 | 0.36 | Poor |
Specific Methods for the Breath-Hold Task
Breath-Hold (BH) Task
The task consisted of a block design with alternating on/off blocks of 16 second periods of breath holding and normal breathing. During the off-block, subjects saw a green screen during which they were to breathe normally. During the last two seconds of the off-block, the screen became yellow, which indicated that the subject should take a deep breath in and hold it. During the on-block (16 seconds), subjects saw a red screen, during which time they were instructed to hold their breath. Subjects resumed breathing when a green colored screen was presented. There were 15 total blocks of 16 s each. The task required the collection of 120 sequential volumes (240 sec). Only a single run of this task was collected per subject.
Head Motion
In order to address the specific concern regarding head motion during the BH Task, the following parameters were saved during the motion correction phase of image preprocessing: average head displacement (from volume to volume, in mm), and the standard motion correction parameters (three translations and three rotations).
Cortical Gray Matter ROIs
The first step was to create a functional ROI for each subject for the BH task. The FIR-Deconvolution method of FMRISTAT estimates a beta-weight (and its standard deviation) for each time period. To determine which regions were activated by the task, the beta-weights for the five time points from 7 to 15 seconds (when the breath hold signal should be in a trough, see Figure 4) were contrasted with the five time points from 21 to 29 seconds (when the breath hold signal should be in a peak) using Multistat. Multistat produces a t-value for the contrast among beta-weights, and brain areas were considered activated when the p-value associated with this t-value was <0.01. Only positive t-value regions were included. These maps of statistically significant voxels were further masked to include only voxels in the cortical gray matter by employing a subject-specific, structurally based gray matter ROI mask.
Figure 4.
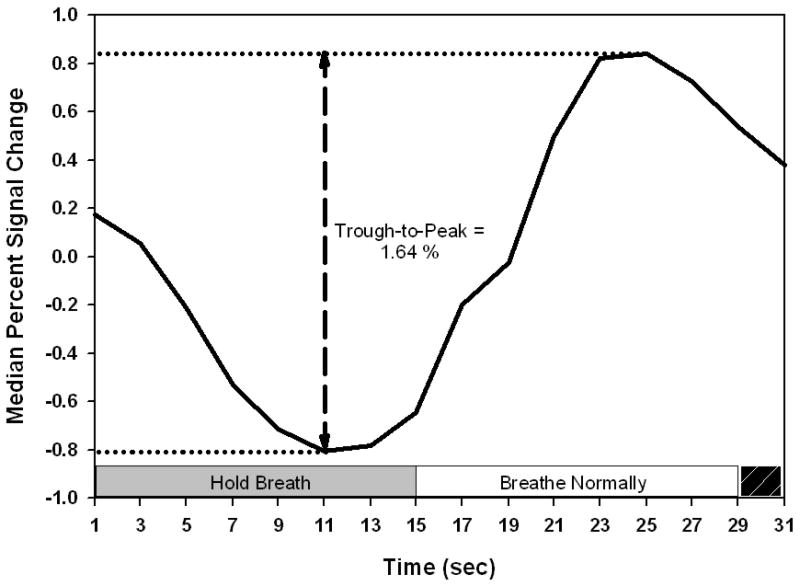
Illustration of the BOLD breath hold response and the median percent signal change (trough-to-peak) measurement. The breath holding period and the normal breathing period are indicated. The black stripped box in the lower right of this figure indicates the time when the subject was to inhale and prepare for the breath holding period. The IRF in this figure is the average of the six patient smokers.
Subject-specific, structurally based gray matter (GM) ROIs were constructed from left and right cortical ribbons produced as part of the Freesurfer analysis. This mask was aligned to MNI space and resampled to match the nominal voxel size of the functional data. Examples of three representative ROIs are presented in Figure 5. Below, we refer to these final functionally and anatomically defined ROIs as the Cortical GM ROI.
Figure 5.
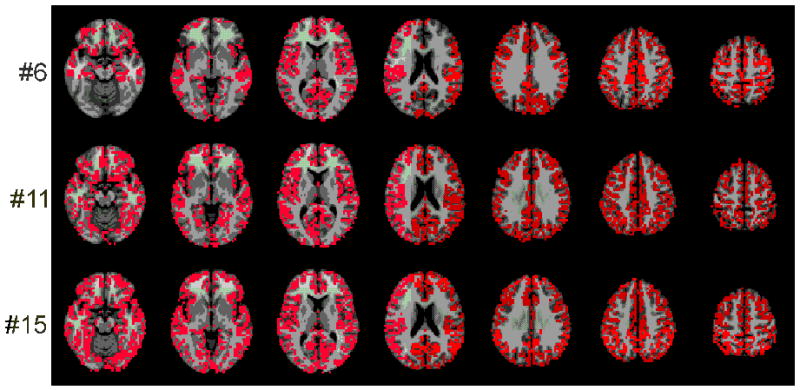
Three (of 20 total) representative ROIs for the breath hold task, chosen to show the range of ROI sizes. The voxels in the ROIs are shown in red. There were 20 subjects, with 1 ROI per subject. These 20 ROIs were rank ordered by size. The figure presents the 6th, the 11st and the 15th ROIs in this list. These are approximately the 25th, 50th and 75th percentiles, respectively.
Creating the Median Percent signal change Measure
The percent signal change associated with breath hold was taken by finding the maximal value among the 5 time points from 21 to 29 seconds post-stimulus onset and subtracting the minimal value for time points from 7 to 15 seconds for each voxel in the cortical GM ROI. The median percent signal change in each ROI was taken as the representative value for each ROI after it was determined that the distributions of percent signal change values in each ROI were typically quite skewed to the left (median skew: 3.69; interquartile range: 3.36 to 4.62).
Activation volume
The activation volume measure used in the following analyses was the number of activated voxels in the cortical GM ROI for each subject using the probability threshold of p<0.01, as described above.
Average time to Peak and Average time to Trough
To assess potential temporal shifts in the IRFs due to either diagnosis or smoking status, the average time to peak and the average time to trough were estimated for each subject. For all voxels in each cortical GM ROI, the time to peak (time of maximum value between 21 and 29 sec) and the time to trough (time of minimum value between 7 to 15 sec) were calculated. Then an average time to peak and an average time to trough were obtained across all voxels in the cortical GM ROI.
Results for the Breath-Hold Task
Median Percent Signal Change
The ANCOVA table for median percent signal change is presented in Table 4. There was a statistically significant decline in median percent signal change with age. The slopes and intercepts were similar in the smoking and non-smoking groups (slopes: 0.06 and 0.05; intercepts: 4.86 and 3.39, respectively). Both main effects (smoking status and diagnosis) were statistically significant (Table 4 and Figure 6A). From Figure 6A we can see that smokers had an elevated response and patients had an elevated response. The interaction between smoking status and diagnosis was not statistically significant (Table 4). These main effects were very large: the increased response due to smoking appears was 49.7 % and the increased response due to being a patient was 40.6%. Median percent signal change was not correlated with pack years (Pearson r = 0.04; df = 1, 8; p = 0.91).
Table 4.
ANCOVA Results for the Breath-Hold Task
| Median Percent Signal Change | |||
|---|---|---|---|
| Effect | df | F-Value | ProbF |
| Age | 1, 10.0 | 8.16 | 0.017 |
| Dx | 1, 14.4 | 8.97 | 0.009 |
| SMOK | 1, 14.3 | 12.75 | 0.003 |
| Dx*SMOK | 1, 14.2 | 0.81 | 0.383 |
| Mean Percent Signal Change | |||
| Effect | df | F-Value | ProbF |
| Age | 1, 8.5 | 5.77 | 0.0411 |
| Dx | 1, 13.6 | 8.27 | 0.0125 |
| SMOK | 1, 13.5 | 9.87 | 0.0075 |
| Dx*SMOK | 1, 13.3 | 0.34 | 0.5719 |
| Activation Volume | |||
| Effect | df | F-Value | ProbF |
| Age | 1, 10.1 | 1.86 | 0.203 |
| Dx | 1, 09.6 | 3.21 | 0.105 |
| SMOK | 1, 09.7 | 0.62 | 0.448 |
| Dx*SMOK | 1, 09.4 | 0.06 | 0.818 |
| Mean Time to Peak | |||
| Effect | df | F-Value | ProbF |
| Age | 1, 10.7 | 0.12 | 0.7366 |
| Dx | 1, 07.9 | 0.34 | 0.5740 |
| SMOK | 1, 08.0 | 1.81 | 0.2157 |
| Dx*SMOK | 1, 07.7 | 0.06 | 0.8137 |
| Mean Time to Trough | |||
| Effect | df | F-Value | ProbF |
| Age | 1, 12.7 | 0.26 | 0.6177 |
| Dx | 1, 13.7 | 0.19 | 0.6682 |
| SMOK | 1, 13.7 | 0.18 | 0.6774 |
| Dx*SMOK | 1, 13.8 | 3.05 | 0.1029 |
Figure 6.
For the BH task, plots of means and standard errors for the four key measures, displayed in 3 panels: by diagnosis (Panel 1), by smoking group (Panel 2), and for all four groups (Panel 3). (A) Median percent signal change, (B) activation Volume, (C) Time to Peak, and (D) time to trough.
Activation volume, Average Time to Peak, and Average Time to Trough
The ANCOVA table for these measures is presented in Table 4 and means are plotted in Figures 6B, 6C and 6D respectively. No statistically significant results were noted (Table 4). A nearly statistically significant (p = 0.105) effect for smokers to have larger activation volumes is evident in Figure 7B. The nearly statistically significant (p = 0.103) interaction between diagnosis and smoking status for time-to-trough is illustrated in Figure 6D. Control smokers have a shorter time-to-trough than control-nonsmokers, but patient smokers have a longer time-to-trough than patient non-smokers. Non-significant results based on these small sample sizes do not rule out true differences -- we are operating with low power.
Figure 7.
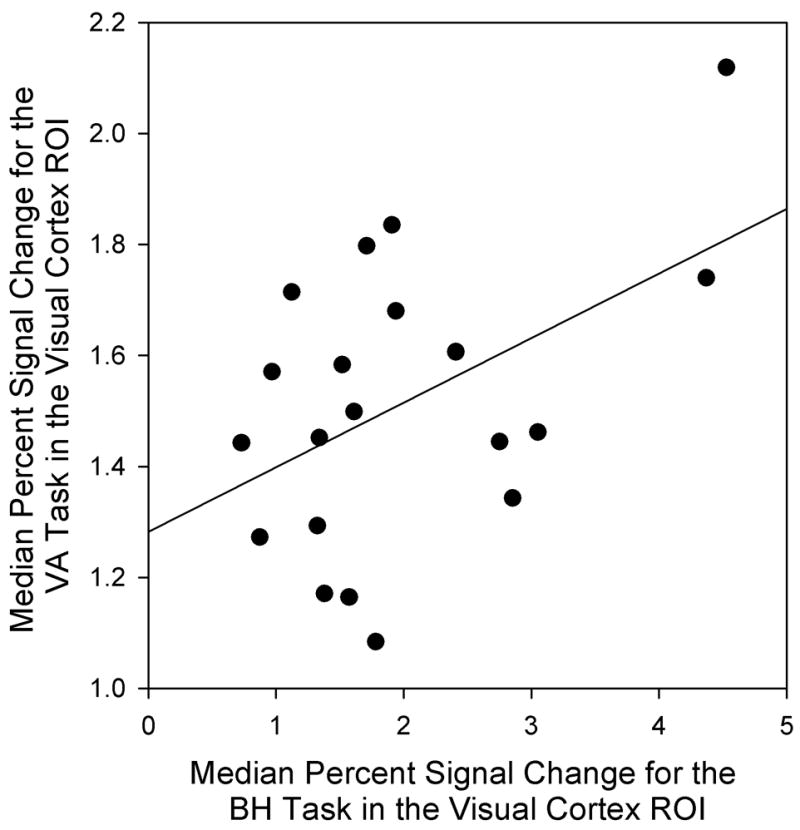
Scatterplot relating median percent signal change for the VA task to median percent signal change for the breath hold task in the visual cortex ROI.
Head Motion
Patients produced an elevated average head displacement compared to control subjects (Wilcoxon Two-Sample test, p = 0.035, one-tailed), and smokers produced an elevated average head displacement compared to non-smokers (Wilcoxon Two-Sample test, p = 0.027, one-tailed).
Head motion during the BH task was highly correlated with signal change. For example, the average head pitch rotation across all subjects during this task resembled boxcar reference vector for the task -- the oscillatory signal was at the same frequency and timing as the BH task2. Average head displacement was significantly related to median percent signal change when it was the sole predictor in the model (r = 0.43, df = 18, p = 0.03, one-tailed). When this measure was included as a covariate in our ANCOVA test of the effect of diagnosis and smoking-status on median percent signal change, it was not a statistically significant covariate (Table 5). The age effect was changed only slightly and the smoking and diagnosis effects were weaker, but all remained statistically significant. Therefore, the inclusion of average head displacement in the model did not alter the substantive results.
Table 5.
The Impact of Including Average Head Displacement in the ANCOVA Model for Median Percent Signal Change (BH Task).
| Average Head Displacement not in Model | |||
|---|---|---|---|
| Effect | Df | FValue | ProbF |
| Age | 1, 10.0 | 8.16 | 0.017 |
| Dx | 1, 14.4 | 8.97 | 0.009 |
| SMOK | 1, 14.3 | 12.75 | 0.003 |
| Dx*SMOK | 1, 14.2 | 0.81 | 0.383 |
|
| |||
| Average Head Displacement in Model | |||
| Effect | Df | FValue | ProbF |
| Avg. Head Displacement | 1, 9.1 | 0.14 | 0.715 |
| Age | 1, 7.6 | 8.70 | 0.020 |
| Dx | 1, 12.2 | 6.98 | 0.021 |
| SMOK | 1, 12.1 | 8.59 | 0.013 |
| Dx*SMOK | 1, 11.8 | 0.77 | 0.399 |
We also attempted to match the groups on head displacement by removing subjects and repeating the original ANCOVA model for median percent signal change. To match patients and controls, two patients with an average head displacement greater than 1 mm and two controls with an average head displacement less than 0.27 mm were removed (Wilcoxon Two-Sample test, p = 0.37, one-tailed). To match smokers and non-smokers, two smokers with an average head displacement greater than 1 mm and one non-smoker with an average head displacement less than 0.27 mm were removed (Wilcoxon Two-Sample test, p = 0.20, one-tailed). The ANCOVA results for these 2 matched datasets were substantively identical to the original ANCOVA results. Age, diagnosis and smoking effects were all statistically significant and the diagnosis-by-smoking interaction effect was not statistically significant.
Specific Methods for the Relating the Results of the Visual Activation Task to those from the Breath-Hold Task
Median Percent Signal Change due to the BH Task in the Visual Cortex ROI
In order to relate the response to the BH task to the response to the visual activation task, the BH response was masked by a visual cortex ROI for each subject. Since there were 2 runs of the visual activation task and thus 2 masks, the masks were concatenated (summed) to produce a single visual cortex ROI for purposes of masking the BH percent signal change data. Following Thomason et al (2007) only BH responses that were greater than some threshold (in our case 0.25% signal change) were included in the estimate of median percent signal change in BH in the visual cortex ROI.
Statistical Analysis
The percent signal change from the BH task can be thought of as a measure of cerebrovascular reactivity and the percent signal change from the VA task can be thought of as the magnitude of the BOLD response to sensory activation. Having both in hand, it was of interest to address the relationship between these two measures by answering several questions.
The first question was: What was the relationship between percent signal change during the BH response in gray matter generally and in the visual cortex specifically? This was addressed with regression analyses and a paired t-test. The second question was: What was the relationship between cerebrovascular reactivity and the magnitude of the BOLD response in visual cortex? Regression was used to answer this question. The third question was: Were there diagnosis and smoking-status effects on cerebrovascular reactivity in the visual cortex ROI? This was addressed with the mixed model ANCOVA described above. Since cerebrovascular reactivity in the visual cortex ROI was related to the magnitude of the BOLD response to sensory activation, the latter could be divided into a portion that was predicted by the cerebrovascular reactivity and a residual portion unrelated to cerebrovascular reactivity. Therefore, the fourth question was: Were there diagnosis and smoking-status effects on the predicted and the residual portions of the visual activation results? This was also addressed using the ANCOVA model described above.
Results Regarding the Relationship between the Visual Activation Task and the Breath-Hold Task
Relationship between BH Responses in the Cortical Gray Matter and in the Visual Cortex
BH median percent signal change in gray matter was highly correlated with BH median percent signal change in the visual cortex (Pearson r = 0.94, p < 0.0001). When the BH response in the visual cortex was regressed onto the BH response in visual cortex, the slope was 1.34. BH responses in visual cortex were 11.5% larger than BH responses in gray matter generally (Paired t-test, t = 2.09, df = 19, p = 0.025, one-tailed).
Relationship between BH Responses and Visual Activation Responses
Median percent signal change for the VA task was related to the median percent signal change for the BH task in the visual cortex (Figure 7). The correlation between these two measures was 0.48 (p = 0.03). The BH response accounted for 23% of the variance in the visual activation response. Regressing VA median percent signal change onto the BH value yielded a slope of 0.12 with an intercept of 1.28. Thus, for each 1% increase in median percent signal change for the BH task, the response to the visual activation task would increase 0.12%.
Diagnosis and Smoking Status Effects on BH Percent Signal Change in the Visual Cortex
The ANCOVA table for BH percent signal change in the visual cortex is presented in Table 6. There were statistically significant effect of age, diagnosis and smoking status but the interaction between diagnosis and smoking-status was not statistically significant. The means are plotted in Figure 8A. The main effects were very large: the increased response due to smoking-status was 71.8% and the increased response due to being a patient was 37.1%.
Table 6.
ANCOVA Results for Median Percent Signal Change due to the BH Task in the Visual Cortex ROI
| Percent Signal Change due to BH in VisualCortex ROI | |||
|---|---|---|---|
| Effect | df | F-Value | ProbF |
| Age | 1, 2.7 | 11.69 | 0.0503 |
| Dx | 1, 11.7 | 5.02 | 0.0453 |
| SMOK | 1, 11.6 | 14.46 | 0.0027 |
| Dx*SMOK | 1, 11.3 | 2.09 | 0.1750 |
Figure 8.
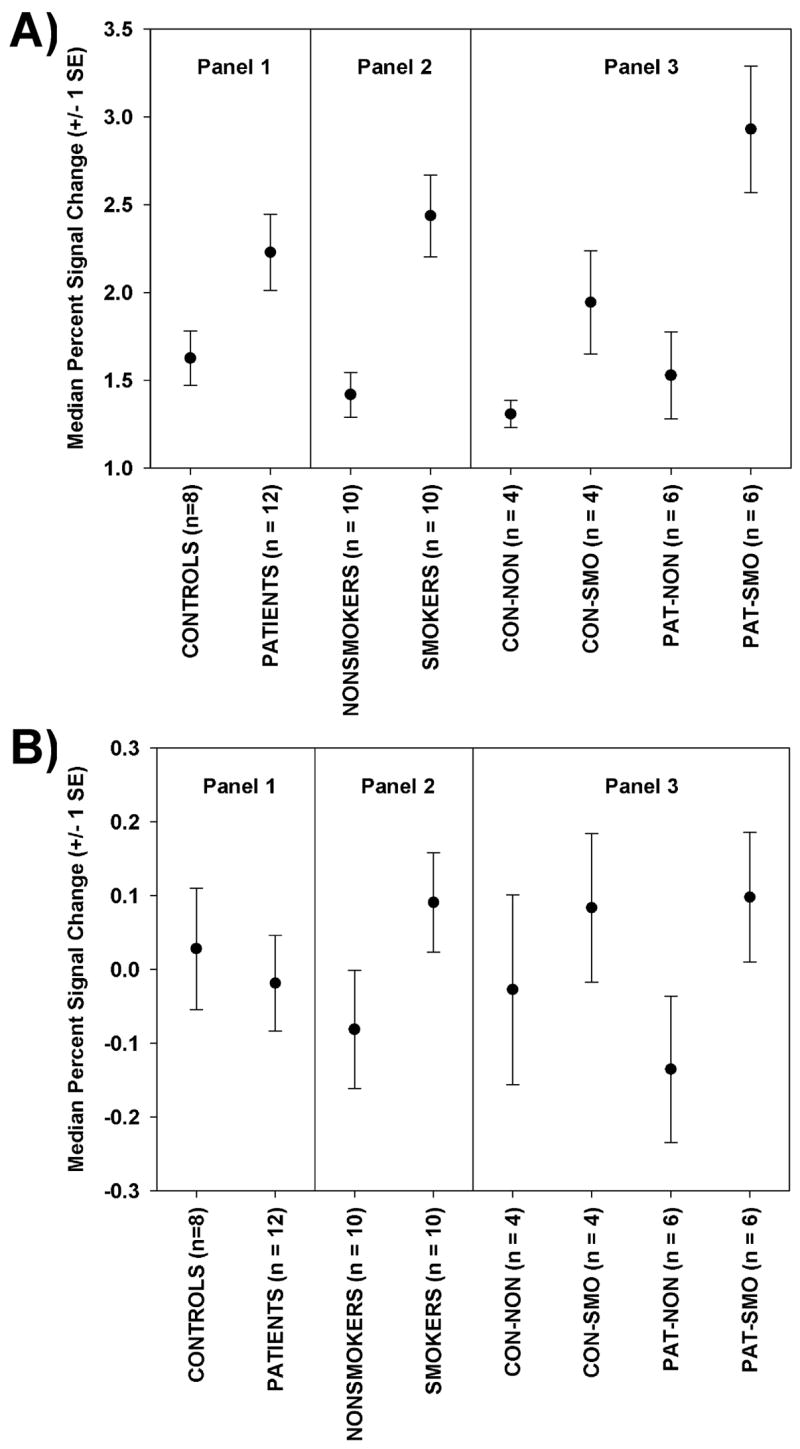
Plots of means and standard errors for: (A) the median percent signal change due to the breath hold task in the visual cortex ROI, and (B) residual median percent signal change after regressing median percent signal change due to the VA task onto the breath hold response in the visual cortex. Data are displayed in 3 panels: by diagnosis (Panel 1), by smoking group (Panel 2), and for all four groups (Panel 3)./
Diagnosis and Smoking Status Effects on the Portion of Percent Signal Change for Visual Activation Task Predicted by BH responses in the Visual Cortex
Since the predicted responses are simply linear transformations of the BH responses, and since ANCOVA results are invariant to linear transformation, the ANCOVA results for the predicted responses are identical to the ANCOVA results presented in Table 6. The pattern of the means are thus identical to that plotted in Figure 8A but the scaling would differ, reflecting smaller percent signal change values in response to the visual activation task than the BH task.
Diagnosis and Smoking Status Effects on the Portion of Percent Signal Change for Visual Activation Task Not Predicted by BH responses in the Visual Cortex
The ANCOVA results for the residuals are presented in Table 7 and the means are plotted in Figure 8B. There were no statistically significant effects.
Table 7.
ANCOVA Results for Residual Median Percent Signal Change due to the Visual Activation Task after Controlling for the BH Percent Signal Change the Visual Cortex ROI
| Residual Median Percent Signal Change | |||
|---|---|---|---|
| Effect | df | F-Value | ProbF |
| Age | 1, 10.1 | 0.05 | 0.8230 |
| Dx | 1, 12.3 | 0.19 | 0.6691 |
| SMOK | 1, 12.2 | 2.63 | 0.1305 |
| Dx*SMOK | 1, 12.0 | 0.35 | 0.5673 |
Discussion of Visual Activation Results
We report a statistically significant elevation of the BOLD response in heavy smokers to a simple visual activation task in healthy controls and patients with schizophrenia. Smokers had a mean 22% elevation in median percent signal change in visual cortex ROIs, a mean reduction in activation volume of 33%, and a 4.3% increase in the time of the IRF trough (a delay). We also report a 20% mean delay in the time-to-peak of the IRF in patient smokers compared to patient non-smokers. However, the sample size in the present study was small and our results need to be replicated in a larger sample before firm conclusions can be drawn.
The elevation of response to visual activation in heavy smokers has not been reported before, to our knowledge. At first glance, an increased response to a pathological state (heavy smoking) appears anomalous. One possible explanation is related to hematocrit, which is elevated in heavy smokers (Whitehead et al, 1995), as is blood viscosity (Lowe et al, 1980). Increased hematocrit has been associated with elevated BOLD responses (Levin et al, 2001; Gustard et al, 2003).
Our hypothesis, stimulated by that of Gustard et al (2003), is that increased blood viscosity in smokers is associated with decreased blood flow in the baseline state. It is known that smokers have reduced cerebral blood flow (CBF) (Rogers et al, 1984; Isaka et al, 1993). Decreased CBF should also increase oxygen extraction during capillary transit. Thus, in the baseline state, we hypothesize that smokers have a lowered rCBF and an elevated deoxyhemoglobin (dHb) level in venules (Lu et al, 2007). Both conditions have been associated with an increased BOLD percent signal change during visual stimulation (Lu et al, 2007; Cohen et al, 2002; Behzadi and Liu, 2005).
Another hypothesis is that prolonged exposure to nicotine can promote angiogenesis and arteriogenesis (Cooke, 2004). Although this has been documented in animals, it has yet to be documented in human brain. If it is shown that heavy smokers have an increased capillary density in the brain, this finding might indeed have important implications for fMRI in smokers -- the intrinsic signal in the blood is more than an order of magnitude larger than the extravascular signal (Buxton, 2002). Xu et al (2007) also reported an signal increase in abstinent smokers compared to non-smokers. Subjects performed the Stroop, a classic cognitive interference task. The signal increase was noted in the frontal eye fields resulting from the contrast between the incongruent stimuli minus the congruent stimuli.
Xu et al (2007) suggest that this brain area is critically involved in attention. They further hypothesize that their results reflect the fact that the inhibitory function of the right FEF may be compromised in abstinent smokers. Thus, Xu et al (2007) explain their results in terms of cognitive differences in smokers. There is evidence for reduced cognitive performance in chronic smokers [see Durazzo and Meyerhoff, (2007) for review], and certainly such effects could account for fMRI differences, including the increased BOLD percent signal change noted in the present study. Our simple visual activation paradigm placed less demands on the resources of our subjects, but some degree of attention, vigilance and sensorimotor coordination are involved. In the present study, there was no significant diagnosis effect, which means that patients with schizophrenia, who have impaired attention, vigilance and motor function (Braff, 1993; Suslow, 1996; Wolff and O’Driscoll, 1999,) had BOLD responses similar to controls. This finding is consistent with the notion that the cognitive demands of our task are minimal. Moreover, our hypothesis based on reduced CBF in smokers would also explain the findings of Xu et al (2007).
Lawrence et al (2002) found that abstinent smokers showed hypoactivity in the parietal cortex and caudate compared to non-smokers during performance of a visual vigilance task designed to maximize attentional demands. There was a trend toward lower performance in smokers than non-smokers, which may explain the reduced activation.
The reduction of activation volume in smokers is probably related to increased physiological noise in this group. Several papers have emphasized the key role of SNR as the determining factor in activation size (Saad et al., 2003; Huettel and McCarthy, 2001). Activation volume is defined by the number of statistically significant voxels. We report a statistically significant increase in percent signal change with smoking. So the only path to decreased activation volume in smokers would be to have a marked increase in physiological noise. The nature of this increase in physiological noise is unknown. Of course it is also possible that less brain tissue is involved in this simple visual perception task in smokers.
This is the first report of timing delays in the time-to-peak (patients only) and the time-to-trough in smokers. Time-to-peak was slower in patients who smoked but not in patients who did not smoke, although in controls, smoking status had no significant effect. Since it is probable that both smoking groups have reduced CBF due to smoking, lower CBF does not seem an explanation for this finding. Ford et al (2005) reported a slowing of the hemodynamic response in patients with schizophrenia, and suggested that this could be related to a more sluggish neuronal response, neurovascular coupling or primary abnormalities in the cerebral vasculature. However these authors did not mention the smoking status of their patients. It seems likely that most of the patients were smokers and most of the controls were not, so the report of a delay in the IRF in Ford et al (2005) may simply reflect smoking history. As noted by Ford et al (2005), one obvious difference between patients and controls, aside from the presence of a mental disorder, is that the patients were all receiving antipsychotic medications. Perhaps some interaction between antipsychotic medications and smoking-status is responsible for this delay.
The finding of an increased time-to-trough in both smoking groups might be explained by reduced CBF. A reduction in CBF should translate into an increased transit time (assuming no blood volume changes), and according to Friston et al (2000), this would slow down the dynamics of the BOLD signal and produce a delayed IRF [see Cohen et al (2002) for a discussion of this issue]. However, two brief within-subject CBF-lowering manipulations [hypocapnia (Cohen et al, 2002), caffeine (Liu et al, 2004)] have been associated with a reduced time-to-trough. On the other hand, patients with chronically lower CBF due to arterial stenosis (primarily left internal and middle cerebral arteries) did show a slower time to return to baseline after the peak response despite comparable behavioral performance to control subjects (Roc et al., 2006). Further research is needed to clarify the basis for the timing delays noted in smokers in the present study.
It must be said that chronic smoking has many deleterious consequences on brain health, as reviewed in Durazzo and Meyerhoff (2007). These authors review evidence for changes in brain structure, metabolism and neurotransmitter levels. Further studies attempting to sort out the role of physiological (hematocrit, blood flow, venous oxygenation, capillary density), cognitive, structural, metabolic and neurochemical influences are certainly warranted.
It is our impression that smoking history is ignored in fMRI studies of schizophrenia. To test this, we conducted a Medline search of all studies conducted in the last year (date of search: 7/10/2007) that had both the word “schizophrenia” and the word “FMRI” in the title. Of the 16 references (Bedwell et al, 2006; Eyler et al, 2007; Harrison et al, 2007; Karlsgodt et al, 2007; Lepage et al, 2006; Li et al, 2007; Liddle et al, 2006; Marjoram et al, 2006; Nagel et al, 2007; Schlosser et al, 2007; Schneider et al, 2007; Thermenos et al, 2007; Tu et al, 2006; Walter et al, 2007; Whyte et al, 2006; Yoon et al, 2006) none had the partial word “smok” or the word “tobacco” or the word “cigarette” anywhere in the text. Although these and many other studies report decreases, increases and no change in BOLD-related activation measures in relation to schizophrenia (Kindermann et al, 1997; Tost et al, 2005) the results of all such studies are likely to be biased due to the increased incidence of smoking in this patient population. If our findings are confirmed, future studies of fMRI in schizophrenia (and other mental illnesses) may need to take smoking history into account.
Of course nations differ in the degree of smoking in the population generally. At least two-thirds of all Chinese men (68%) smoke at least occasionally, and roughly half (49%) are regular smokers, according to the 2004 Gallup Poll of China (http://www.gallup.com/poll/15265/Smoking-Could-Ignite-Health-Crisis-China.aspx). European countries also have smoking rates higher than those noted for the United States (http://www.gallup.com/poll/28432/Smoking-Rates-Around-World-How-Americans-Compare.aspx). So the contrast between smoking rates in patients and controls will be nation-specific.
In conclusion, we report that subjects who had a history of heavy smoking had an elevated BOLD percent signal change to a simple visual activation task, when compared to subjects who had not smoked. Also, patients with schizophrenia who had a heavy smoking history had a delayed hemodynamic response (time-to-peak), and both controls and patients with a heavy smoking history had a delayed time-to-trough. Several mechanisms to explain these results are offered. For the increased percent signal change in smokers, we presented a hypothesis based on resting state cerebrovascular physiology. Heavy smokers have increased hematocrit, blood viscosity and reduced baseline rCBF in the baseline state. Such conditions have been associated with an increased BOLD percent signal change. Studies comparing the role of cerebrovascular and hemodynamic factors to anatomical, neurochemical and cognitive factors are warranted. This report is based on a small sample, and replication is required before firm conclusions can be drawn. If confirmed, the findings will have important implications for fMRI studies of schizophrenia. The observed effects suggest that the literature on fMRI in schizophrenia is likely to be biased (at least in the USA), since few if any fMRI studies consider smoking effects.
Discussion of Breath Hold Results
In the present study, we report 2 main observations related to BH-induced BOLD responses in gray matter: (1) breath hold responses in cortical GM are increased in heavy smokers by about 50%; (3) breath hold responses in cortical GM are increased in patients with schizophrenia by about 40%.
The potential role of head motion is difficult to conclusively evaluate with these data. Average head displacement was increased in patients compared to controls and was increased in smokers compared to non-smokers. Moreover, the head motion correction parameters were often very highly correlated with the expected signal response to the BH task. Therefore, it is possible that the substantive effects noted for diagnosis and for smoking status may simply reflect increased head motion. This implies that head motion can cause MR signal changes like those observed – an as yet unproven proposition. We controlled for average head displacement in two ways: (1) including average head displacement in the ANCOVA model; and (2) matching the subject groups on average head displacement by removing subjects. With both methods, the substantive results remained. These findings are not consistent with an important role for head motion in explaining our main results, but such procedures may not allay the concern entirely. The extent to which BH results are a reflection of cerebrovascular reactivity or head motion needs further examination and is beyond the scope of the present report. We shall proceed as if our results do not simply reflect head motion differences, but rather, reflect differences in cerebrovascular reactivity.
The finding of an elevation of the BH response in heavy smokers has not been reported before, to our knowledge. It seems counterintuitive that an increased response occurs in a pathological state. The two explanations offered above for the increased response during the visual activation response (increased percent signal change related to decreased baseline blood flow, or nicotine-induced angiogenesis) would apply to the BH responses as well. A third hypothesis has to do with potential differences in breathing behavior. Chen (1988) reported that heavy smokers have increased respiratory muscle strength and shortened respiratory duty cycle (Chen, 1988). Perhaps some aspect of altered breathing behavior is responsible for the present smoking-related effects.
The finding that patients with schizophrenia have an increased BOLD response to the BH has not been reported previously. The finding of an elevated BH response in patients was unrelated to our smoking findings. Patients with schizophrenia have other physical health problems that might be related to the BH response. For example, patients with schizophrenia are at increased risk of cardiovascular disease diabetes, hyerplipidemia, and hypertension (Hennekens et al., 2005; Marder et al., 2004). Perhaps one of these health problems (or their pharmacologic treatment) might explain the increase in the BH response in patients. Since the BH response depends on a number of cardiovascular factors (Thomason et al., 2005), abnormalities in these factors could produce alterations in the response. The presence of this diagnosis effect suggests caution in the use of the BH response as a covariate in studies comparing schizophrenia patients and controls. Employing covariates with different group mean values is fraught with interpretative difficulties (Miller and Chapman 1996).
In conclusion, the BH response in cortical GM is elevated in subjects with a heavy smoking history (~50 % increase), and is elevated in patients with schizophrenia (~40% increase). The marked increase in BOLD BH responses in heavy smokers could be due to the increased hematocrit, blood viscosity and reduced rCBF documented in this group. Other explanations are also offered. The finding of an increased BH response in patients with schizophrenia, regardless of smoking history, is unexpected and needs further study. If replicated, our findings could have implications for the application of the BH calibration procedure in patients with schizophrenia, since most such patients smoke and most healthy control subjects do not smoke.
Discussion of the Relationship between the Visual Activation Results and the Breath Hold Results
We report that percent signal change during the BH task in the visual cortex was larger than percent signal change in gray matter generally, but had a similar pattern of relationships to diagnosis and smoking status. As has been reported previously (Thomason et al., 2007; Handwerker et al., 2007), the BH response was significantly and positively correlated with the response to the visual activation task, accounting for 23% of the variance. The portion of the response to the visual activation task that was not related to cerebrovascular reactivity was not statistically significantly related to either smoking status or diagnosis. This latter finding would appear not to support an important role for neuronal factors in the visual activation results and suggests that both diagnosis and smoking status effects on visual activations could be mediated by cerebrovascular reactivity as measured by the BH task.
Acknowledgments
This research was supported by a grant [#1 U24 RR021992] to the Functional Imaging Biomedical Informatics Research Network (FBIRN, http://www.nbirn.net), that is funded by the National Center for Research Resources (NCRR) at the National Institutes of Health (NIH).
Footnotes
The OFF period was only 16 seconds and, in retrospect, may be a little short in order to quantify the temporal characteristics accurately. The BOLD fMRI response can take 25 to 30 seconds to fully return to baseline (Buxton et al., 1998). Therefore, with a 16s OFF period, the effect of the previous stimulation block may still be present and may affect the next response. This is particularly relevant to the quantification of time-to-peak and time-to-trough, but may also affect the estimated signal amplitude, as the response will now start from a negative range.
Of course, correlation does not prove causation and it is not clear to what extent such head movements can cause the observed EPI signal changes. This issue is under investigation in our laboratory at present and it appears that head movements do not, to an important extent, cause the EPI signal changes noted. Until this causation issue is clear it is probably not appropriate to include motion parameters in our GLM model -- fitting an IRF after removal of most of the task-related variance would produce an IRF that is not meaningful.
Publisher's Disclaimer: This is a PDF file of an unedited manuscript that has been accepted for publication. As a service to our customers we are providing this early version of the manuscript. The manuscript will undergo copyediting, typesetting, and review of the resulting proof before it is published in its final citable form. Please note that during the production process errors may be discovered which could affect the content, and all legal disclaimers that apply to the journal pertain.
References
- Andreasen NC. The Scale for the Assessment of Negative Symptoms (SANS): conceptual and theoretical foundations. Br J Psychiatry. 1989;(Suppl 7):49–58. [PubMed] [Google Scholar]
- Andreasen NC, Flaum M, Swayze VW, 2nd, Tyrrell G, Arndt S. Positive and negative symptoms in schizophrenia. A critical reappraisal. Arch Gen Psychiatry. 1990;47(7):615–21. doi: 10.1001/archpsyc.1990.01810190015002. [DOI] [PubMed] [Google Scholar]
- Astrup P. Carbon monoxide, smoking and atherosclerosis. Postgrad Med J. 1973;49(576):697–706. doi: 10.1136/pgmj.49.576.697. [DOI] [PMC free article] [PubMed] [Google Scholar]
- Bedwell JS, Miller LS, Brown JM, Yanasak NE. Schizophrenia and red light: fMRI evidence for a novel biobehavioral marker. Int J Neurosci. 2006;116(8):881–94. doi: 10.1080/00207450500516529. [DOI] [PubMed] [Google Scholar]
- Behzadi Y, Liu TT. An arteriolar compliance model of the cerebral blood flow response to neural stimulus. Neuroimage. 2005;25(4):1100–11. doi: 10.1016/j.neuroimage.2004.12.057. [DOI] [PubMed] [Google Scholar]
- Braff DL. Information processing and attention dysfunctions in schizophrenia. Schizophr Bull. 1993;19(2):233–59. doi: 10.1093/schbul/19.2.233. [DOI] [PubMed] [Google Scholar]
- Brody AL. Functional brain imaging of tobacco use and dependence. J Psychiatr Res. 2006;40(5):404–18. doi: 10.1016/j.jpsychires.2005.04.012. [DOI] [PMC free article] [PubMed] [Google Scholar]
- Buxton RB. Introduction to Functional Magnetic Resonance Imaging: Principles and Techniques. Cambridge: Camebridge University Press; 2002. p. 523. [Google Scholar]
- Buxton RB, Wong EC, Frank LR. Dynamics of blood flow and oxygenation changes during brain activation: the balloon model. Magn Reson Med. 1998 Jun;39(6):855–64. doi: 10.1002/mrm.1910390602. [DOI] [PubMed] [Google Scholar]
- Chen HI. Effects of chronic smoking on respiratory muscle function. Chin J Physiol. 1988;31(1):53–62. [PubMed] [Google Scholar]
- Cicchetti DV, Sparrow SA. Developing criteria for establishing interrater reliability of specific items: applications to assessment of adaptive behavior. Am J Ment Defic. 1981;86(2):127–37. [PubMed] [Google Scholar]
- Clark KD, Wardrobe-Wong N, Elliott JJ, Gill PT, Tait NP, Snashall PD. Cigarette smoke inhalation and lung damage in smoking volunteers. Eur Respir J. 1998;12(2):395–9. doi: 10.1183/09031936.98.12020395. [DOI] [PubMed] [Google Scholar]
- Cohen ER, Ugurbil K, Kim SG. Effect of basal conditions on the magnitude and dynamics of the blood oxygenation level-dependent fMRI response. J Cereb Blood Flow Metab. 2002;22(9):1042–53. doi: 10.1097/00004647-200209000-00002. [DOI] [PubMed] [Google Scholar]
- Cooke JP, Bitterman H. Nicotine and angiogenesis: a new paradigm for tobacco-related diseases. Ann Med. 2004;36(1):33–40. doi: 10.1080/07853890310017576. [DOI] [PubMed] [Google Scholar]
- Cox RW. AFNI: software for analysis and visualization of functional magnetic resonance neuroimages. Comput Biomed Res. 1996;29(3):162–73. doi: 10.1006/cbmr.1996.0014. [DOI] [PubMed] [Google Scholar]
- de Leon J, Diaz FJ. A meta-analysis of worldwide studies demonstrates an association between schizophrenia and tobacco smoking behaviors. Schizophr Res. 2005;76(2–3):135–57. doi: 10.1016/j.schres.2005.02.010. [DOI] [PubMed] [Google Scholar]
- Duelli R, Staudt R, Grunwald F, Kuschinsky W. Increase of glucose transporter densities (Glut1 and Glut3) during chronic administration of nicotine in rat brain. Brain Res. 1998;782(1–2):36–42. doi: 10.1016/s0006-8993(97)01264-x. [DOI] [PubMed] [Google Scholar]
- Durazzo TC, Meyerhoff DJ. Neurobiological and neurocognitive effects of chronic cigarette smoking and alcoholism. Front Biosci. 2007;12:4079–100. doi: 10.2741/2373. [DOI] [PubMed] [Google Scholar]
- Dursun SM, Kutcher S. Smoking, nicotine and psychiatric disorders: evidence for therapeutic role, controversies and implications for future research. Med Hypotheses. 1999;52(2):101–9. doi: 10.1054/mehy.1997.0623. [DOI] [PubMed] [Google Scholar]
- Eliasson B. Cigarette smoking and diabetes. Prog Cardiovasc Dis. 2003;45(5):405–13. doi: 10.1053/pcad.2003.00103. [DOI] [PubMed] [Google Scholar]
- Eyler LT, Olsen RK, Nayak GV, Mirzakhanian H, Brown GG, Jeste DV. Brain response correlates of decisional capacity in schizophrenia: a preliminary FMRI study. J Neuropsychiatry Clin Neurosci. 2007;19(2):137–44. doi: 10.1176/jnp.2007.19.2.137. [DOI] [PubMed] [Google Scholar]
- First MB, Spitzer RL, Gibbon M, Williams JBW. Structured Clinical Interview for DSM-IV-TR Axis I Disorders- Patient Edition (SCID-I/P, 11/2002 revision) Biometrics Research Department; New York State Psychiatric Institute: 2002. [Google Scholar]
- Fischer H, Sandblom J, Gavazzeni J, Fransson P, Wright CI, Backman L. Age-differential patterns of brain activation during perception of angry faces. Neurosci Lett. 2005;386(2):99–104. doi: 10.1016/j.neulet.2005.06.002. [DOI] [PubMed] [Google Scholar]
- Ford JM, Johnson MB, Whitfield SL, Faustman WO, Mathalon DH. Delayed hemodynamic responses in schizophrenia. Neuroimage. 2005;26(3):922–31. doi: 10.1016/j.neuroimage.2005.03.001. [DOI] [PubMed] [Google Scholar]
- Friedman L, Stern H, Brown GG, Mathalon DH, Turner J, Glover GH, Gollub RL, Lauriello J, Lim KO, Cannon T, Greve DN, Bockholt HJ, Belger A, Mueller B, Doty MJ, He J, Wells W, Smyth P, Pieper S, Kim S, Kubicki M, Vangel M, Potkin SG. Test-retest and between-site reliability in a multicenter fMRI study. Hum Brain Mapp. 2007 doi: 10.1002/hbm.20440. Epub. [DOI] [PMC free article] [PubMed] [Google Scholar]
- Friston KJ, Mechelli A, Turner R, Price CJ. Nonlinear responses in fMRI: the Balloon model, Volterra kernels, and other hemodynamics. Neuroimage. 2000;12(4):466–77. doi: 10.1006/nimg.2000.0630. [DOI] [PubMed] [Google Scholar]
- Gustard S, Williams EJ, Hall LD, Pickard JD, Carpenter TA. Influence of baseline hematocrit on between-subject BOLD signal change using gradient echo and asymmetric spin echo EPI. Magn Reson Imaging. 2003;21(6):599–607. doi: 10.1016/s0730-725x(03)00083-3. [DOI] [PubMed] [Google Scholar]
- Hamzei F, Knab R, Weiller C, Rother J. The influence of extra- and intracranial artery disease on the BOLD signal in FMRI. Neuroimage. 2003;20(2):1393–9. doi: 10.1016/S1053-8119(03)00384-7. [DOI] [PubMed] [Google Scholar]
- Handwerker DA, Gazzaley A, Inglis BA, D’Esposito M. Reducing vascular variability of fMRI data across aging populations using a breathholding task. Hum Brain Mapp. 2007;28(9):846–59. doi: 10.1002/hbm.20307. [DOI] [PMC free article] [PubMed] [Google Scholar]
- Harrison BJ, Yucel M, Pujol J, Pantelis C. Task-induced deactivation of midline cortical regions in schizophrenia assessed with fMRI. Schizophr Res. 2007;91(1–3):82–6. doi: 10.1016/j.schres.2006.12.027. [DOI] [PubMed] [Google Scholar]
- Hennekens CH, Hennekens AR, Hollar D, Casey DE. Schizophrenia and increased risks of cardiovascular disease. Am Heart J. 2005;150(6):1115–21. doi: 10.1016/j.ahj.2005.02.007. [DOI] [PubMed] [Google Scholar]
- Hesselmann V, Zaro Weber O, Wedekind C, Krings T, Schulte O, Kugel H, Krug B, Klug N, Lackner KJ. Age related signal decrease in functional magnetic resonance imaging during motor stimulation in humans. Neurosci Lett. 2001;308(3):141–4. doi: 10.1016/s0304-3940(01)01920-6. [DOI] [PubMed] [Google Scholar]
- Huettel SA, McCarthy G. The effects of single-trial averaging upon the spatial extent of fMRI activation. Neuroreport. 2001;12(11):2411–6. doi: 10.1097/00001756-200108080-00025. [DOI] [PubMed] [Google Scholar]
- Huettel SA, Singerman JD, McCarthy G. The effects of aging upon the hemodynamic response measured by functional MRI. Neuroimage. 2001;13(1):161–75. doi: 10.1006/nimg.2000.0675. [DOI] [PubMed] [Google Scholar]
- Isager H, Hagerup L. Relationship between cigarette smoking and high packed cell volume and haemoglobin levels. Scand J Haematol. 1971;8(4):241–4. doi: 10.1111/j.1600-0609.1971.tb00870.x. [DOI] [PubMed] [Google Scholar]
- Isaka Y, Ashida K, Imaizumi M, Abe H. Effect of chronic smoking on regional cerebral blood flow in asymptomatic individuals. Yakubutsu Seishin Kodo. 1993;13(3):191–8. [PubMed] [Google Scholar]
- Jacobsen LK, Mencl WE, Constable RT, Westerveld M, Pugh KR. Impact of smoking abstinence on working memory neurocircuitry in adolescent daily tobacco smokers. Psychopharmacology (Berl) 2007;193(4):557–66. doi: 10.1007/s00213-007-0797-9. [DOI] [PubMed] [Google Scholar]
- Karlsgodt KH, Glahn DC, van Erp TG, Therman S, Huttunen M, Manninen M, Kaprio J, Cohen MS, Lonnqvist J, Cannon TD. The relationship between performance and fMRI signal during working memory in patients with schizophrenia, unaffected co-twins, and control subjects. Schizophr Res. 2007;89(1–3):191–7. doi: 10.1016/j.schres.2006.08.016. [DOI] [PubMed] [Google Scholar]
- Kindermann SS, Karimi A, Symonds L, Brown GG, Jeste DV. Review of functional magnetic resonance imaging in schizophrenia. Schizophr Res. 1997;27(2–3):143–56. doi: 10.1016/S0920-9964(97)00063-7. [DOI] [PubMed] [Google Scholar]
- Kochar MS, Bindra RS. The additive effects of smoking and hypertension. More reasons to help your patients kick the habit. Postgrad Med. 1996;100(5):147–8. 151–4, 159–60. doi: 10.3810/pgm.1996.11.114. [DOI] [PubMed] [Google Scholar]
- Kwee IL, Nakada T. Dorsolateral prefrontal lobe activation declines significantly with age--functional NIRS study. J Neurol. 2003;250(5):525–9. doi: 10.1007/s00415-003-1028-x. [DOI] [PubMed] [Google Scholar]
- Lamar M, Yousem DM, Resnick SM. Age differences in orbitofrontal activation: an fMRI investigation of delayed match and nonmatch to sample. Neuroimage. 2004;21(4):1368–76. doi: 10.1016/j.neuroimage.2003.11.018. [DOI] [PubMed] [Google Scholar]
- Lawrence NS, Ross TJ, Stein EA. Cognitive mechanisms of nicotine on visual attention. Neuron. 2002;36(3):539–48. doi: 10.1016/s0896-6273(02)01004-8. [DOI] [PubMed] [Google Scholar]
- Leonard S, Adler LE, Benhammou K, Berger R, Breese CR, Drebing C, Gault J, Lee MJ, Logel J, Olincy A, Ross RG, Stevens K, Sullivan B, Vianzon R, Virnich DE, Waldo M, Walton K, Freedman R. Smoking and mental illness. Pharmacol Biochem Behav. 2001;70(4):561–70. doi: 10.1016/s0091-3057(01)00677-3. [DOI] [PubMed] [Google Scholar]
- Lepage M, Montoya A, Pelletier M, Achim AM, Menear M, Lal S. Associative memory encoding and recognition in schizophrenia: an event-related fMRI study. Biol Psychiatry. 2006;60(11):1215–23. doi: 10.1016/j.biopsych.2006.03.043. [DOI] [PubMed] [Google Scholar]
- Levin JM, Frederick Bde B, Ross MH, Fox JF, von Rosenberg HL, Kaufman MJ, Lange N, Mendelson JH, Cohen BM, Renshaw PF. Influence of baseline hematocrit and hemodilution on BOLD fMRI activation. Magn Reson Imaging. 2001;19(8):1055–62. doi: 10.1016/s0730-725x(01)00460-x. [DOI] [PubMed] [Google Scholar]
- Li X, Branch CA, Bertisch HC, Brown K, Szulc KU, Ardekani BA, DeLisi LE. An fMRI study of language processing in people at high genetic risk for schizophrenia. Schizophr Res. 2007;91(1–3):62–72. doi: 10.1016/j.schres.2006.12.016. [DOI] [PMC free article] [PubMed] [Google Scholar]
- Liddle PF, Laurens KR, Kiehl KA, Ngan ET. Abnormal function of the brain system supporting motivated attention in medicated patients with schizophrenia: an fMRI study. Psychol Med. 2006;36(8):1097–108. doi: 10.1017/S0033291706007677. [DOI] [PubMed] [Google Scholar]
- Liu TT, Behzadi Y, Restom K, Uludag K, Lu K, Buracas GT, Dubowitz DJ, Buxton RB. Caffeine alters the temporal dynamics of the visual BOLD response. Neuroimage. 2004;23(4):1402–13. doi: 10.1016/j.neuroimage.2004.07.061. [DOI] [PubMed] [Google Scholar]
- Lowe GD, Drummond MM, Forbes CD, Barbenel JC. The effects of age and cigarette-smoking on blood and plasma viscosity in men. Scott Med J. 1980;25(1):13–7. doi: 10.1177/003693308002500103. [DOI] [PubMed] [Google Scholar]
- Lu H, Zhao C, Lewis-Amezcua K. Baseline cerebral venous oxygenation determines response amplitudes: physiologic basis for inter-subject variations in fMRI results. 13th Annual Meeting of the Organization for Human Brain Mapping; Chicago, IL USA. 2007. [Google Scholar]
- Marder SR, Essock SM, Miller AL, Buchanan RW, Casey DE, Davis JM, Kane JM, Lieberman JA, Schooler NR, Covell N, Stroup S, Weissman EM, Wirshing DA, Hall CS, Pogach L, Pi-Sunyer X, Bigger JT, Jr, Friedman A, Kleinberg D, Yevich SJ, Davis B, Shon S. Physical health monitoring of patients with schizophrenia. Am J Psychiatry. 2004;161(8):1334–49. doi: 10.1176/appi.ajp.161.8.1334. [DOI] [PubMed] [Google Scholar]
- Marjoram D, Job DE, Whalley HC, Gountouna VE, McIntosh AM, Simonotto E, Cunningham-Owens D, Johnstone EC, Lawrie S. A visual joke fMRI investigation into Theory of Mind and enhanced risk of schizophrenia. Neuroimage. 2006;31(4):1850–8. doi: 10.1016/j.neuroimage.2006.02.011. [DOI] [PubMed] [Google Scholar]
- Meyer JS, Gotoh F, Takagi Y, Kakimi R. Cerebral hemodynamics, blood gases, and electrolytes during breath-holding and the Valsalva maneuver. Circulation. 1966;33(5 Suppl):II35–48. doi: 10.1161/01.cir.33.5s2.ii-35. [DOI] [PubMed] [Google Scholar]
- Miller GA, Chapman JP. Misunderstanding analysis of covariance. J Abnorm Psychol. 2001;110(1):40–8. doi: 10.1037//0021-843x.110.1.40. [DOI] [PubMed] [Google Scholar]
- Moore-Gillon J. Smoking--a major cause of polycythemia. J R Soc Med. 1988;81(7):431. doi: 10.1177/014107688808100733. [DOI] [PMC free article] [PubMed] [Google Scholar]
- Mustard JF. Cigarette smoking, atherosclerosis and its clinical complications. Can J Public Health. 1981;72(6):385–8. [PubMed] [Google Scholar]
- Nagel M, Sprenger A, Nitschke M, Zapf S, Heide W, Binkofski F, Lencer R. Different extraretinal neuronal mechanisms of smooth pursuit eye movements in schizophrenia: An fMRI study. Neuroimage. 2007;34(1):300–9. doi: 10.1016/j.neuroimage.2006.08.025. [DOI] [PubMed] [Google Scholar]
- Olincy A, Young DA, Freedman R. Increased levels of the nicotine metabolite cotinine in schizophrenic smokers compared to other smokers. Biol Psychiatry. 1997;42(1):1–5. doi: 10.1016/S0006-3223(96)00302-2. [DOI] [PubMed] [Google Scholar]
- Roc AC, Wang J, Ances BM, Liebeskind DS, Kasner SE, Detre JA. Altered hemodynamics and regional cerebral blood flow in patients with hemodynamically significant stenoses. Stroke. 2006;37(2):382–387. doi: 10.1161/01.STR.0000198807.31299.43. [DOI] [PubMed] [Google Scholar]
- Rogers RL, Meyer JS, Shaw TG, Mortel KF, Thornby J. The effects of chronic cigarette smoking on cerebrovascular responsiveness to 5 per cent CO2 and 100 per cent O2 inhalation. J Am Geriatr Soc. 1984;32(6):415–20. doi: 10.1111/j.1532-5415.1984.tb02215.x. [DOI] [PubMed] [Google Scholar]
- Ross MH, Yurgelun-Todd DA, Renshaw PF, Maas LC, Mendelson JH, Mello NK, Cohen BM, Levin JM. Age-related reduction in functional MRI response to photic stimulation. Neurology. 1997;48(1):173–6. doi: 10.1212/wnl.48.1.173. [DOI] [PubMed] [Google Scholar]
- Saad ZS, Ropella KM, DeYoe EA, Bandettini PA. The spatial extent of the BOLD response. Neuroimage. 2003;19(1):132–44. doi: 10.1016/s1053-8119(03)00016-8. [DOI] [PubMed] [Google Scholar]
- Schlosser RG, Nenadic I, Wagner G, Gullmar D, von Consbruch K, Kohler S, Schultz CC, Koch K, Fitzek C, Matthews PM, Reichenbach JR, Sauer H. White matter abnormalities and brain activation in schizophrenia: a combined DTI and fMRI study. Schizophr Res. 2007;89(1–3):1–11. doi: 10.1016/j.schres.2006.09.007. [DOI] [PubMed] [Google Scholar]
- Schneider F, Habel U, Reske M, Kellermann T, Stocker T, Shah NJ, Zilles K, Braus DF, Schmitt A, Schlosser R, Wagner M, Frommann I, Kircher T, Rapp A, Meisenzahl E, Ufer S, Ruhrmann S, Thienel R, Sauer H, Henn FA, Gaebel W. Neural correlates of working memory dysfunction in first-episode schizophrenia patients: an fMRI multi-center study. Schizophr Res. 2007;89(1–3):198–210. doi: 10.1016/j.schres.2006.07.021. [DOI] [PubMed] [Google Scholar]
- Shrout PE, Fleiss JL. Intraclass correlations: Uses in assessing rater reliability. Psychological Bulletin. 1979;86(2):420–428. doi: 10.1037//0033-2909.86.2.420. [DOI] [PubMed] [Google Scholar]
- Suslow T, Arolt V. Disorders of early information processing and vigilance as vulnerability markers for schizophrenia. Fortschr Neurol Psychiatr. 1996;64(3):90–104. doi: 10.1055/s-2007-996375. [DOI] [PubMed] [Google Scholar]
- Thermenos HW, Seidman LJ, Poldrack RA, Peace NK, Koch JK, Faraone SV, Tsuang MT. Elaborative verbal encoding and altered anterior parahippocampal activation in adolescents and young adults at genetic risk for schizophrenia using FMRI. Biol Psychiatry. 2007;61(4):564–74. doi: 10.1016/j.biopsych.2006.04.044. [DOI] [PubMed] [Google Scholar]
- Thomason ME, Burrows BE, Gabrieli JD, Glover GH. Breath holding reveals differences in fMRI BOLD signal in children and adults. Neuroimage. 2005;25(3):824–37. doi: 10.1016/j.neuroimage.2004.12.026. [DOI] [PubMed] [Google Scholar]
- Thomason ME, Foland LC, Glover GH. Calibration of BOLD fMRI using breath holding reduces group variance during a cognitive task. Hum Brain Mapp. 2007;28(1):59–68. doi: 10.1002/hbm.20241. [DOI] [PMC free article] [PubMed] [Google Scholar]
- Tost H, Ende G, Ruf M, Henn FA, Meyer-Lindenberg A. Functional imaging research in schizophrenia. Int Rev Neurobiol. 2005;67:95–118. doi: 10.1016/S0074-7742(05)67004-3. [DOI] [PubMed] [Google Scholar]
- Tu PC, Yang TH, Kuo WJ, Hsieh JC, Su TP. Neural correlates of antisaccade deficits in schizophrenia, an fMRI study. J Psychiatr Res. 2006;40(7):606–12. doi: 10.1016/j.jpsychires.2006.05.012. [DOI] [PubMed] [Google Scholar]
- Walter H, Vasic N, Hose A, Spitzer M, Wolf RC. Working memory dysfunction in schizophrenia compared to healthy controls and patients with depression: evidence from event-related fMRI. Neuroimage. 2007;35(4):1551–61. doi: 10.1016/j.neuroimage.2007.01.041. [DOI] [PubMed] [Google Scholar]
- Wessels AM, Rombouts SA, Simsek S, Kuijer JP, Kostense PJ, Barkhof F, Scheltens P, Snoek FJ, Heine RJ. Microvascular disease in type 1 diabetes alters brain activation: a functional magnetic resonance imaging study. Diabetes. 2006;55(2):334–40. doi: 10.2337/diabetes.55.02.06.db05-0680. [DOI] [PubMed] [Google Scholar]
- Whisnant JP, Homer D, Ingall TJ, Baker HL, Jr, O’Fallon WM, Wievers DO. Duration of cigarette smoking is the strongest predictor of severe extracranial carotid artery atherosclerosis. Stroke. 1990;21(5):707–14. doi: 10.1161/01.str.21.5.707. [DOI] [PubMed] [Google Scholar]
- Whitehead TP, Robinson D, Allaway SL, Hale AC. The effects of cigarette smoking and alcohol consumption on blood haemoglobin, erythrocytes and leucocytes: a dose related study on male subjects. Clin Lab Haematol. 1995;17(2):131–8. [PubMed] [Google Scholar]
- Whyte MC, Whalley HC, Simonotto E, Flett S, Shillcock R, Marshall I, Goddard NH, Johnstone EC, Lawrie SM. Event-related fMRI of word classification and successful word recognition in subjects at genetically enhanced risk of schizophrenia. Psychol Med. 2006;36(10):1427–39. doi: 10.1017/S0033291706008178. [DOI] [PubMed] [Google Scholar]
- Wolff AL, O’Driscoll GA. Motor deficits and schizophrenia: the evidence from neuroleptic-naive patients and populations at risk. J Psychiatry Neurosci. 1999;24(4):304–14. [PMC free article] [PubMed] [Google Scholar]
- Worsley KJ, Liao CH, Aston J, Petre V, Duncan GH, Morales F, Evans AC. A general statistical analysis for fMRI data. Neuroimage. 2002;15(1):1–15. doi: 10.1006/nimg.2001.0933. [DOI] [PubMed] [Google Scholar]
- Xu J, Mendrek A, Cohen MS, Monterosso J, Simon S, Jarvik M, Olmstead R, Brody AL, Ernst M, London ED. Effect of cigarette smoking on prefrontal cortical function in nondeprived smokers performing the Stroop Task. Neuropsychopharmacology. 2007;32(6):1421–8. doi: 10.1038/sj.npp.1301272. [DOI] [PMC free article] [PubMed] [Google Scholar]
- Yoon JH, D’Esposito M, Carter CS. Preserved function of the fusiform face area in schizophrenia as revealed by fMRI. Psychiatry Res. 2006;148(2–3):205–16. doi: 10.1016/j.pscychresns.2006.06.002. [DOI] [PubMed] [Google Scholar]
- Zarahn E, Rakitin B, Abela D, Flynn J, Stern Y. Age-related changes in brain activation during a delayed item recognition task. Neurobiol Aging. 2006;28:784–98. doi: 10.1016/j.neurobiolaging.2006.03.002. [DOI] [PubMed] [Google Scholar]