

Abstract
Transitions to conformational states with very low populations were detected for the reduced blue copper protein azurin from Pseudomonas aeruginosa by applying constant relaxation time CPMG measurements to the backbone 15N nuclei at three magnetic fields (11.7, 14.1, and 18.8 T) and three temperatures (25.7, 35.4, and 44.8°C). Two exchange processes with different rate constants could be discriminated despite populations of the excited states below 1% and spatial neighborhood of the two processes. The group of 15N nuclei involved in the faster process exhibits at 44.8°C a forward rate constant of 11.7±2.4 s−1 and a population of the exited state of 0.39±0.07%. They surround the aromatic ring of histidine 35 whose protonation state is coupled to the flipping of a neighboring peptide plane. For the slower process, the forward rate constant and population of the exited state at 44.8°C are 4.1±0.1 s−1 and 0.45±0.02%, respectively. The residues involved cluster nearby the copper ion, which is separated from the protonation site of histidine 35 by about 8 Å, indicating conformational rearrangements involving the copper coordinating loops. The dependence of the equilibrium constant on the temperature is consistent with an enthalpy-dominated transition around the copper, but an entropy-controlled transition near histidine 35. The detection by nuclear magnetic resonance of millisecond to second conformational transitions near the copper ion suggests a low energy-cost rearrangement of the copper-binding site that may be necessary for efficient electron transfer.
Keywords: Blue copper proteins, dynamics, NMR relaxation, CPMG, conformational exchange
The stability of a protein is determined by the free energy differences between the native state and accessible alternatives, and by the balance between enthalpy and entropy that determines these. For many proteins, it is essential that they not only undergo breathing motions but that they can also reach states that are both structurally and energetically more distant (Branden and Tooze 1999). To name a few examples, these states may allow substrate binding to an enzyme by exposing an active site such as in the cyclin-dependent kinase CDK2 (Jeffrey et al. 1995), they may correspond to different states of the subunits of an allosteric protein such as phosphofructokinase (Schirmer and Evans 1990), or they may represent the excited states in the proton translocation cycle of bacteriorhodopsin (Henderson et al. 1990). In crystallographic studies, breathing motions result in lowered electron densities, whereas more sizeable conformational changes can sometimes be observed as alternative structures in the same electron density map provided that they are significantly populated. Nuclear magnetic resonance (NMR) can provide a detailed description of breathing motions, for example, by applying “model-free” analyses to relaxation data (Lipari and Szabo 1982). However, NMR is also a very sensitive tool for detecting interconversions between multiple conformations and for characterizing their thermodynamic interplay.
Heteronuclear NMR relaxation provides us with unique probes of protein conformational dynamics at atomic resolution. Approaches for studying pico to nanosecond time-scale motions (Palmer et al. 1996; Korzhnev et al. 2001a), slow conformational transitions on the second time scale (Montelione and Wagner 1989; Wider et al. 1991; Farrow et al. 1994) as well as intermediate microsecond-to-millisecond processes (Palmer et al. 2001) are now well established. Quantification of the latter type of processes relies on modulations of exchange line broadening as a result of radiofrequency irradiation applied at various field strengths and/or carrier frequencies (Szyperski et al. 1993; Akke and Palmer 1996), or on CPMG sequence with variable pulse repetition rate (Orekhov et al. 1994; Ishima et al. 1999; Loria et al. 1999; Mulder et al. 2001b; Skrynnikov et al. 2001; Wang et al. 2001). The initially proposed methods provide access to protein motions in the time range from tenths or hundredths of microseconds to milliseconds (Szyperski et al. 1993; Orekhov et al. 1994; Akke and Palmer 1996). Recently, constant relaxation time CPMG experiments have been introduced, which effectively sort out exchange contributions to transverse relaxation from those of other relaxation mechanisms, allowing quantitative descriptions of conformational exchange in milliseconds to seconds (Loria et al. 1999; Mulder et al. 2001b; Skrynnikov et al. 2001). For CPMG data obtained at several magnetic fields, these experiments can provide thermodynamic information including rate constants of an exchange process as well as populations of the structures involved (Millet et al. 2000). In a recent example, a T4 lysozyme mutant creating a cavity was studied, and millisecond time-scale excursions to a partially disordered high-energy state with a population of a few percents were revealed; the latter are likely to facilitate ligand entry into the deeply buried cavity (Mulder et al. 2001a,b; Skrynnikov et al. 2001).
The blue copper protein azurin from Pseudomonas aeruginosa is among the most thoroughly investigated electron-transfer metalloproteins (Adman 1991; Malmström 1994). Spatial structures have been determined for reduced wild-type azurin and for its oxidized form at different pH values (Shepard et al. 1990; Nar et al. 1991) as well as for the apo-protein (Nar et al. 1992). These structural studies have shown that the copper-binding site is essentially the same in the apo-form and in metal-loaded azurin, and it undergoes minimal changes upon oxidation. The copper coordination in both reduced and oxidized forms is close to trigonal, which is typical for CuI but quite unusual for CuII complexes (Gray et al. 2000). These observations support an early suggestion that the rigid protein matrix serves as a rack to constrain the copper in its coordination geometry (Malmström 1964, 1994) ensuring minimal reorganization energy associated with the electron transfer. However, the finding that oxidized azurin is more stable than reduced (Leckner et al. 1997) and model calculations of optimal copper coordination geometry (Ryde et al. 1996) raise strong doubts against the hypothesis of an essentially rigid environment imposed by the protein on the metal. Recently, slow conformational exchange was reported for the residues surrounding the side chain of histidine 35, which is located about 8 Å away from the copper site. This exchange was attributed to the protonation/deprotonation equilibrium of this side chain, which in turn appears coupled to the flipping of a neighboring peptide plane (Kalverda et al. 1999).
This work reports the detection of slow millisecond-to-second conformational transitions in reduced azurin to exited, low-populated conformations based on relaxation dispersion profiles obtained from constant relaxation time CPMG experiments. The data allowed us to separate at least two processes likely related to the protonation of the side chain of histidine 35 and a conformational rearrangement involving the copper-coordinating loops. The rate constants and population of the exchanged states were obtained using data measured at three magnetic fields (11.7, 14.1, and 18.8 T) and at three temperatures (25.7, 35.4, and 44.8°C). Thermodynamic characteristics of the exited states were estimated from the temperature dependence of the equilibrium and rate constants. The results presented provide experimental evidence for low energy-cost conformational rearrangements of the copper-binding site in azurin.
Results
Processing of CPMG data for individual residues
After the initial removal of the residues with resonance overlap in the 1H-15N correlation spectra at any of three temperatures, the statistical analysis of the CPMG data on the remaining residues with both a simple model and the exchange model based on the equation by Carver and Richards (1972) yielded 30 residues for which the exchange model was statistically confirmed (see Materials and Methods). These residues, when mapped to the three-dimensional (3D) structure of azurin, cover about half of the protein in an asymmetric distribution that is centered near the copper-binding site (Fig. 1A ▶; the 30 residues are listed in the figure caption).
Figure 1.

Azurin structure with copper location (brown) and numbering of selected residue positions. (A) The 30 residues, which were found to exhibit conformational exchange, are indicated by green spheres at their backbone amide positions (residues 9–11, 37, 42–48, 50, 58, 61, 71, 82, 87–90, 111–113, 116–117, 120, and 123–124). (B) Nitrogen atoms are displayed as spheres for the residues listed in Table 1, with colors identifying the three groups: red, green, and black for the first, second, and third group, respectively. The side chain of histidine 35 is shown in yellow, and the hydrogen bond between this side chain and the carbonyl group of proline 36 is indicated as a dashed magenta connection. Residue numbers are provided for the first and second group.
The information content of the data from the CPMG experiments depends on the time scale of the exchange process (Ishima and Torchia 1999; Millet et al. 2000). Let us consider conformational exchange between two states, A and B (for details see Materials and Methods). Based on a single resonance, one can get in the limit of slow exchange (kex/Δω<<1) only the forward rate constant kA. For intermediate exchange (kex/Δω∼1), it is possible to obtain the reverse and the forward rate constants, kB and kA, as well as the absolute value of the chemical shift difference σex by using the formula of Carver and Richards (equation 3 in Materials and Methods). In the fast exchange limit (kex/Δω>>1) one can only extract the chemical shift dispersion (4pApB)1/2σex and the effective rate constant kex = kA+kB independently of the expression applied for data analysis. It has been noted that in the limit of very low population pB of the state B in the high-field limit, (2πνCPMG)2>>pBΔω2, the only parameters available from the CPMG data are again kex and (4pApB)1/2σex (Ishima and Torchia 1999). Because at all temperatures used, all NH groups of azurin are represented in the 1H−15N correlation spectrum by a single dominant resonance, possible conformational exchange either approaches the fast regime or involves a low-populated minor conformation. In both cases, the application of the equation by Carver and Richards, depending on the three exchange parameters kA, kB and σex, may be an overestimation if the data can be described by only two exchange parameters. To check for this situation, we also processed the data with an exchange model based on the formula by Bloom et al. (1965; equation 2 in Materials and Methods), including a total of five adjustable parameters, R2 at 11.7, 14.1, and 18.8 T, and two exchange parameters, the effective rate constant kex and the chemical shift dispersion (4pApB)1/2σex. The two models were compared using F-test, and for 21 of the 30 residues a significant χ2 reduction upon transition from the model by Bloom (equation 2) to the one by Carver and Richards (equation 3) was confirmed with at least 90% confidence. The reduction of χ2 for the Carver and Richards model when compared to the Bloom model is mostly the result of improved fitting at low values of the CPMG frequencies νCPMG.
The fitting of the experimental relaxation dispersion data using the Carver and Richards model is illustrated in Figure 2 ▶ for glycine 45. For most of the residues considered the fitting results in rate constants kA<<kB indicating transitions to exited low-populated states. For many residues, the kA values are determined with a better precision compared to the kB values (or the kex values obtained using the Bloom formula). The uncertainties of kB and kex are coupled with the precision at which one finds a plateau value of R2*(νCPMG) at νCPMG→∞. Because most of the residues have kB (∼kex) of the order of thousands of inverse seconds, plateau values are still not reached at the highest CPMG frequency used. This results for many residues in a better precision of the kA values compared to the kB values (or the kex values when using the Bloom formula). Therefore, in the following analysis of individual residues, we mostly rely on the information provided by the values of the forward rate constants kA. The analysis was restricted to residues for which the error of kA is smaller than its value at all temperatures. For the resulting 18 residues, the model by Carver and Richards provides a significantly better description than the one by Bloom with the exception of serine 89.
Figure 2.

Plot of relaxation rates R2* vs. the CPMG frequency νCPMG for glycine 45. Squares and corresponding error bars describe the experimental data, while the curves represent fits to the model by (Carver and Richards 1972) for three temperatures. Each fit is given in a different panel (top: 25.7°C, middle: 35.4°C, bottom: 44.8°C) and calculated using data from three different fields (lowest curve for 11.7 T, middle curve for 14.1 T, highest curve for 18.8 T).
The data analysis of the 18 residues with well-defined kA values results in a rather broad distribution of forward and reverse rate constants. Thus, for T = 35.4°C, the values of kA vary from 0.44 to 9.55 s−1 and those of kB from 498 to 2010 s−1 (this scattering of the kB values is among the residues for which kB exceeds its error at all three temperatures). The rate constants obtained suggest transitions to conformational states with populations around 1% for most of the selected residues. The chemical shift difference σex between the exchanged states for 15N nuclei considered varies from 1.4 to 6.9 ppm, that is, several parts per million, on average. According to these values, the conformational exchange in azurin may be classified as intermediate (kex/Δω∼1). This is in agreement with preliminarily estimates of the conformational exchange time scale using the procedure outlined by (Millet et al. 2000), based on the parameter α = dlnRex/dlnΔω. Even at the highest temperature of 44.8°C, the value of α estimated using Rex ∼ R2(νCPMG = 33Hz) − R2(νCPMG = 800Hz) at 14.1 and 18.8 T exceeds 1.0 only for one of the 18 residues mentioned (α = 1.04 for glycine 45), indicating intermediate/slow exchange. It should be noted, however, that for residues with well-defined kA and kB, good agreement between the exchange parameters obtained from the models by Bloom and by Carver and Richards is observed. Namely, σex × (4pApB)1/2 and kA+kB from the model by Carver and Richards correspond well to the chemical shift dispersion and kex of the Bloom model, respectively. The Carver and Richards equation describes the relaxation dispersion profiles better at low values of νCPMG, thus providing the necessary information to determine populations of the exchanged states.
Multiple exchange processes in azurin
The main question arising from the data analysis for individual residues is how to group the residues into sets that are subjected to the same dynamic process. Because for a given residue the scattering of the parameter kA at different temperatures is much smaller than the variation of kA between different residues, the observed rate constants are likely to reflect multiple dynamic processes in azurin. Thus, in the next step of the data analysis, the 18 residues obtained from the previous steps are classified using their reaction rate constants kA together with the slope of ln(kA) vs. 1/T calculated using kA values at 25.7 and 35.4°C (Table 1). The residues in Table 1 are ordered according to decreasing values of ln(kA) at T = 35.4°C. In addition, values of kB are given if they are sufficiently well defined, that is, when the value exceeds its error. Based on these entities, the residues are classified into three groups. The first group consists of six residues (Gly 90, Gly 45, Gly 37, Ser 89, Ile 87, and His 46), which are characterized by high kA values, strictly negative slopes of ln(kA) vs. 1/T, and large and well-defined kB values. The six residues in the second group (Trp 48, Thr 113, Asn 47, Cys 112, His 117, and Phe 111) have smaller kA values, again sizeable negative slopes, and smaller kB values. The final six residues have low kA values that do not exhibit a pronounced dependence on the temperature, and poorly defined kB values. Figure 3 ▶ is a plot of ln(kA) vs. 1/T for the 12 residues of the first two groups. The main difference between these two groups is the size of kA and the size and uncertainty of the kB values, while the slopes of ln(kA) vs. 1/T do not provide a clear-cut criterion (the deviation from linear behavior of three of the curves is addressed later).
Table 1.
Exchange parameters for azurin residues with well-defined conformational exchange parameters
| Residuea | ln(kA)b | Slopec | ln(kB)b |
| Gly 90 | 2.26 | −7490 | 7.61 |
| Gly 45 | 2.23 | −6778 | 7.06 |
| Gly 37 | 2.00 | −3121 | 7.60 |
| Ser 89 | 1.88 | −3391 | 7.51 |
| Ile 87 | 1.61 | −3442 | 7.09 |
| His 46 | 1.28 | −5996 | 7.11 |
| Trp 48 | 0.74 | −6447 | – |
| Thr 113 | 0.72 | −7959 | 6.19 |
| Asn 47 | 0.58 | −6456 | 6.62 |
| Cys 112 | 0.58 | −6690 | – |
| His 117 | 0.57 | −7765 | – |
| Phe 111 | 0.36 | −4173 | – |
| Gly 9 | 0.29 | −1127 | – |
| Asp 71 | 0.01 | −1127 | – |
| Asn 42 | −0.32 | 2501 | – |
| Thr 124 | −0.59 | 706 | – |
| Gly 123 | −0.67 | 1488 | – |
| Gly 58 | −0.82 | 3836 | – |
a Residues with well-defined kA values at all three temperatures are listed. Table rows are sorted with respect to decreasing values of ln(kA) at T = 35.4°C.
b The exchange rate constants kA and kB are forward and backward reaction parameters obtained by fitting to relaxation data as described in the text. Whenever the kB values are poorly defined, that is, they are smaller than their errors for at least one temperature, no value is given.
c Slope obtained for the values at 25.7 and 35.4°C (see text and Fig. 3 ▶).
Figure 3.

Plot of ln(kA) vs. 1/T for the residues of the first (solid lines) and second group (broken lines) of Table 1. (Units of rate constants kA are s−1.) From top to bottom at T = 44.8°C, the solid lines correspond to residues 90, 45, 89, 37, 46, and 87 and the broken lines to residues 113, 48, 47, 117, 112, and 111. On the horizontal axis, centigrade temperatures are given in parentheses.
Potential sources for the exchange processes
To obtain a structural explanation for the differing behavior of the residues listed in Table 1, all three groups were mapped onto the 3D structure of azurin (Fig. 1B ▶). The first two groups cluster each in a structurally small region, while the third group seems to form an outer layer around those. The spatial neighborhood around the copper ion for the second group becomes immediately obvious. The side-chains of the residues cysteine 112 and histidine 117 from this group provide two of three pseudotrigonal ligands that strongly bind the copper ion. It may thus be hypothesized that a reaction involving the copper ion triggers the conformational exchange observed for these residues.
A different source for conformational exchange has been described (Kalverda et al. 1999) that may explain the observed effects for the residues of the first group. This exchange process was related to the pH dependent protonation state of the side chain of histidine 35. This side chain forms at low pH a hydrogen bond with the carbonyl oxygen group of proline 36 (situation shown in Fig. 1B ▶) and at high pH a hydrogen bond with the HN of glycine 37. In addition, a hydrogen bond connects the ring of histidine 35 to the CO group of methionine 44, a neighbor to glycine 45. Histidine 35 is located approximately in the middle of the first group of residues of Table 1, and it appears well suited to explain the differing reaction rates of this group.
Refinement of the exchange rate constants
The exchange parameters obtained for many individual residues are not precise enough to thermodynamically characterize the processes. Based on the evidence provided by Figure 1B ▶ and Table 1 about the presence of (at least) two distinct dynamic processes in azurin on the microsecond-second time scale, the relaxation dispersion data were processed jointly for residues within regions that surround the proposed sources for exchange. Because for all residues within a region the same values of kA and kB can be assumed, the data fit is expected to yield more precise values for these parameters. Therefore, all 30 residues for which exchange has been statistically confirmed (see above) were reconsidered. There is no reason to restrict the set of residues here, as at this stage two distinct exchange regions on azurin structure have already been located. Regions were defined using the following criteria (Table 2). Region one residues are near the protonation site of histidine 35; their backbone nitrogens are closer than 10 Å to this site, more than 8 Å away from the copper ion, and the distance ratio to these two sites exceeds 1.5. Region two residues are near the copper ion; their backbone nitrogens are closer than 10 Å to this ion, more than 8 Å away from the protonation site of histidine 35, and the distance ratio to these two sites exceeds 1.5. Region three residues are located between histidine 35 and the copper, with distances not exceeding 8 Å to both sites. The latter residues are likely to feel both exchange processes. Table 2 lists for all regions the residues that satisfy the corresponding criteria together with the relevant distances in the crystal structure. The residues of the first group of Table 1 are distributed over regions one and three, and supplemented by a few additional residues. Region two contains all six residues of the second group from Table 1, augmented by three more residues.
Table 2.
Selected distances for azurin residues with confirmed conformational exchange
| Residue | Table 1a | d(H35)b | d(Cu)b |
| Near His 35c | |||
| Asp 11 | − | 4.7 | 8.8 |
| Gly 37 | + | 4.5 | 12.5 |
| Gly 88 | − | 6.0 | 9.0 |
| Ser 89 | + | 4.0 | 10.1 |
| Gly 90 | + | 5.0 | 12.6 |
| Near copperc | |||
| Asn 47 | + | 9.0 | 4.7 |
| Trp 48 | + | 11.4 | 7.5 |
| Phe 111 | + | 15.4 | 9.2 |
| Cys 112 | + | 12.9 | 5.8 |
| Thr 113 | + | 13.2 | 5.5 |
| Cys 116 | − | 15.4 | 7.8 |
| His 117 | + | 13.4 | 5.7 |
| Leu 120 | − | 15.2 | 8.6 |
| Lys 122 | − | 14.4 | 8.5 |
| Between Copper and His 35c | |||
| Asn 10 | − | 4.8 | 7.8 |
| Met 44 | − | 7.6 | 7.2 |
| Gly 45 | + | 6.9 | 5.4 |
| His 46 | + | 6.5 | 4.0 |
| Ile 87 | + | 8.0 | 7.9 |
a Residues listed in Table 1 are indicated by a plus sign.
b Distances in Å from the backbone nitrogen to the histidine 35 and to the copper ion, respectively. In histidine 35, the Nδ1 position is used as reference point.
c Residues are classified into three regions according to the following criteria: “near His 35” if d(H35) < 10Å, d(Cu) >8Å, and d(Cu)/d(H35)>1.5; “near copper” if d(Cu) < 10Å, d(H35) > 8Å, and d(H35)/d(Cu)>1.5; “between copper and His 35” if d(H35) < 8Å and d(Cu) < 8Å.
As expected, the collective processing of relaxation dispersion data considering kA and kB as global parameters results in a substantial improvement of the precision of the optimized exchange parameters (Table 3; Fig. 4 ▶). Regions one and two differ significantly by their kA and kB values, while the equilibrium constants ke = kB/kA are similar for both corresponding processes. Thus, at 44.8°C, the process associated with histidine 35 is about three times faster than the one connected to the copper ion (Table 3). However, the populations of the minor states at this temperature are similar for both processes and around 0.4%. For histidine 35, the population of the excited (protonated) state is in agreement with those deduced from the Ka value of its titrating side chain and the given pH. Accordingly, the differences in Gibbs free energy between the ground and minor states, which can be estimated from the equilibrium constants keq, is for both processes about 14 kJ/mole (Table 3). Although, the two-state exchange model assumed in the data processing for region three between copper and histidine 35 is definitely an oversimplification, the apparent exchange parameters for this region still may have a reasonable interpretation. The residues of region three have similar rate constants as those of region one, but a smaller equilibrium constant. A calculation of the (apparent) population of the exited state for region three yields at 44.8°C about 0.85%, that is, approximately the sum of the minor state populations obtained for regions one and two. This might be an indication that the two processes are not or only weakly correlated.
Table 3.
Transition parameters at T = 44.8°C obtained by fitting the CPMG data for groups of residues
| Transition parameter | Near His 35 | Near copper |
| Forward rate constant kA [s−1]a | 11.7 ± 2.4 | 4.1 ± 0.1 |
| Equilibrium constants keqb | 254 ± 31 | 222 ± 7 |
| Minor state population [%]c | 0.39 ± 0.07 | 0.45 ± 0.02 |
| Gibbs free energy ΔG [kJ/mol]d | 14.6 ± 0.3 | 14.3 ± 0.1 |
a From fitting of the CPMG data using the Carver and Richards equation.
b The equilibrium constants keq is kB/kA.
c Minor state populations are calculated as 100%/(keq + 1); keq = kB/kA.
d Differences in Gibbs free energy between ground and minor states, calculated as ΔG = −RTln (keq), where R is the universal gas constant.
Figure 4.

Dependencies of reaction constants on temperature. The logarithms and error estimates of kA (top), kB (middle), and keq = kB/kA (bottom) are plotted versus 1/T for residues of region one (heavy solid lines), region two (heavy dashed lines), and region three (solid thin lines). Regions include residues listed in Table 2. On the horizontal axis, temperatures in centigrade are given in parentheses.
Discussion
CPMG relaxation dispersion data measured at several magnetic fields are inherently very sensitive to the presence of exchange processes (Millet et al. 2000). The present data analysis for the backbone 15N nuclei of the reduced azurin established that about one third of the protein is involved in a dynamic process on a time scale from milliseconds to seconds (Fig. 1A ▶). In contrast, only a few residues exhibiting conformational exchange, all surrounding histidine 35, were found in a previous “model-free” analysis of 15N relaxation data of azurin measured at a single magnetic field (Kalverda et al. 1999). A similar analysis of the homologous protein plastocyanin also revealed no substantial microsecond-to-millisecond dynamics (Bertini et al. 2001). The major novelty in the present study is the detection of an exchange process that directly involves the copper-binding site. All three ligand residues that bind copper in distorted trigonal geometry, histidine 46, cysteine 112, and histidine 117, as well as the weakly interacting axial ligand glycine 45, were found to be involved into an exchange process at all three temperatures. The last residue whose side chain weakly interacts with the copper, methionine 121, was excluded from our analysis because of spectral overlap of its NH resonance at 25.7°C. At 35.4 and 44.8°C, however, the backbone 15N of methionine 121 shows a pronounced dependence of R2* on the CPMG frequency νCPMG (equations 1–3 in Materials and Methods). This is confirmed by statistical criteria, making it very likely that this residue also participates in an exchange process. Moreover, conformational exchange was found for several additional residues in close proximity of the copper ion (Table 2). Apart from detecting slow conformational dynamics, CPMG relaxation dispersion measurements allow kinetic and thermodynamic characterizations of the processes. Thus, by extracting the forward and reverse rate constants kA and kB, we found that the conformational exchange in azurin is connected with transitions to exited states with populations <1% (Table 3).
The classification of residues exhibiting exchange based on the values and temperature dependencies of the forward rate constants kA (Table 1, Fig. 3 ▶), and the subsequent mapping of these groups onto the structure (Fig. 1B ▶) provides sufficient evidence to suggest two exchange processes, one involving the copper ion and one occurring near histidine 35. In addition, the behavior of intermediate residues might indicate that the two processes are largely uncoupled (see Results). The separation of residues into two regions, each corresponding to a single exchange process (Table 2), should however be considered an approximation, as the cutoffs of Table 2 do not ensure that a nucleus close to one anticipated exchange source is not affected by the other. Also, the presence of exactly two exchange processes is only an assumption, but the limited set of residues considered and the precision of extracted rate constants do not allow a separation into more regions. Thus, the nonlinear dependencies of ln(kA) vs. 1/T observed for residues 37, 46, and 87 (Fig. 3 ▶) might indicate a more complex dynamic process near histidine 35. Note also that two of these residues adopt an intermediate position between the copper ion and histidine 35 (Table 2), while residue 37 is located quite far from the copper, directly besides the peptide plane with pH-dependent orientation. The two regions selected, “near histidine 35” and “near copper” (Table 2), appear nevertheless reasonable, and the joint processing of the relaxation dispersion data for the residues of each region result in substantial improvement of the precision of equilibrium and rate constants. For the intermediate third region, “between copper and histidine 35”, the two-state assumption is too simple, and therefore the further discussion is restricted to the other two regions.
The equilibrium constants for all regions show a close to linear dependency on the inverse temperature (Fig. 4 ▶). Although our measurements were carried out for only three different temperatures, we present in this section an attempt to decompose the Gibbs free energies into enthalpic and entropic contributions using linear fits of the logarithm of equilibrium constants versus the inverse temperature for the transitions near histidine 35 and near the copper. The resulting thermodynamic parameters, which are summarized in Table 4, suggest an entropy-driven process around histidine 35 with relatively small enthalpy change. This may be explained by the earlier mentioned protonation of the histidine side chain that is coupled to the flip of an adjacent peptide plane (Nar et al. 1991; Kalverda et al. 1999). The major change of an enthalpic interaction, the removal of the hydrogen bond between the histidine ring and proline 36, is replaced by another hydrogen bond to glycine 37. The minor state might represent a trapped state with higher order (strain) but similar interaction energy. In contrast, the process near the copper ion, for which a detailed description of the mechanism is missing, results in a pronounced unfavorable enthalpy change that is partially compensated by an entropy gain, which might indicate a transition to a less-stable and more disordered state.
Table 4.
Thermodynamic data extracted from CPMG data
| Parametera/Regionb | Near His 35 | Near copper |
| ΔH [kJ/mol] | −5.1 ± 3.6 | −25.2 ± 4.7 |
| ΔS [J/(mol•K)] | 28.6 ± 11.9 | −34.6 ± 14.8 |
| TΔS [kJ/mol]c | 9.1 ± 3.8 | −11.0 ± 4.7 |
| ΔHB [kJ/mol] | 39.7 ± 5.1 | 32.0 ± 6.7 |
| ΔSB [J/(mol•K)] | −53.6 ± 16.5 | −88.4 ± 21.2 |
| TΔSB [kJ/mol]c | −17.0 ± 5.2 | −28.1 ± 6.7 |
a Obtained from linear fits to the data shown in Figure 4 ▶ using the following equations: ln(keq) = ΔS/R − ΔH/RT and ln(kB) = ln(KbT/h) + ΔSB/R − ΔHB/RT, where T is the temperature, R is the universal gas constant, Kb is Boltzmann’s constant, h is Planck’s constant, ΔH and ΔS are enthalpy and entropy difference between ground and minor states, and ΔHB and ΔSB are enthalpy and entropy differences between transition and minor states. Note that the latter equation from transition theory is based on several assumptions and should thus be used only in a qualitative way.
b Regions and their residues as defined in Table 2.
c Values for T = 44.8°C.
Similarly, one may attempt to describe the transition states for both processes, but again reservations have to be made because of the small number of temperature points. Table 4 presents data regarding the first part of the reaction, leading from the minor state to the transition state. Linear fits of the logarithm of rate constants kB vs. 1/T indicate that for both processes there is a barrier relative to the minor state of about 60 kJ/mole consisting of enthalpy and somewhat smaller entropy contributions (Table 4). These values may be considered upper limits for the barrier heights in view of alternative assumptions of, for example, a ragged free-energy surface with lower maxima (Ferry et al. 1953; Denisov et al. 1996).
To our knowledge, no mechanism has been described that can explain the modulation of the 15N chemical shifts observed in this study around the copper ion. The dynamic process observed is unlikely to reflect an exchange with low amounts of an oxidized species with chemical shift differences induced by paramagnetic CuII. Already with the minor state population reported in Table 3, 0.45%, an oxidized species would exceed the detection limit for absorption at 628 nm of 0.2%. Furthermore, paramagnetic CuII would significantly enhance the 15N relaxation resulting in higher values for R2B, which in turn would increase the population of the minor state with respect to those calculated using R2A = R2B. For example, fitting of the relaxation dispersion data with a 10 (20) times increase of R2B would result in a pB of 0.55% (0.69%). Such a population of the oxidized species would not escape detection by optical methods. Therefore, we believe that the exchange involving the copper ion is connected with conformational transitions in reduced azurin with chemical shift modulation arising from rearrangements of the local structure.
Efficient functioning of blue copper proteins relies on low reorganization energies associated with the electron transfer. For azurin, this energy was estimated to 0.6–0.8 eV (1 eV corresponds to 96.5 kJ/mole), with the inner-sphere reorganization energy for the copper site being <0.2 eV (DiBilio et al. 1997). The coordination of copper in both reduced and oxidized azurin is close to trigonal, which is typical for CuI but unusual for CuII complexes (Gray et al. 2000). An early suggestion was that the protein matrix must be essentially rigid to constrain the copper coordination geometry, thus minimizing the reorganization energy (Malmström 1964, 1994). Our experimental results suggest, in contrast, that the copper site of azurin is flexible enough to adopt detectable multiple conformational states. This finding is further confirmed by the recent observation of increased B-factors around the copper ion in crystal structures at various temperatures (L. Sjölin, pers. comm.). The observed excited states are relatively similar in free energy to the ground state with ΔG ≈ 14 kJ/mole at 44.8°C (Table 3), and barrier heights with respect to the minor state of about 60 kJ/mole. Other recent studies also suggest that there is little if any strain imposed by the protein on the metal. Quantum chemical calculations showed that the optimal vacuum structures of CuII and CuI binding to corresponding ligands are similar to those observed in the crystal structures of blue copper proteins (Ryde et al. 1996). Moreover, it was found that these conformations do not represent a unique energy minimum and that there are other energetically close conformations for CuII as well as CuI. The observation that the oxidized azurin is the most stable form (Leckner et al. 1997) is also in contrast to the idea that a basically rigid protein matrix enforces an unusual coordination geometry of blue copper.
The introduction of constant relaxation time CPMG relaxation dispersion measurements (Loria et al. 1999) made it possible to detect by NMR the conformational transitions of proteins to low-populated excited conformational states. (Mulder et al. 2001a) showed recently that this type of NMR experiment is capable of providing a comprehensive thermodynamic description of the exchange processes. In the presented study, we apply 15N relaxation dispersion measurements for quantification of multiple exchange processes in azurin, thus demonstrating the potential of this analysis in studies of proteins undergoing several internal exchange processes and with low-populated states. The data collected allowed us to separate and describe a so far unknown dynamic process involving the copper-binding site of azurin.
Materials and methods
Azurin expression and purification: Sample preparation
Azurin was expressed and purified as described previously (Karlsson et al. 1989), with the exception that 100 mM CuSO4 was added to the cultivation medium (600 mL M9 minimal medium supplemented with 4 g algae extract). The A628/A280 absorbance ratio was 0.58 for the fully oxidized CuII-coordinating wild-type azurin. All stock chemicals were from Merck & Co. and of reagent grade. 15N labeled algae extract was obtained from Martek.
The sample of uniformly 15N labeled reduced azurin was prepared as follows. The protein was brought to 50 mM phosphate buffer through ultra filtration. It was then deoxygenated with concomitant reduction of CuII to CuI using a few grains of platinum black (from Fluka) and bubbling of H2 gas in septum-sealed containers for ∼30 minutes. At the end of this procedure, the 628-nm absorption band had disappeared providing an upper limit of the amount of protein with oxidized copper of 0.2%. The sample was then transferred to a restricted NMR tube under N2 atmosphere and sealed. The final conditions of the sealed NMR sample were 1 mM of uniformly 15N-labeled reduced protein with ≤0.2% oxidized protein (measurement in sealed sample), 8% D2O, and a pH of about 5.
Relaxation dispersion measurements
Constant relaxation time CPMG experiments were performed for the backbone 15N nuclei of azurin using a pulse sequence described by (Tollinger et al. 2001), which implements an idea originally proposed by (Loria et al. 1999). Namely, an element is introduced to the pulse sequence, which exchanges in-phase and antiphase 15N magnetization in the middle of the constant time relaxation period, flanked by two identical elements composed of CPMG pulse trains, each of the length TCP/2. In the absence of microsecond conformational exchange affecting the chemical shift of a nucleus, the resulting effective 15N transverse relaxation rate R2* is independent of the CPMG pulse repetition rate. Otherwise, peak intensities in the spectra are modulated by exchange contribution to transverse relaxation. The peak intensities in a set of spectra recorded with different CPMG frequencies νCPMG = 1/(4δ), where δ is the delay of the δ-180(x)-δ CPMG block, are converted into R2* via:
 |
1 |
I(νCPMG) is the peak intensity in the spectrum recorded at νCPMG and I0 is the peak intensity in the reference spectrum obtained by omitting the CPMG intervals (i.e., for TCP = 0 ms). The relaxation dispersion profiles R2*(νCPMG) are then used to extract conformational exchange parameters.
NMR experiments were carried out on 11.7, 14.1, and 18.8 T Varian Inova spectrometers at 25.7, 35.4, and 44.8°C. For each temperature and magnetic field, a series of two-dimensional (2D) spectra were recorded with TCP = 60 ms and different νCPMG frequencies, followed by a reference spectrum with TCP = 0. The spectra were collected in interleaved manner (Orekhov et al. 1999) with a delay of 2.5 s between the scans. To minimize off-resonance effects (Korzhnev et al. 2000), the 15N 180° pulses in the CPMG pulse train were applied at a high field of 6.5 kHz. The spectra were zero-filled to 8k × 2k and Fourier transformed with Gaussian and sine-bell weighting functions applied along the 1H and 15N dimensions, respectively. The cross-peak intensities were obtained using the MUNIN approach (Orekhov et al. 2001), that is, by three-way decomposition of a 3D data set composed of the series of 2D spectra (Korzhnev et al. 2001b). The resulting relaxation dispersion profiles R2*(νCPMG) comprise 12 (11.7, 14.1 T) or 14 (18.8 T) points with νCPMG varied from 33.3 to 800 Hz. For each combination of magnetic field and temperature, uncertainties in R2* were estimated using spectra recorded twice for at least three values of νCPMG. To account for possible systematic biases affecting peak intensities, uncertainties in R2* were set to at least 1.5%.
Analysis of relaxation dispersion data for individual nuclei
Relaxation dispersion profiles resulting from 15N CPMG experiment were analyzed for each nucleus to obtain chemical shift differences for the spin in each of the exchanged conformations as well as the rates of interconversion between the states. In practice, interpretation of relaxation dispersion data requires a priori assumptions about the exchange process. Usually, one accepts the simplest model of reversible transitions between two states A and B with a frequency difference Δω = σexωN, where σex is the chemical shift difference and ωN is the Larmor frequency of the 15N nucleus. Several closed-form analytic expressions were proposed to approximate the rate of decay for CPMG echoes for a nucleus undergoing two-state chemical exchange (Luz and Meiboom 1963; Bloom et al. 1965; Carver and Richards 1972). For fast exchange (kex/Δω>>1, where kex = kA + kB, and kA and kB are forward and reverse rate constants, respectively), one can, for example, apply the equation of (Bloom et al. 1965) using a modification described in reference (Orekhov et al. 1994):
 |
2 |
The populations of the states in exchange are pA and pB, δ is the delay of the δ-180(x)-δ CPMG block, R2 = pAR2A+pBR2B, with R2A and R2B being the transverse relaxation rates in the two states. A general expression proposed by (Carver and Richards 1972) and modified by (Davis et al. 1994) extends the applicability to CPMG data describing fast and intermediate (kex/Δω∼1) exchange regimes with unequally populated conformations:
 |
3 |
where
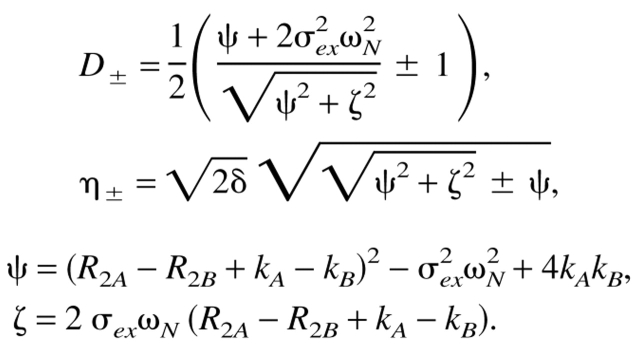 |
Exchange effects in the CPMG experiments were investigated for individual residues of azurin, provided that detectable cross-peaks of backbone 1H-15N groups are observed. Residues with spectral overlap at any of the three temperatures were not considered; this eliminates 18 residues. At each temperature and for each resonance, the relaxation dispersion profiles obtained at three magnetic fields were analyzed using two models. A simple model with no dependence of apparent transverse relaxation rates on νCPMG was opposed to a model assuming conformational exchange between two states, for which equal relaxation rates are assumed, that is, R2A = R2B. The former model includes three adjustable parameters, the effective transverse relaxation rates R2 at 11.7, 14.1, and 18.8 T. The latter, based on the expression by Carver and Richards (equation 3), depends on six parameters: R2 (= R2A = R2B) at 11.7, 14.1, and 18.8 T, the rate constants kA and kB and the chemical shift difference σex. The model parameters were extracted from least square fitting of the experimental relaxation dispersion data by the theoretical expressions. Minimization was carried out using the Levenberg-Marquart algorithm (Press 1997). Uncertainties of the optimized model parameters were estimated using the covariance matrix method. Those residues that satisfy the following three statistical criteria for at least two temperatures were considered to be involved into conformational exchange and were kept for further analysis. (1) The simple model is rejected on a 95% confidence level based on χ2 statistics, that is, on the quality with which the model fits the data. (2) The exchange model cannot be rejected on a 95% confidence level. (3) The F-test confirms the significance for the χ2 reduction upon transition form simple to exchange model with at least 90% confidence.
The selected residues of azurin were classified into groups based on the forward kA and reverse kB rate constants determined for individual 15N nuclei, provided that the parameters are estimated with sufficient precision (i.e., the value exceeds the anticipated uncertainty). To check the group compactness the resulting groups of residues were mapped to the 3D structure of azurin (Nar et al. 1991; PDB-code 4AZU).
Data analysis for residue groups involved in a single exchange process
Assuming that a single exchange process in the millisecond-second time scale modulates the chemical shifts of multiple nuclei, the joint processing of all relaxation dispersion data for these residues should result in a considerable improvement of the precision of the estimated kA and kB values (Mulder et al. 2001a). In this case, the optimized model based on the equation by Carver and Richards (equation 3) includes two parameters common for all residues, the forward and reverse rate constants kA and kB. The additional parameters, the chemical shift differences σex, and the effective transverse relaxation rates R2 (= R2A = R2B) at all magnetic fields are characteristic for each nucleus. The relaxation dispersion data for sets of residues were processed jointly following the procedure described for individual residues.
Acknowledgments
This work was supported by NFR grant K-AA/KU 12071–302 and a post-doctoral fellowship from the Wenner-Gren Foundation to D.M.K. All NMR experiments were performed at the Swedish NMR Centre.
The publication costs of this article were defrayed in part by payment of page charges. This article must therefore be hereby marked “advertisement” in accordance with 18 USC section 1734 solely to indicate this fact.
Article and publication are at http://www.proteinscience.org/cgi/doi/10.1110/ps.0225403.
References
- Adman, E.T. 1991. Copper protein structures. Adv. Protein Chem. 42 145–197. [DOI] [PubMed] [Google Scholar]
- Akke, M. and Palmer, A.G. 1996. Monitoring macromolecular motions on microsecond to millisecond time scales by R1-Rho - R1 constant relaxation time NMR spectroscopy. J. Am. Chem. Soc. 118 911–912. [Google Scholar]
- Bertini, I., Bryant, D.A., Ciurli, S., Dikiy, A., Fernandez, C.O., Luchinat, C., Safarov, N., Vila, A.J., and Zhao, J.D. 2001. Backbone dynamics of plastocyanin in both oxidation states—Solution structure of the reduced form and comparison with the oxidized state. J. Biol. Chem. 276 47217–47226. [DOI] [PubMed] [Google Scholar]
- Bloom, M., Reeves, L.W., and Wells, E.J. 1965. Spin echoes and chemical exchange. J. Chem. Phys. 42 1615–1624. [Google Scholar]
- Branden, C. and Tooze, A. 1999. Introduction to protein structure, Garland Publishing, New York.
- Carver, J.P. and Richards, R.E. 1972. A general two-site solution for the chemical exchange produced dependence of T2 upon the Carr-Pursell pulse separation. J. Magn. Reson. 6 89–105. [Google Scholar]
- Davis, D.G., Perlman, M.E., and London, R.E. 1994. Direct measurements of the dissociation rate constant for inhibitor-enzyme complexes via the T1-Rho and T2 (CPMG) methods. J. Magn. Reson. Ser. B 104 266–275. [DOI] [PubMed] [Google Scholar]
- Denisov, V.P., Peters, J., Horlein, H.D., and Halle, B. 1996. Using buried water molecules to explore the energy landscape of proteins. Nat. Struct. Biol. 3 505–509. [DOI] [PubMed] [Google Scholar]
- DiBilio, A.J., Hill, M.G., Bonander, N., Karlsson, B.G., Villahermosa, R.M., Malmström, B.G., Winkler, J.R., and Gray, H.B. 1997. Reorganization energy of blue copper: Effects of temperature and driving force on the rates of electron transfer in ruthenium- and osmium-modified azurins. J. Am. Chem. Soc. 119 9921–9922. [Google Scholar]
- Farrow, N.A., Zhang, O.W., Forman-Kay, J.D., and Kay, L.E. 1994. A heteronuclear correlation experiment for simultaneous determination of N-15 longitudinal decay and chemical-exchange rates of systems in slow equilibrium. J. Biomol. NMR 4 727–734. [DOI] [PubMed] [Google Scholar]
- Ferry, J.D., Grandine, L.D., and Fitzgerald, E.R. 1953. The relaxation distribution function of polyisobutylene in the transition from rubber-like to glass-like behavior. J. Appl. Phys. 24 911–916. [Google Scholar]
- Gray, H.B., Malmström, B.G., and Williams, R.J.P. 2000. Copper coordination in blue proteins. J. Biol. Inorg. Chem. 5 551–559. [DOI] [PubMed] [Google Scholar]
- Henderson, R., Baldwin, J.M., Ceska, T.A., Zemlin, F., Beckmann, E., and Downing, K.H. 1990. Model for the structure of bacteriorhodopsin based on high- resolution electron cryomicroscopy. J. Mol. Biol. 213 899–929. [DOI] [PubMed] [Google Scholar]
- Ishima, R. and Torchia, D.A. 1999. Estimating the time scale of chemical exchange of proteins from measurements of transverse relaxation rates in solution. J. Biomol. NMR 14 369–372. [DOI] [PubMed] [Google Scholar]
- Ishima, R., Louis, J.M., and Torchia, D.A. 1999. Transverse C-13 relaxation of CHD2 methyl isotopmers to detect slow conformational changes of protein side chains. J. Am. Chem. Soc. 121 11589–11590. [Google Scholar]
- Jeffrey, P.D., Ruso, A.A., Polyak, K., Gibbs, E., Hurwitz, J., Massague, J. and Pavletich, N.P. 1995. Mechanism of CDK activation revealed by the structure of a cyclina-CDK2 complex. Nature 376 313–320. [DOI] [PubMed] [Google Scholar]
- Kalverda, A.P., Ubbink, M., Gilardi, G., Wijmenga, S.S., Crawford, A., Jeuken, L.J.C., and Canters, G.W. 1999. Backbone dynamics of azurin in solution: Slow conformational change associated with deprotonation of histidine 35. Biochemistry 38 12690–12697. [DOI] [PubMed] [Google Scholar]
- Karlsson, B.G., Pascher, T., Nordling, M., Arvidsson, R.H.A., and Lundberg, L.G. 1989. Expression of the blue copper protein azurin from Pseudomonas aeruginosa in Escherichia coli. FEBS Lett. 246 211–217. [DOI] [PubMed] [Google Scholar]
- Korzhnev, D.M., Tischenko, E.V., and Arseniev, A.S. 2000. Off-resonance effects in N-15 T-2 CPMG measurements. J. Biomol. NMR 17 231–237. [DOI] [PubMed] [Google Scholar]
- Korzhnev, D.M., Billeter, M., Arseniev, A.S., and Orekhov, V.Y. 2001a. NMR studies of Brownian tumbling and Internal motions in proteins. Prog. Nucl. Magn. Reson. Spectrosc. 38 197–266. [Google Scholar]
- Korzhnev, D.M., Ibraghimov, I.V., Billeter, M., and Orekhov, V.Y. 2001b. MUNIN: Application of three-way decomposition to the analysis of heteronuclear NMR relaxation data. J. Biomol. NMR 21 263–268. [DOI] [PubMed] [Google Scholar]
- Leckner, J., Wittung, P., Bonander, N., Karlsson, B.G., and Malmström, B.G. 1997. The effect of redox state on the folding free energy of azurin. J. Biol. Inorg. Chem. 2 368–371. [Google Scholar]
- Lipari, G. and Szabo, A. 1982. Model-free approach to the interpretation of nuclear magnetic resonance relaxation in macromolecules. 1. Theory and range of validity. J. Am. Chem. Soc. 104 4546–4559. [Google Scholar]
- Loria, J.P., Rance, M., and Palmer, A.G. 1999. A relaxation-compensated Carr-Purcell-Meiboom-Gill sequence for characterizing chemical exchange by NMR spectroscopy. J. Am. Chem. Soc. 121 2331–2332. [Google Scholar]
- Luz, Z. and Meiboom, S. 1963. Nuclear magnetic resonance study of the protolysis of trimethylammonium ion in aqueous solution—order of the reaction with respect to solvent. J. Chem. Phys. 39 366–370. [Google Scholar]
- Malmström, B.G. 1964. In Oxidized and related redox systems (eds. T.E. King et al.), pp. 207–216. Wiley, New York.
- ———. 1994. Rack-induced bonding in blue-copper proteins. Eur. J. Biochem. 223 711–718. [DOI] [PubMed] [Google Scholar]
- Millet, O., Loria, J.P., Kroenke, C.D., Pons, M., and Palmer, A.G. 2000. The static magnetic field dependence of chemical exchange linebroadening defines the NMR chemical shift time scale. J. Am. Chem. Soc. 122 2867–2877. [Google Scholar]
- Montelione, G.T. and Wagner, G. 1989. 2D chemical-exchange NMR spectroscopy by proton-detected heteronuclear correlation. J. Am. Chem. Soc. 111 3096–3098. [Google Scholar]
- Mulder, F.A.A., Mittermaier, A., Hon, B., Dahlquist, F.W., and Kay, L.E. 2001a. Studying excited states of proteins by NMR spectroscopy. Nat. Struct. Biol. 8 932–935. [DOI] [PubMed] [Google Scholar]
- Mulder, F.A.A., Skrynnikov, N.R., Hon, B., Dahlquist, F.W., and Kay, L.E. 2001b. Measurement of slow (ms-ms) time scale dynamics in protein side chains by N-15 relaxation dispersion NMR spectroscopy: Application to Asn and Gln residues in a cavity mutant of T4 lysozyme. J. Am. Chem. Soc. 123 967–975. [DOI] [PubMed] [Google Scholar]
- Nar, H., Messerschmidt, A., Huber, R., Vandekamp, M., and Canters, G.W. 1991. Crystal-structure analysis of oxidized Pseudomonas aeruginosa azurin at pH 5.5 and pH 9.0—a pH-induced conformational transition involves a peptide-bond flip. J. Mol. Biol. 221 765–772. [DOI] [PubMed] [Google Scholar]
- ———. 1992. Crystal-structure of Pseudomonas aeruginosa apo-azurin at 1.85 angstrom resolution. FEBS Lett. 306 119–124. [DOI] [PubMed] [Google Scholar]
- Orekhov, V.Y., Pervushin, K.V., and Arseniev, A.S. 1994. Backbone dynamics of (1–71)-bacterioopsin studied by two-dimensional H1-N15 NMR spectroscopy. Eur. J. Biochem. 219 887–896. [DOI] [PubMed] [Google Scholar]
- Orekhov, V.Y., Korzhnev, D.M., Diercks, T., Kessler, H., and Arseniev, A.S. 1999. H-1-N-15 NMR dynamic study of an isolated α-helical peptide (1–36)-bacteriorhodopsin reveals the equilibrium helix-coil transitions. J. Biomol. NMR 14 345–356. [Google Scholar]
- Orekhov, V.Y., Ibraghimov, I.V., and Billeter, M. 2001. MUNIN: A new approach to multi-dimensional NMR spectra interpretation. J. Biomol. NMR 20 49–60. [DOI] [PubMed] [Google Scholar]
- Palmer, A.G., Williams, J., and McDermott, A. 1996. Nuclear magnetic resonance studies of biopolymer dynamics. J. Phys. Chem. 100 13293–13310. [Google Scholar]
- Palmer, A.G., Kroenke, C.D., and Loria, J.P. 2001. Nuclear magnetic resonance methods for quantifying microsecond-to-millisecond motions in biological macromolecules. Methods Enzymol. 339 204–238. [DOI] [PubMed] [Google Scholar]
- Press, W.H. 1997. Numerical recipes in C: The art of scientific computing, 2nd rev. edition, Cambridge University Press, Cambridge, UK.
- Ryde, U., Olsson, M.H.M., Pierloot, K., and Roos, B.O. 1996. The cupric geometry of blue copper proteins is not strained. J. Mol. Biol. 261 586–596. [DOI] [PubMed] [Google Scholar]
- Schirmer, T. and Evans, P.R. 1990. Structural basis of the allosteric behavior of phosphofructokinase. Nature 343 140–145. [DOI] [PubMed] [Google Scholar]
- Shepard, W.E.B., Anderson, B.F., Lewandoski, D.A., Norris, G.E., and Baker, E.N. 1990. Copper coordination geometry in azurin undergoes minimal change on reduction of copper(II) to copper(I). J. Am. Chem. Soc. 112 7817–7819. [Google Scholar]
- Skrynnikov, N.R., Mulder, F.A.A., Hon, B., Dahlquist, F.W., and Kay, L.E. 2001. Probing slow time scale dynamics at methyl-containing side chains in proteins by relaxation dispersion NMR measurements: Application to methionine residues in a cavity mutant of T4 lysozyme. J. Am. Chem. Soc. 123 4556–4566. [DOI] [PubMed] [Google Scholar]
- Szyperski, T., Luginbühl, P., Otting, G., Güntert, P., and Wüthrich, K. 1993. Protein dynamics studied by rotating frame N15 spin relaxation times. J. Biomol. NMR 3 151–164. [DOI] [PubMed] [Google Scholar]
- Tollinger, M., Skrynnikov, N.R., Mulder, F.A.A., Forman-Kay, J.D., and Kay, L.E. 2001. Slow dynamics in folded and unfolded states of an SH3 domain. J. Am. Chem. Soc. 123 11341–11352. [DOI] [PubMed] [Google Scholar]
- Wang, C.Y., Grey, M.J., and Palmer, A.G. 2001. CPMG sequences with enhanced sensitivity to chemical exchange. J. Biomol. NMR 21 361–366. [DOI] [PubMed] [Google Scholar]
- Wider, G., Neri, D., and Wüthrich, K. 1991. Studies of slow conformational equilibria in macromolecules by exchange of heteronuclear longitudinal 2-spin-order in a 2D difference correlation experiment. J. Biomol. NMR 1 93–98. [Google Scholar]