Abstract
The effect of pressure on the heme environment structure of sperm whale and horse heart metcyanomyoglobins was investigated up to 300 MPa by high-pressure 1H NMR spectroscopy. Pressure-induced changes in the distances between the observed protons and the heme iron atom were estimated from changes in the dipolar shift due to the paramagnetic effect on the protons. The changes showed that the heme peripheral structure as a whole was compressed by pressure; the movements of the protons in the heme peripheral residues were in the range of +0.16 to −0.54 Å/300 MPa. One-dimensional compressibilities for the protons, excluding the protons of the distal His residue, were in the range of 1.0 × 10⁻⁴ to 6.1 × 10⁻⁴/MPa. The movements of the protons induced by pressure correlated well with the distance between the protons and cavities in the protein. The distal His residue (His 64) moved toward the outside of the heme pocket, but remained in the pocket even at 300 MPa. This movement was driven dominantly by a change in the dihedral angle around the Cα–Cβ rotational bond of the residue. Comparative work on horse heart metcyanomyoglobin implied that the conformational change of the His 64 imidazole ring was larger in the horse heart metcyanomyoglobin than in the sperm whale metcyanomyoglobin.
Keywords: NMR, pressure effect, myoglobin, paramagnetic shift, compressibility
Myoglobin (Mb) is one of the hemeproteins present in muscle tissue, which, due to the reversible binding of an oxygen molecule, acts as an oxygen-storing protein. The function of Mb is closely related to interactions between a ligand molecule and the heme peripheral amino acid residues (Emerson and La Mar 1990a, b; Springer et al. 1994). Changes in conditions such as pH, temperature, and pressure perturb the heme environment and then influence the function of Mb. Pressure is an especially valuable perturbation because it can affect the interactions between the ligand molecule and the peripheral amino acid residues through a volume change of the system, which is directly related to the structural change. For instance, the rebinding kinetics of ligand molecules (e.g., oxygen and carbon monoxide) to myoglobin and hemoglobin are sensitive to pressure (Adachi and Morishima 1989). This means that the rebinding reaction is accompanied by a significant volume (structural) change in the system. Therefore, site-specific analysis of the pressure-induced structural changes in the heme peripheral amino acid residues is of importance for understanding the structure-function relationship of the protein. However, due to the technical difficulty, there have only been a small number of microscopic studies of the effect of pressure on protein structures. This research field has been accelerated recently by some marked improvements in techniques, that is, high pressure NMR with a high field magnet (Jonas and Jonas 1994; Jonas et al. 1998; Akasaka et al. 1999; Inoue et al. 2000; Kitahara et al. 2000, 2001, 2002a, b; Lassalle et al. 2000; Akasaka and Li 2001), high pressure SAXS with synchrotron radiation (Kato and Fujisawa 1998; Panick et al. 1998; Fujisawa et al. 1999), and Fourier transform high-pressure infrared spectroscopy (Frauenfelder et al. 1990; Takeda et al. 1995; Dzwolak et al. 1999, 2002).
NMR spectroscopy is a powerful technique for studying the structures of proteins in solution. Typically, distance constraints obtained from nuclear Overhauser effect (NOE) measurements are used to determine the tertiary structures of proteins. However, it is difficult to obtain reliable long-range distance information, because the magnitude of NOE changes to the inverse sixth power of the distance. In the case of hemeproteins, using the dipolar shift is advantageous, as it includes longer-range distance information than the NOE data, because its magnitude decreases to the inverse third power of the distance (Bertini and Felli 2001). Therefore, we can determine changes in the orientations of residues around the paramagnetic metal more accurately (Bentrop et al. 1997; Bertini and Felli 2001). Pressure-induced structural changes in hemeproteins have been investigated by high-pressure NMR spectroscopy using a capillary type of high-pressure glass cell (Morishima et al. 1980; Morishima and Hara 1983).
The purpose of this work is to propose a quantitative and extensive description of the pressure-induced structural changes around the active site of metcyanomyoglobin (MbCN). 1H NMR spectra of MbCN were measured using a high-pressure NMR probe up to 300 MPa. Pressure-induced changes in the distances between the paramagnetic iron and the residue protons were determined by use of distance constraints based on the dipolar shift. On the basis of the data, we first analyze the movement of individual protons and describe in particular the behavior of the distal His residue under pressure in detail. Finally, we discuss a correlation between the movements of the protons induced by pressure and cavities in the protein.
Results
First, we describe a relationship between chemical shifts and the geometrical parameters of protons, and then we estimate pressure-induced changes in the positions of the protons using the current observed data.
In the case of paramagnetic compounds, the observed chemical shift (δobs) is given by the sum of the diamagnetic (δdia) and paramagnetic (δpara) contributions:
 |
1 |
The contribution of δdia comes from the electrostatic and ring current effects. The contribution of δpara, due to unpaired electron effects of the iron atom, is divided into the contact (δcon) and the dipolar (δdip) shifts:
 |
2 |
The contact shift is observable only for a proton on which unpaired electrons of the iron atom are delocalized. In the case of noncoordinated amino acid residues (δcon = 0), therefore, δobs is given by
 |
3 |
Moreover, the effect of pressure on δdia is relatively negligible, as the change in δdia induced by pressure up to 200 MPa (Δδdia) is normally < 0.10 ppm for all protons except amide protons (Akasaka et al. 1997; Li et al. 1999; Yu et al. 1999; Iwadate et al. 2001). The largest shifts of 0.1–0.16 ppm induced by pressure of 200 MPa have been observed for the protons (except amid protons) in the vicinity of the Trp residue (Akasaka et al. 1997). Unfortunately, there have been no reports concerning the pressure effect on the heme ring current contribution. Here, it is assumed that the pressure effect on δdia is negligible. Thus, a change in the δobs of noncoordinated residues (0.20–3.9 ppm/300 MPa) is attributed dominantly to the dipolar contribution (δdip). Here, we used chemical shifts observed in carbonmonoxymyoglobin (MbCO) at 0.1 MPa, which are isostructural diamagnetic shifts [δdia(MbCO)], as δdia at 0.1 MPa in Equation 3 (Dalvit and Wright 1987; Emerson and La Mar 1990a). Thus, the observed chemical shift at a certain pressure is given practically by the sum of δdip and a constant [=δdia(MbCO) at 0.1 MPa]:
 |
4 |
Furthermore, the dipolar contribution, which results from the anisotropic magnetic moment of the iron atom, is given by the following function of the polar coordinates (r, θ, φ) of the targeted proton when the magnetic susceptibility χ is diagonal in the coordinate system
 |
5 |
in which Δχax (2198 × 10−12m3/mole) and Δχrh (−573 × 10−12m3/mole) are the axial and rhombic magnetic anisotropies, respectively (Emerson and La Mar 1990b, and N is Avogadro’s number. In this study, we used the magnetic coordinate system determined by Emerson and La Mar (1990b), in which the magnetic z-axis corresponds to a straight line through the iron atom and the His 93 Cα atom, tilted ∼15° from the heme normal to the heme δ-meso position.
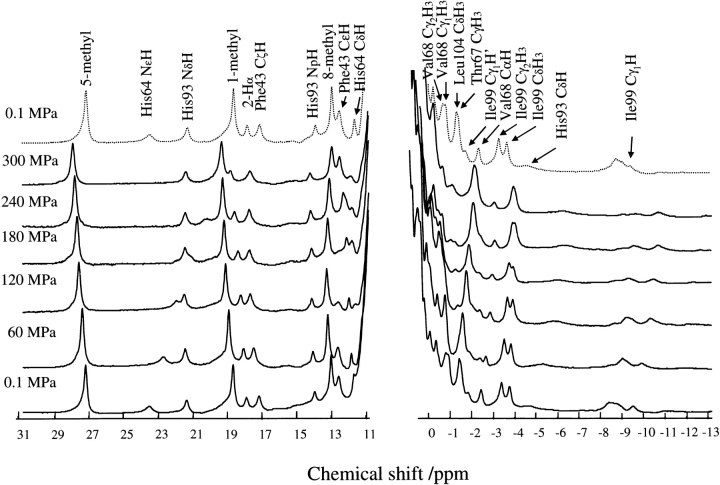
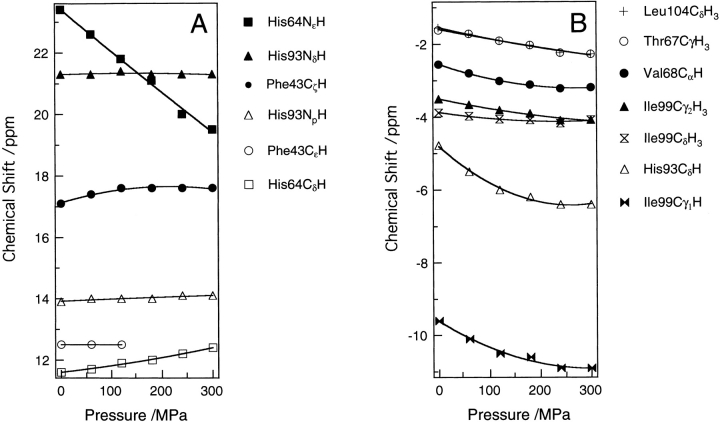
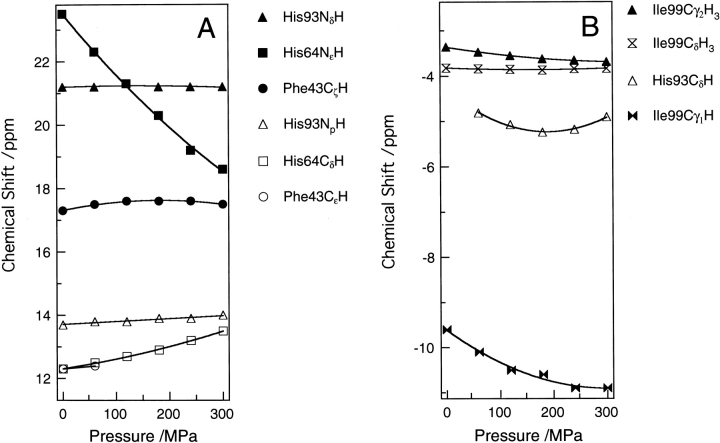
Figure 1 ▶ demonstrates the effect of pressure on the 1H NMR spectra of sperm whale metcyanomyoglobin (SWMbCN) up to 300 MPa at pH 7.5 and 25°C. Assignment of their chemical shifts was based on two-dimensional DQF-COSY spectra (data not shown) and published data (Emerson and La Mar 1990a,b). The spectrum at 0.1 MPa after pressure release was almost identical to the initial (before pressurizing) spectrum. The pressure effect on the protein up to 300 MPa was practically reversible. Figure 2 ▶ shows the pressure dependence of the chemical shifts of individual proton signals of amino acid residues. For comparison, we performed a similar experiment for horse heart metcyanomyoglobin (HHMbCN). The results are shown in Figure 3 ▶. In the following analysis, we focus on the results for SWMbCN.
Figure 1.
Pressure dependence of 1H NMR spectra in the downfield and upfield region for 3 mM sperm whale MbCN in 0.1 M Tris-HCl buffer (90% H2O/10% D2O) at pH 7.5 and 25°C. Signal assignments are made at 0.1 MPa on DQF-COSY by reference to the assignments of Emerson and La Mar (1990a,b). The spectrum shown by the broken line was obtained at 0.1 MPa after releasing the pressure from 300 to 0.1 MPa.
Figure 2.
Pressure dependence of chemical shifts of the proton signals in the (A) downfield and (B) upfield regions for sperm whale MbCN. The data for Phe 43/CD1 CɛH are available only up to 120 MPa, as the peak could not be detected due to the band broadening.
Figure 3.
Pressure dependence of chemical shifts of the proton signals in the (A) downfield and (B) upfield regions for horse heart MbCN as a function of pressure. The horse heart MbCN is in 0.1 M Tris-HCl buffer (90%H2O/10%D2O) at pH 8.6 and 25°C.
As described above, a change in the chemical shift arises dominantly from a change in the dipolar shift, which is a function of the relative position of the proton to the heme iron, Δδobs = Δδdip(Δr, Δθ, Δφ). However, it is difficult to determine the three variables (Δr, Δθ, Δφ) rigorously from an observable parameter of Δδobs. To estimate the magnitude of the pressure-induced movements of protons, we calculated the change in each variable according to Equation 5, when the other variables were constant.
In Table 1, we summarize the chemical shifts at 0.1 MPa (1 atm) and 300 MPa, and the calculated values of Δr, Δθ and Δφ. The values of Δr, Δθ, and Δφ are the changes in r, θ, and φ, respectively, induced by an increase in pressure of 300 Mpa, when the other variables are constant. The movements in the direction of r, θ, and φ are thus given by Δr, rΔθ, and (rsinθ)Δφ, respectively. A few data indicated exceptionally large values of more than 1.3 Å. They could be realistically impossible. All of the unacceptable and failed calculations occurred for the angular changes.
Table 1.
Chemical shifts (ppm) for sperm whale MbCN (pH 7.5) at 0.1 and 300 MPa, and calculated movements of noncoordinated heme peripheral amino acid residues’ protons for the magnetic coordinate system
| δobs | δdipa | rbÅ | θb/deg. | φb/dg. | ||||||||||
| Residue | Position | 0.1 MPa | 300 MPa | 0.1 MPa | 300 MPa | 0.1 MPa | 300 MPa | 0.1 MPa | 300 MPa | 0.1 MPa | 300 MPa | Δrc/Å | rΔθc/Å | rΔφsinθc/Å |
| Phe 43/CD1 | CζH | 17.1 | 17.6 | 12.4 | 12.9 | 4.72 | 4.61 | 146.0 | 147.4 | 5.9 | 34.3 | −0.11 ± 0.00 | 0.12 ± 0.02 | 1.31 ± 0.03 |
| His 64/E7 | CδH | 11.6 | 12.4 | 6.63 | 7.43 | 6.04 | 5.89 | 169.0 | f | 161.2 | f | −0.15 ± 0.01 | f | f |
| NɛH | 23.4 | 19.5 | 19.5 | 15.6 | 3.71d | 3.87 | e | e | e | e | 0.16 ± 0.00 | e | e | |
| Thr 67/E10 | CγH3 | −1.62 | −2.28 | −3.13 | −3.79 | 7.18 | 6.81 | 104.7 | 93.8 | 174.2 | f | −0.37 ± 0.02 | −1.37 ± 0.05 | f |
| Val 68/E11 | CαH | −2.56 | −3.19 | −5.80 | −6.43 | 5.48 | 5.30 | 106.0 | 102.6 | 140.2 | 147.3 | −0.18 ± 0.01 | −0.33 ± 0.01 | 0.65 ± 0.03 |
| Ile 99/FG5 | Cγ1H | −9.60 | −10.9 | −9.32 | −10.6 | 4.88 | 4.55 | 61.0 | 63.6 | 19.8 | f | −0.33 ± 0.01 | 0.22 ± 0.02 | f |
| Cγ2H3 | −3.51 | −4.08 | −4.79 | −5.29 | 7.09 | 6.83 | 78.9 | f | 4.8 | f | −0.26 ± 0.01 | f | f | |
| CδH3 | −3.88 | −4.08 | −5.35 | −5.55 | 5.70 | 5.65 | 86.2 | f | 26.5 | 23.1 | −0.05 ± 0.01 | f | −0.34 ± 0.03 | |
| Leu 104/G5 | CδH3 | −1.56 | −2.28 | −2.79 | −3.51 | 6.22 | 5.68 | 63.7 | 67.2 | 40.9 | 27.1 | −0.54 ± 0.02 | 0.38 ± 0.02 | −1.34 ± 0.04 |
a Dipolar shift calculated according to Eq. 4.
b The present coordinate system is based on the magnetic axes determined by Emerson and LaMar (1990b). Polar coordinates for all of the protons except His 64/E7 NɛH proton at an atmospheric pressure were obtained from the neutron crystal coordinates of MbCO (Cheng et al. 1990).
c Differences between the values at 0.1 and 300 MPa. Errors arise from the experimental errors of ± 0.03 ppm in the chemical shifts.
d Obtained from the published data for SWMbCN at pH 8.0 and 25°C (Emerson and LaMar 1990a).
e Because there have been no available angular coordinates at an atmospheric pressure, it was impossible to calculate changes in the corresponding coordinates.
f Calculations were failed (see the text).
There are two reasons for the above failure. The first reason is due to a special character of Equation 5. According to Equation 5, δdip is a monotonous function to r, but this is not the case when angular variables are regarded. A triangle function gives a plateau around a maximum or a minimum. When the obtained δdip is around this, δdip is insensitive to a change in the angular parameter. Conversely, a small change in δdip can lead to an unusually large change in the angular variable. In the worst case, we failed to estimate the angular movements. The possible range of the dipolar shift with respect to cos2θ, sin2θ, or cos2φ is mathematically limited. If the value of the observed dipolar shift is beyond the range, Equation 5 gives no solution for the angular variable.
The second reason is related to the essential issue of pressure-induced contraction of a protein. If the contraction of the protein is isotropic, the values of θ and φ are not changed, although it is not realistic to expect that the contraction of the protein is perfectly isotropic. Anisotoropic deformation has been observed locally for lysozyme by use of X-ray diffraction (Kundrot and Richards 1987). It seems acceptable that a protein as a whole is contracted by pressure, although anisotropic contraction occurs in some local regions. Therefore, among Δr, rΔθ, and (rsinθ)Δφ, Δr should be the major contributor to the deformation by pressure. Conversely, if the movement by pressure is isotropic, the calculated rΔθ and (rsinθ)Δφ can become unusually large or the calculation can give no solutions. This may be a significant cause for unacceptable and failed estimates of the angular changes.
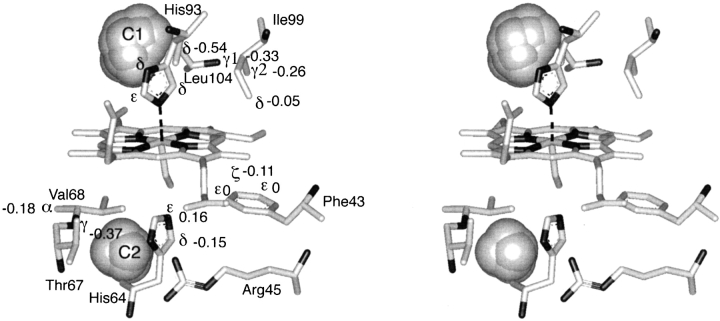
Hence, estimates of rΔθ and (rsinθ)Δφ are not reliable. Although the estimates of Δr are not always equal to the true movements, they are acceptable as approximate quantities. We have summarized the movements of Δr induced by pressure of 300 MPa for the targeted protons with an illustration of the heme environment as shown in Figure 4 ▶.
Figure 4.
Heme environmental structure of sperm whale MbCO (PDB:2mb5). Protons are hidden for simplification. The values beside the Greek letters are the changes in the estimated distances between the observed protons and the heme iron induced by pressure of 300 MPa, as listed in Table 1. The value of 0 for Phe 43/CD1 CɛH is expected from no pressure dependence of the chemical shift up to 120 MPa as shown in Figure 2 ▶. The locations of the cavities were calculated by the program GRASP (Nicholls et al. 1991) with a probe radius of 1.4 Å (gray spheres). The largest and second largest cavities, which are termed cavity 1(C1) and cavity 2(C2), are on opposite sides of the heme iron atom. Cavities C1 and C2 correspond to the xenon-binding cavities 1 and 4, respectively, reported by Tilton, Jr., et al. (1984) and Tilton, Jr., and Petsuko (1988).
Discussion
The influence of pressure on protons of individual residues
First, we focus our discussion on the His 64 residue, which is one of the most important residues controlling the ligand-binding reactions of myoglobin. Changes in the chemical shifts of His 64 NɛH and CδH protons are relatively large as shown in Figures 1 ▶ and 2 ▶. The behavior of His 64 NɛH agrees with previous high-pressure work up to 110 MPa by Morishima and Hara (1983), although no previous data is available for His 64 CδH. These authors proposed the hypothesis that the His 64 of MbCN swings away on the basis of the large spectral shift. The present calculation of Δr = 0.16 Å for His 64 NɛH is not large enough to support this hypothesis, even at 300 MPa, in terms of the averaged structure. Furthermore, the negative sign of Δr (−0.15 Å) for His 64 CδH suggests that the pressure-induced movement of the residue is not simple translational displacement. This leads us to consider rotational displacement of the residue.
For a detailed description of the displacement, we calculated the distances of the protons from the iron atom as a function of the dihedral angles of two rotational bonds adjacent to the His 64 imidazole ring. Figure 5 ▶ illustrates the plots for the distances of the two protons versus the dihedral angles, χ1 (Fig. 5A ▶) and χ2 (Fig. 5B ▶) around the Cα–Cβ and Cβ–Cγ rotational bonds, respectively. The arrows in the figure point to the dihedral angles obtained from the crystal structure at atmospheric pressure (Cheng and Schoenborn 1990). The pressure-induced movements of His 64, Δr = 0.16 Å for NɛH and Δr = −0.15 Å for CδH can be explained only by an increase in the dihedral angle χ1. Thus, it is likely that the changes in r for the protons of His 64 dominantly reflect the change in χ1. On the basis of Figure 5A ▶, we estimate a change in the His 64 χ1 angle of about +10°, induced by a pressure of 300 MPa. This pressure-induced positive change in the His 64 χ1 angle is consistent with the possibility that the His 64 imidazole ring moves toward the outside of the heme pocket. Such rotational motion of the His 64 imidazole ring is crucial for ligand entry into the protein molecule, as the crystal structure of Mb has no pathway leading a ligand molecule to the active center (Takano 1977). The present observation for the pressure-induced movement of His 64 can explain an increase in the CO rebinding rate induced by pressure (Adachi and Morishima 1989).
Figure 5.
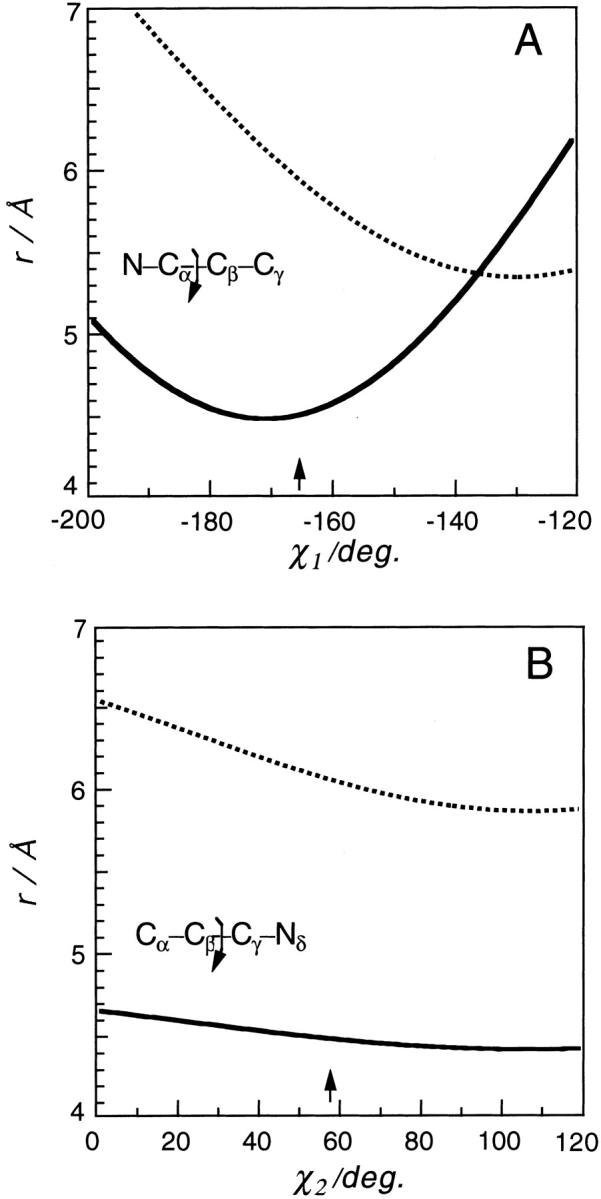
Plots of the distances of His 64 NɛH (solid line) and His 64 CδH (broken line) from the heme iron atom vs. (A) the dihedral angle around the Cα–Cβ (χ1) rotational bond, and (B) the dihedral angle around the Cβ–Cγ (χ2) rotational bond. The distances between the targeted protons and the iron atom were calculated by the program MOLMOL using the neutron data of Cheng and Schoenborn (1990) (PDB:2mb5). Arrows in the figure indicate the dihedral angles of MbCO in the crystal at atmospheric pressure (PDB:2mb5).
It has been ascertained by spectroscopic studies of MbCO (Shimada and Caughey 1982; Ray et al. 1994) that there are possibly several conformations of the His 64 residue in solution. Yang and Phillips, Jr. (1996) have shown that there are two major conformations of Mb, open and closed, by an X-ray crystallography study at various pH values. The His 64 χ1 angle of the open conformation at neutral pH is larger by ∼100° than that of the closed one at acidic pH. Thus, there are two possible interpretations of the pressure effect on the χ1 angle. One is a shift of the conformational equilibrium. The other is a change in the angle of each conformer. However, the present work cannot clarify this issue, as the time resolution of NMR is not sufficient to distinguish the conformers.
We also observed other residues in the E helix, Thr 67 (E10), and Val 68 (E11). The values of Δr for the protons of Thr 67 Cγ1H3 and Val 68 CαH became negative (Table 1). On the basis of the negative Δr changes of the protons of the residues, including a backbone proton, it is likely that the E helix moves toward the iron atom under pressure.
Next, we discuss the Phe 43 (CD1) para-proton and meta-protons observed at 17.1 and 12.5 ppm, respectively (Fig. 1 ▶). The para-proton peak exhibits a 0.5-ppm chemical shift change toward the downfield with an increase in pressure of 300 MPa (Fig. 2 ▶), which corresponds to ∼0.1 Å movements toward the iron atom (Table 1). An interesting result is that the meta-protons peak exhibits a tendency to broaden. The single peak for two meta-protons means that the flip-flop motion of Phe 43 is rapid enough to average the two proton chemical shifts. The present pressure-induced broadening implies that the rotation of Phe 43 is restricted by pressure. A reduction of the rate of ring flip-flop motion by pressure was also observed in BPTI (Wagner 1980; Li et al. 1999). These results agree with the general picture that compression of a protein hinders the dynamic motions of the protein.
On the proximal side of the heme pocket, we observed signals for three residues, His 93 (F8), Ile 99 (FG5), and Leu 104 (G5). For the His 93 (F8) residue, the chemical shifts for NδH, its backbone amide, and CδH protons were observed at 21.3, 13.9, and −4.78 ppm, respectively. The peak-positions of His 93NδH and the backbone amide protons showed no significant changes under pressure, whereas the His 93 CδH proton showed a significant change (Fig. 2 ▶). These paramagnetic shifts could arise from the contact and dipolar contributions, because the imidazole ring of His 93 directly coordinates the heme iron atom. Therefore, we cannot quantitatively estimate the movements of the protons in this way. Nevertheless, the observation that there were no changes in the peak position of the amide proton and imidazole ring NδH proton imply insignificant pressure-induced movements of the protons. On the other hand, the significant pressure-induced shift of the imidazole ring CδH proton suggests some movement. Thus, the protons in the same imidazole ring must move to various degrees. Such a strange behavior may be explained by the rotational displacement of the imidazole ring, similar to the previously described case of the His 64 imidazole protons.
For the protons of Ile 99 and Leu 104 in the FG turn, all of the observed peaks exhibit significant upfield shifts with increasing pressure. The pressure-induced changes in distance between the iron atom and the Ile 99 protons (Table 1) indicate that the residue approaches the iron atom with increased pressure. The value of Δr for Leu 104 CδH3 indicates a remarkably large movement toward the iron atom. This phenomenon could be related to the fact that the side chain of Leu 104 is involved in the formation of part of a large cavity in the protein. We discuss this in detail in the section on Compressibility.
Comparison of SWMb and HHMb
Structural differences between the heme peripherals of SWMb and HHMb involve the 45th and 67th residues (Arg 45 and Thr 67 for SW, and Lys 45 and Val 67 for HH). The Arg 45 residue of SWMb, which makes a hydrogen-bonded network with the Asp 60 and the heme-6-propionate groups, controls the rotation of His 64 (Takano 1977). On the other hand, the Lys 45 of HHMb cannot form such a hydrogen-bonded network (Evance and Brayer 1990). This motivated us to compare the pressure-induced structural changes in SWMb and HHMb. Morishima and Hara (1983) observed a remarkable difference between the 1H NMR shifts of the His 64 NɛH protons of the two Mbs. We reinvestigated the pressure effect on the proton chemical shift of HHMbCN, not only for His 64 NɛH but also for His 64 CδH. Figures 2 ▶ and 3 ▶ show that the changes in the chemical shift of His 64 CδH, as well as His 64 NɛH in HHMb, are larger than those in SWMb. This implies that the conformational change of the His 64 imidazole ring is larger in HHMb than SWMb. This observation is consistent with the fact that the Lys 45 of HHMb cannot form the hydrogen-bonded network with Asp 60 and the heme-6-propionate group. The present observation agrees with a high-pressure study on rebinding kinetics of carbon monoxide to SWMb and HHMb (Adachi and Morishima 1989), which reported a 1.5-fold larger increase in the rebinding rate constant for carbon monoxide to myoglobin induced by a pressure of 200 MPa in HHMb than in SWMb (Adachi and Morishima 1989).
Compressibility
In this work, we estimated the distance changes between the paramagnetic iron and the residue protons using distance constraints on the basis of the dipolar shift. In the previous subsections, we have discussed detailed changes in the coordinates of individual residue protons of SWMb. Here, we discuss the present results from a viewpoint of compressibility.
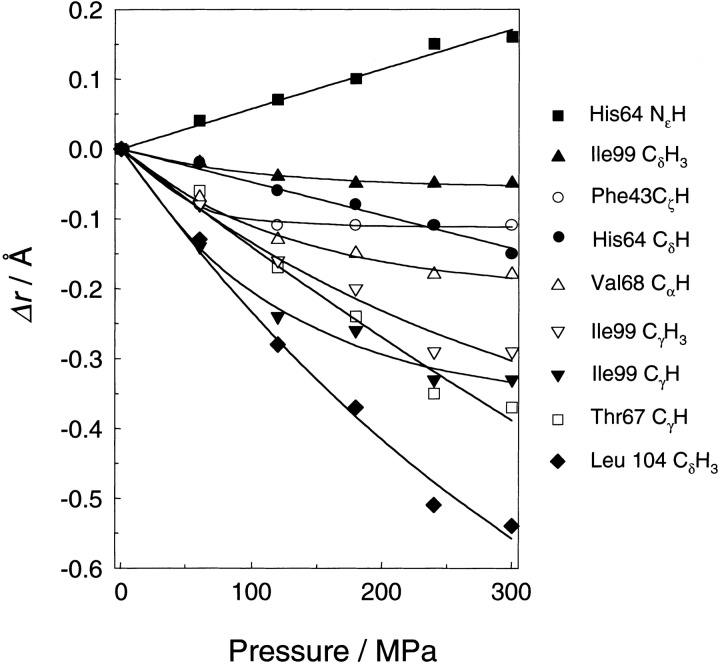
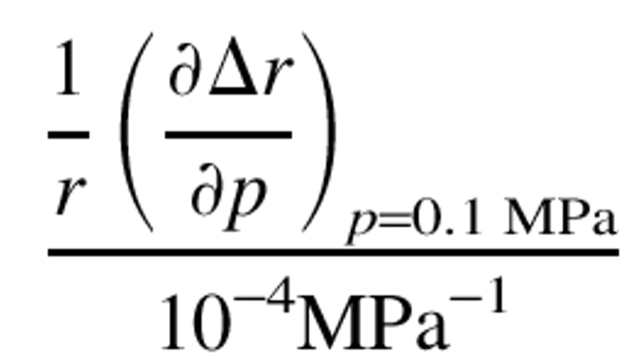
Most of the movements of the protons in response to an increase in pressure of 300 MPa are negative and <0.5 Å in value. For a more detailed description, we have plotted Δr against pressure in Figure 6 ▶, showing that all of the discussed protons, except the His 64 NɛH, approach the heme iron atom under high pressure. The different behavior of the His 64 NɛH proton is due to the rotational displacement of the histidine residue as described above. Another feature of Figure 6 ▶ is that the slopes with respect to pressure decrease at higher pressures. This means that the compressibility of the protein decreases with increasing pressure. Curve fittings for the plots with exponential functions give good results. The initial slopes of the curves, except the His 64 protons, in Figure 6 ▶ (see Table 2) give a one-dimensional compressibility (−1/r[∂r/∂p]T) in the range of 1.0–6.1 × 10⁻⁴/ MPa at 0.1 MPa.
Figure 6.
Pressure dependence of changes in the distance between the observed protons and the heme iron atom. The data are fitted with single exponential functions.
Table 2.
The first derivative of Δ r with respect to pressure and the one-dimensional compressibilities
| Residue | Position | 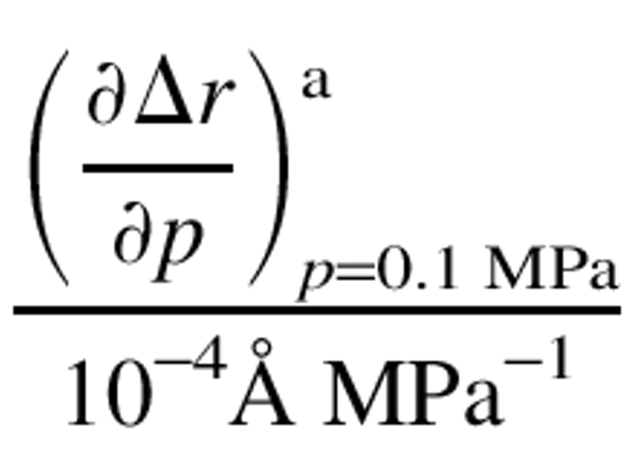 |
 |
| Phe 43/CD1 | CζH | 25 ± 2.5 | 5.3 ± 0.4 |
| Thr 67/E10 | CγH3 | 15 ± 30 | 2.1 ± 4.2 |
| Val 68/E11 | CαH | 16 ± 2.2 | 2.9 ± 0.4 |
| Ile 99/FG5 | Cγ1H | 30 ± 5.2 | 6.1 ± 1.1 |
| Cγ2H3 | 16 ± 7.9 | 2.3 ± 1.1 | |
| CδH3 | 5.4 ± 1.3 | 0.9 ± 0.2 | |
| Leu 104/G5 | CδH3 | 26 ± 12 | 4.2 ± 1.9 |
a Initial slopes of the curves in Fig. 6 ▶. The curves were given by fitting the data with the function, Δr = a{1-exp(bp)}. The value of a • b corresponds to the initial slope.
There have been three previous quantitative experimental studies that have reported pressure-induced movements of atoms in a protein. The first one is an X-ray crystallography study of lysozyme by Kundrot and Richards (1987), which showed that the root-mean-square movement of all atoms induced by a pressure of 100 MPa was 0.12 Å. The isothermal compressibility estimated from the volume decrease of the whole molecule was 4.7 × 10⁻⁴ /MPa. The second report is a high-pressure flash photolysis study of zinc porphyrin recombinant mutated myoglobins by Furukawa et al. (2000). They estimated the distance between the zinc atom and the ruthenium amino complex bound to the histidines from the rate constant of electron transfer. Changes in the distances of three kinds of the recombinant mutants were scattered in the range of +0.033 to −0.34 Å/100 MPa. One-dimensional compressibility was in the range of −0.2 to 2.2 × 10⁻⁴/MPa. The third report is a high-pressure NMR study of BPTI by Li et al. (1998), who revealed ∼ 0.05 Å/100 MPa shortening of the intramolecular hydrogen bond of BPTI on the basis of an empirical correlation between the chemical shift and the distance. If we assume that a typical H•••O distance in the NH•••O=C hydrogen bond in the protein is 2.0 Å, then the one-dimensional compressibility of the intramolecular hydrogen bond is ∼2.5 × 10⁻⁴/MPa. The present compressibility data (1.0– 6.1 × 10⁻⁴/MPa) for the heme environment in SWMbCN are comparable with those given in the three studies.
In the above section, we discussed the compressibility of proteins on the basis of the change in atomic position. Such compressibility is generally called the intrinsic compressibility (Paci and Velikson 1997). It must be discriminated from the thermodynamic (partial molar) compressibility, which can be obtained directly from sound velocity experiments (Gekko and Hasegawa 1986; Chalikian et al. 1996; Gekko et al. 2000). The thermodynamic compressibility is a partial molar quantity, which includes a contribution of hydrated solvent water as well as the intrinsic contribution. Although they are essentially different from each other, the comparison between them could give useful information on the properties of the protein. The thermodynamic isothermal compressibility of metmyoglobin, which was estimated from the adiabatic compressibility by sound velocity measurement, is 1.31 × 10⁻⁴/MPa (Gekko and Hasegawa 1986). Another published value of 0.937 × 10⁻⁴/MPa for deoxymyoglobin was obtained by the normal mode calculation using a definition of the volume including a contribution from half a layer of water (Yamato et al. 1993). The present intrinsic compressibility for the heme environment is relatively larger than those values. This larger compressibility is in agreement with the detailed picture presented by Yamato et al. (1993) that the compressibility of the local region between cavities and the heme skeleton are relatively large. These authors also indicated that the average magnitude of pressure-induced displacement of His 64 (distal histidine) atoms is twice that of His 93, in agreement with the present work.
Another interesting suggestion from a recent sound velocity study (Kamiyama and Gekko 2000) is that the cavity in a protein significantly contributes to its compressibility. We have shown that the large compressibility for Leu 104 is correlated with the large cavity in Mb as described above. For a more detailed discussion, we show plots of the compressibility at 0.1 MPa and Δr (Table 1) against the distance of the proton from the nearest cavity in Figure 7 ▶. Both panels in the figure indicate that both parameters correlate with the distance of the proton from the cavities, and that the correlation is better for Δr. The plot for the Thr 67 CγH3 protons, which are exposed to the solvent, is deviated from the correlation line and is the only exception. It seems reasonable that the existence of the cavity is not important for the pressure-induced movement of exposed residues. After omitting this data set (6), Figure 7B ▶ gives a linear correlation factor of 0.95. It is very interesting that the correlation between the compressibility at 0.1 MPa and the distance is lower. A typical case is Phe 43 CζH, which has a large compressibility and is far from the cavity. Its initial slope in Figure 6 ▶ is large, but it becomes dramatically small at high pressures. It seems quite reasonable that a large movement induced by pressure needs a free space available near the residue. The present result also indicates that a small free space around a residue can produce a large compressibility at 0.1 MPa, but cannot do so at high pressures.
Figure 7.
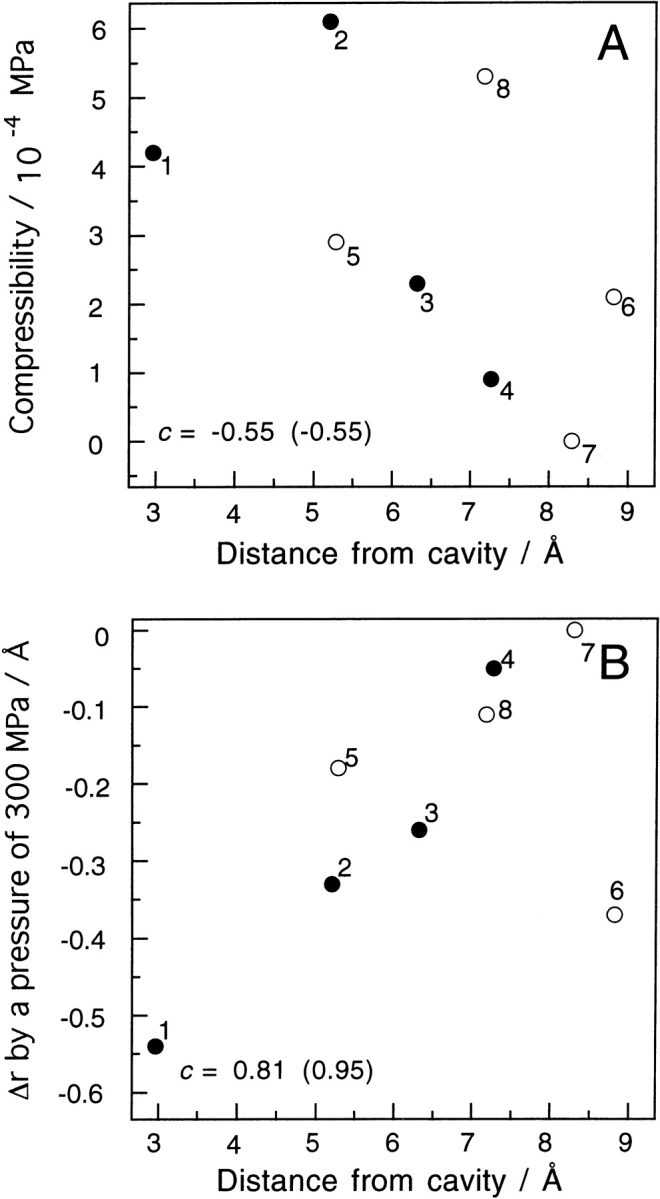
Plots of (A) compressibility and (B) Δr (Table 1) of the targeted protons vs. the distance from the nearest large cavity (cavity 1 or cavity 2; see legend to Fig. 4 ▶). The cavities were generated by rolling a probe sphere whose radius was 1.4 Å. The distances used are the nearest ones between the protons and the curved surface made by the center of the rolling probe. These calculations were performed using the program MOLMOL with the coordinate data (PDB2mb5). Closed and open circles represent the data for residues whose nearest large cavities are cavity 1 and cavity 2, respectively. The targeted protons and the calculated distances are as follows: 1, Leu 104 CδH3, 2.96 Å; 2, Ile 99 Cγ1H, 5.20 Å; 3, Ile 99 Cγ2H3, 6.31 Å; 4, Ile 99 CδH3, 7.26 Å; 5, Val 68 CαH, 5.28 Å; 6, Thr 67 CγH3, 8.81 Å; 7, Phe 43 CɛH, 8.29 Å; 8, Phe 43 CζH, 7.17 Å. The linear correlation coefficient c is represented in each panel. The value in the parentheses is obtained when omitting data set 6.
As mentioned, another interesting observation is that the compressibility decreases with increasing pressure. There are two possible factors explaining the decrease in compressibility, the contraction of cavities and/or water penetration into the cavity by pressure. Although neither case was demonstrated by the present work, this is a critical open question because the water penetration model is also a key hypothesis for the pressure-induced denaturation of proteins. The possibility of the water penetration has been supported by a model (methane-water system) calculation by a statistical-mechanical method, which showed that pressure stabilizes the separated configuration of methane molecules by water (Hummer et al. 1996).
Applying the above-deduced conclusion to the compression of proteins, we note that a protein with large cavities gives large pressure-induced movement and compressibility. There have been numerous sound velocity works at 0.1 MPa, providing the thermodynamic compressibility of proteins. On the other hand, atomic level studies under high pressure providing the intrinsic compressibility are few, and the experimental methods available for such studies are very limited. The X-ray diffraction method, which is the most powerful technique, has an inevitable weak point of crystal collapse under pressure. For comprehensive understanding of the compressibility of a protein, atomic level techniques need to be much improved. The present work proposes an alternative method, which is convenient and semiquantitative for hemeproteins. Hemeproteins frequently have paramagnetic metals near the weight center of the molecules, which are also the active site. Applying the present method would also be a good strategy for studying the compressibility of proteins from physical and biological points of view.
Conclusion
(1) The one-dimensional compressibility is ∼6.1 × 10⁻⁴ Å/MPa, which is comparable with previous studies for lysozyme, BPTI, and zinc porphyrin recombinant mutated Mbs. (2) The pressure-induced movement of the residues is highly correlated to the distance from large cavities. (3) Pressure induces the rotational movement of His 64 toward the outside of the heme pocket, which is driven dominantly by changes in the χ1 angle. The angle change induced by pressure of 300 MPa was estimated to be about +10°. (4) The His 64 residue in HHMb is less resistant to pressure than that in SWMb, which is consistent with the fact that the Lys 45 of HHMb does not form a hydrogen-bonded network with Asp 60 and the heme-6-propionate group.
Materials and methods
Sample preparation
Sperm whale myoglobin was purchased from Biozyme Laboratories Ltd. Further purification was performed by gel filtration through Sephadex G(25 (Pharmacia Biotech) and CM-52 (Whatman Paper Ltd) in 20 mM phosphate buffer. Horse heart myoglobin (Sigma-Aldrich Japan KK) was used without further purification. The cyanide complexes were prepared by addition of a sevenfold excess of KCN to each protein solution. Then, the phosphate buffer and excess KCN were replaced with Tris buffer using an ultrafiltration cell (Amicon Inc.). The samples were finally prepared to be in 100 mM Tris buffer (90%-H2O and 10%-2H2O) at pH 7.5 for SWMb and 8.6 for HHMb. The final protein concentration of 3 mM was determined spectrophotometrically using E = 109.7 mM cm−1 at 423 nm. For a double-quantum-filtered COSY (DQF-COSY) measurement, the protein was prepared in 100 mM Tris buffer (100%-2H2O) at a protein concentration of ∼5 mM. The pH was adjusted to 7.7 by 0.1 M 2HCl and 0.1 M NaO2H.
High-pressure NMR measurements
1H NMR spectra were recorded using a JNM-EX270 spectrometer (JEOL Ltd) operating at a 1H frequency of 270 MHz combined with a high-pressure NMR probe (JEOL Ltd) up to 300 MPa. The high-pressure probe contained a sample cell consisting of an 8-mm-glass tube (Pyrex), a piston (Teflon), and a copper weight. The spectra consisted of 1600 scan times with 32-k data points over a 16-k Hz spectral width. The residual solvent signal (1HO2H) was suppressed by pre-irradiation. Proton chemical shifts were referenced with respect to the water proton signal (4.75 ppm at 25°C).
The DQF-COSY spectrum was recorded in the phase-sensitive mode using a JEOL JNM-A 400 spectrometer (JEOL Ltd) at a 1H frequency of 400 MHz to confirm the assignment of individual peaks by reference to the assignment in the literature (Emerson and La Mar 1990a,b). The COSY spectrum was acquired with 512 increments of t1, each consisting of 32 transients. The spectral width was 20 kHz and 2048 real data points were acquired in t2. The solvent signal (1HO2H) was suppressed by pre-irradiation.
Acknowledgments
We thank Dr. Akio Shimizu at Soka University for helpful discussions.
The publication costs of this article were defrayed in part by payment of page charges. This article must therefore be hereby marked “advertisement” in accordance with 18 USC section 1734 solely to indicate this fact.
Abbreviations
Mb, myoglobin
SW, sperm whale
HH, horse heart
MbCN, metcyanomyoglobin
NMR, nuclear magnetic resonance
DQF-COSY, double-quantum-filtered correlation spectroscopy
Article and publication are at http://www.proteinscience.org/cgi/doi/10.1110/ps.4620103.
References
- Adachi, S. and Morishima, I. 1989. The effect of pressure on oxygen and carbon monoxide binding kinetics for myoglobins. J. Biol. Chem. 264 18896–18901. [PubMed] [Google Scholar]
- Akasaka, K. and Li, H. 2001. Low-lying excited states of proteins revealed from nonlinear pressure shifts in 1H and 15N NMR. Biochemistry 40 8665–8671. [DOI] [PubMed] [Google Scholar]
- Akasaka, K., Tezuka, T., and Yamada, H. 1997. Pressure-induced changes in the folded structure of lysozyme. J. Mol. Biol. 271 671–678. [DOI] [PubMed] [Google Scholar]
- Akasaka, K., Li, H., Yamada, H, Li, R., Thoresen, T., and Woodward, C.K. 1999. Pressure response of protein backbone structure. Pressure-induced amide 15N chemical shifts in BPTI. Protein Sci. 8 1946–1953. [DOI] [PMC free article] [PubMed] [Google Scholar]
- Bentrop, D., Bertini, I., Cremonini, M.A, Forsén, S., Luchinat, C., and Malmendal, A. 1997. Solution structure of the paramagnetic complex of the N-terminal domain of calmodulin with two Ce3+ ions by H-1 NMR. Biochemistry 36 11605–11618. [DOI] [PubMed] [Google Scholar]
- Bertini, I. and Felli, I.C. 2001. NMR of paramagnetic proteins: Structure, dynamics, and stability. In Dynamics, structure and function of biological macromolecules. (ed. O. Jardezky and M.D. Finucase), pp. 251–282. IOS Press, Amsterdam, Netherlands.
- Chalikian, T.V., Totrov, M., Abagyan, R., and Breslauer, K.J. 1996. The hydration of globular proteins as derived from volume and compressibility measurements: Cross correlating thermodynamic and structural data. J. Mol. Biol. 260 588–603. [DOI] [PubMed] [Google Scholar]
- Cheng, X. and Schoenborn, B. P. 1990. Hydration in protein crystals. A neutron diffraction analysis of carbonmonoxymyoglobin. Acta Crystallogr. 46 195. [Google Scholar]
- Dalvit, C. and Wright, P.E. 1987. Assignment of resonances in the 1H nuclear magnetic resonance spectrum of the carbon monoxide complex of sperm whale myoglobin by phase-sensitive two-dimensional techniques. J. Mol. Biol. 194 313–327. [DOI] [PubMed] [Google Scholar]
- Dzwolak, W., Kato, M., Shimizu, A., and Taniguchi, Y. 1999. Fourier-transform infrared spectroscopy study of the pressure-induced changes in the structure of the bovine α-lactalbumin: The stabilizing role of the calcium ion. Biochimi. Biophys. Acta 1433 45–55. [DOI] [PubMed] [Google Scholar]
- Dzwolak, W., Kato, M., and Taniguchi, Y. 2002. Fourier-transform infrared spectroscopy in high-pressure studies on proteins. Biochimi. Biophys. Acta 1595 131–144. [DOI] [PubMed] [Google Scholar]
- Emerson, S.D. and La Mar, G.N. 1990a. NMR determination of the orientation of the magnetic susceptibility tensor in cyanometmyoglobin: A new probe of steric tilt of bound ligand. Biochemistry 29 1556–1566. [DOI] [PubMed] [Google Scholar]
- ———. 1990b. Solution structural charaterization of cyanometmyoglobin: Resonance assignment of heme cavity residues by two-dimensional NMR. Biochemistry 29 1545–1556. [DOI] [PubMed] [Google Scholar]
- Evance, S.V. and Brayer, G.D. 1990. High-resolution study of the three-dimensional structure of horse heart metmyoglobin. J. Mol. Biol. 213 885–897. [DOI] [PubMed] [Google Scholar]
- Frauenfelder, H., Alberding, N.A., Ansari, A., Braunstein, D., Cowen, B.R., Hong, M.K., Iben, I.E.T., Johnson, J.B., Luck, S., Marden, M.C. et al. 1990. Proteins and pressure. J. Phys. Chem. 94 1024–1037. [Google Scholar]
- Fujisawa, T., Kato, M., and Inoko, Y. 1999. Structural characterization of lactate dehydrogenase dissociation under high pressure studied by synchrotron high-pressure small-angle X-ray scattering. Biochemistry 38 6411–6418. [DOI] [PubMed] [Google Scholar]
- Furukawa, Y., Ishimori, K., and Morishima, I. 2000. Pressure dependence of the intramolecular electron transfer reaction in myoglobin reinvestigated. J. Phys. Chem. 104 1817–1825. [Google Scholar]
- Gekko, K. and Hasegawa, Y. 1986. Compressibility-structure relationship of globular proteins. Biochemistry 25 6563–6571. [DOI] [PubMed] [Google Scholar]
- Gekko, K., Kamiyama, T., Ohmae, E., and Katayanagi, K. 2000. Single amino acid substitutions in flexible loops can induce large compressibility changes in dihydrofolate reductase. J. Biochem. 128 21–27. [DOI] [PubMed] [Google Scholar]
- Hummer, G, Grade, S., Garcia, A.E., Pohorille, A., and Pratt, L.R. 1996. The pressure dependence of hydrophobic interactions is consistent with the observed pressure denaturation of proteins. Proc. Natl. Acad. Sci. 93 8951–8955.11607700 [Google Scholar]
- Inoue, K., Yamada, H., Akasaka, K., Herrmann, C., Kremer, W., Maurer, T, and Kalbitzer, H.R. 2000. Local packing defects initialize the pressure induced unfolding of a globular protein. Nat. Struct. Biol. 7 547–550. [DOI] [PubMed] [Google Scholar]
- Iwadate, M., Asakura, T., Dubovskii, P.V., Yamada, H., Akasaka, K., and Williamson, M.P. 2001. Pressure-induced changes in the structure of the melittin α-helix determined by NMR. J. Biol. NMR. 19 115–124. [DOI] [PubMed] [Google Scholar]
- Jonas, J. and Jonas, A. 1994. High-pressure NMR spectroscopy of proteins and membranes. Annu. Rev. Biophys. Biomol. Struct. 23 287–318. [DOI] [PubMed] [Google Scholar]
- Jonas, J., Ballars, L., and Nash, D. 1998. High-resolution, high-pressure NMR studies of proteins. Biophys. J. 75 445–452. [DOI] [PMC free article] [PubMed] [Google Scholar]
- Kamiyama, T. and Gekko, K. 2000. Effect of ligand binding on the flexibility of dihydrofolate reductase as revealed by compressibility. Biochim. Biophys. Acta 1478 257–266. [DOI] [PubMed] [Google Scholar]
- Kato, M. and Fujisawa, T. 1998. High-pressure solution x-ray scattering of protein using a hydrostatic cell with diamond windows. J. Synchrotron Rad. 5 1282–1286. [DOI] [PubMed] [Google Scholar]
- Kitahara, R., Sareth, S., Yamada H., Ohmae, E., Gekko, K., and Akasaka, K. 2000. High pressure NMR reveals active-site hinge motion of folate-bound Escherichia coli dihydrofolate reductase. Biochemistry 39 12789–12795. [DOI] [PubMed] [Google Scholar]
- Kitahara, R., Yamada, H., and Akasaka, K. 2001. Two folded conformers of ubiquitin revealed by high pressure NMR. Biochemistry 40 13556–13563. [DOI] [PubMed] [Google Scholar]
- Kitahara, R., Yamada, H., Akasaka, K., and Wright, P.E. 2002a. High pressure NMR reveals that apomyoglobin is an equilibrium mixture from the native to the unfolded. J. Mol. Biol. 320 311–319. [DOI] [PubMed] [Google Scholar]
- Kitahara, R., Royer, C., Yamada, H., Boyer, M., Saldana, J., Akasaka, K., and Roumestand, C. 2002b. Equilibrium and pressure-jump rexation studies of the conformational transitions of p13 MTCP1. J. Mol. Biol. 320 609–628. [DOI] [PubMed] [Google Scholar]
- Kundrot, C.E. and Richards, F.M. 1987. Crystal structure of hen egg-white lysozyme at a hydrostatic pressure of 1000 atmospheres. J. Mol. Biol. 193 157–170. [DOI] [PubMed] [Google Scholar]
- Lassalle, M.L., Yamada, H., and Akasaka, K. 2000. The pressure-temperature free energy-landscape of staphylococcal nuclease monitored by 1H NMR. J. Mol. Biol. 298 293–302. [DOI] [PubMed] [Google Scholar]
- Li, H., Yamada, H., and Akasaka, K. 1998. Effect of pressure on individual hydrogen bonds in proteins. Basic pancreatic trypsin inhibitor. Biochemistry 37 1167–1173. [DOI] [PubMed] [Google Scholar]
- ———. 1999. Effect of pressure on the tertiary structure and dynamics of folded BPTI. Biophys. J. 77 2801–2812. [DOI] [PMC free article] [PubMed] [Google Scholar]
- Morishima, I. and Hara, M. 1983. High-pressure nuclear magnetic resonance studies of hemoproteins. Pressure-induced structural changes in the heme environments of ferric low-spin metcyanomyoglobin complexes. Biochemistry 22 4102–4107. [DOI] [PubMed] [Google Scholar]
- Morishima, I., Ogawa, S., and Yamada, H. 1980. High-pressure proton nuclear magnetic resonance studies of hemoproteins. Pressure-induced structural change in heme environments of myoglobin, hemoglobin, and horseradish peroxidase. Biochemistry 19 1569–1575. [DOI] [PubMed] [Google Scholar]
- Nicholls, A., Sharp, K.A., and Honig, B. 1991. Protein folding and association insights from the interfacial and thermodynamic properties of hydrocarbons. Proteins 11 281–296. [DOI] [PubMed] [Google Scholar]
- Paci, E. and Velikson, B. 1996. On the volume of macromolecules. Bioplymers 41 785–797. [Google Scholar]
- Panick, G., Malessa, R., Winter, R., Rapp, G., Frye, K.J., and Royer, C.A. 1998. Structural characterization of the pressure-denatured state and unfolding/refolding kinetics of staphylococcal nuclease by synchrotron small angle X-ray scattering and Fourier-transform infrared spectroscopy. J. Mol. Biol. 275 389–402. [DOI] [PubMed] [Google Scholar]
- Ray, G.B., Li, X.Y., Ibers, J.A., Sessler, J.L., and Spiro, T.G. 1994. How far can proteins bend the FeCO unit? Distal polar and steric effects in heme proteins and models. J. Am. Chem. Soc. 116 162–176. [Google Scholar]
- Shimada, H. and Caughey, W.S. 1982. Dynamic protein structures. J. Biol. Chem. 257 11893–11900. [PubMed] [Google Scholar]
- Springer, B.A., Sligar, S.G., Olson, J.S., and Phillips, Jr., G.N. 1994. Mechanisms of ligand recognition of myoglobin. Chem. Rev. 94 699–714. [Google Scholar]
- Takano, Y. 1977. Structure of myoglobin refined at 2.0 Å resolution I. J. Mol. Biol. 110 537–568. [DOI] [PubMed] [Google Scholar]
- Takeda, N., Kato, M., and Taniguchi, Y. 1995. Pressure- and thermally-induced reversible changes in the secondary structure of ribonuclease A studied by FT-IR spectroscopy. Biochemistry 34 5980–5987. [DOI] [PubMed] [Google Scholar]
- Tilton, Jr., R.F. and Petsuko, G.A. 1988. A study of sperm whale myoglobin at a nitrogen gas pressure of 145 atmospheres. Biochemistry 27 6574–6582. [DOI] [PubMed] [Google Scholar]
- Tilton, Jr., R.F., Kuntz, Jr., I.J., and Petsko, G.A. 1984. Cavities in proteins: Structure of a metmyoglobin-xenon complex solved to 1.9 Å. Biochemistry 23 2849–2857. [DOI] [PubMed] [Google Scholar]
- Wagner, G. 1980. Activation volumes for the rotational motion of interior aromatic rings in globular proteins determined by high resolution 1H-NMR at various pressure. FEBBS Lett. 112 280–284. [DOI] [PubMed] [Google Scholar]
- Yamato, T., Higo, J., Seno, Y., and Go, N. 1993. Conformational deformation in deoxymyoglobin by hydrostatic pressure. Proteins 16327–340. [DOI] [PubMed] [Google Scholar]
- Yang, F. and Phillips, Jr., G.N. 1996. Crystal structures of CO-, deoxy- and met-myoglobin at various pH values. J. Mol. Biol. 256 762–774. [DOI] [PubMed] [Google Scholar]
- Yu, A., Ballard, L., Smillie, L., Pearlstone, J., Foguel, D., Silva, J., Jonas, A., and Jonas, J. 1999. Effects of high pressure and temperature of the wild-type and F29W mutant forms of the N-domain of avian troponin C. Biochimi. Biophys. Acta 1431 53–63. [DOI] [PubMed] [Google Scholar]


