

Abstract
A neural network-based method has been developed for the prediction of β-turns in proteins by using multiple sequence alignment. Two feed-forward back-propagation networks with a single hidden layer are used where the first-sequence structure network is trained with the multiple sequence alignment in the form of PSI-BLAST–generated position-specific scoring matrices. The initial predictions from the first network and PSIPRED-predicted secondary structure are used as input to the second structure-structure network to refine the predictions obtained from the first net. A significant improvement in prediction accuracy has been achieved by using evolutionary information contained in the multiple sequence alignment. The final network yields an overall prediction accuracy of 75.5% when tested by sevenfold cross-validation on a set of 426 nonhomologous protein chains. The corresponding Qpred, Qobs, and Matthews correlation coefficient values are 49.8%, 72.3%, and 0.43, respectively, and are the best among all the previously published β-turn prediction methods. The Web server BetaTPred2 (http://www.imtech.res.in/raghava/betatpred2/) has been developed based on this approach.
Keywords: β-Turns, prediction, neural networks, multiple alignment, secondary structure, Web server
The secondary structure of a protein consists of α helices, β-sheets, loops, and tight turns. Helices and sheets are referred to as regular structures, whereas loops and tight turns belong to the category of irregular secondary structures. Tight turns are irregular structures with nonrepeating backbone torsion angles and often have at least one hydrogen bond (Chou 2000). Depending on the number of residues forming the turn, tight turns are classified as δ-turns, γ-turns, β-turns, α-turns, and π-turns. β-Turn is a four-residue reversal in a protein chain that is not in an α-helix, and the distance between Cα(i) and Cα(i + 1) is < 7 Å (Richardson 1981; Rose et al. 1985). About one-fourth of all protein residues are in β-turns.
They are responsible for the compact globular shape of proteins because of the ability to reverse the protein chain direction within a span of several residues. Also, β-turn formation is an important stage in protein folding (Takano et al. 2000). Moreover, the occurrence of β-turns on solvent-exposed surfaces makes them suitable candidates for molecular recognition processes and interactions between peptide substrates and receptors (Rose et al. 1985).
Therefore, it is useful to develop an accurate method for identifying the location of β-turn within a protein sequence. It not only would be a small step toward the overall prediction of three-dimensional structure of a protein from its amino acid sequence but also would be helpful in fold-recognition studies and identification of structural motifs such as a β-hairpin.
β-Turn prediction methods
In past, a number of methods have been developed for β-turn prediction. The majority of these methods are empirically based on the "positional preference approach," which uses the residue propensities at positions i to i + 3 to calculate the positional frequencies and conformational parameters. A simple empirical method for predicting β-turns was first introduced by Chou and Fasman (1974). Later, Garnier et al. (1987) included turn as one of the four conformations in their empirical algorithm that used information over 17 residues. In 1988, Wilmot and Thornton derived β-turn parameters from a set of 59 proteins from the frequency distributions of different turn types based on the method of Chou and Fasman (1974, 1979). Later, the positional preference approach was extended, taking into account the correlations between the pairing of residues. Based on "correlation coupling effects," two models–the 1–4 and 2–3 correlation model and the sequence-coupled model–were proposed (Chou 1997; Chou and Blinn 1997; Zhang and Chou 1997). Both these models were based on an first-order Markov chain involving conditional probabilities of residues occurring in β-turns. A method, BTPRED, based on neural network was developed by Shepherd et al. (1999) for predicting the location and type of β-turns in proteins.
Inferences from previous study
All the existing β-turn prediction methods have been trained on different training sets and have reported accuracy on different test sets. Recently, we have evaluated the performance of all the methods on a uniform data set of 426 nonhomologous protein chains by sevenfold cross-validation technique (Kaur and Raghava 2002). In the evaluation study, we have shown that the prediction accuracy can be improved by training on a new data set and by inclusion of secondary structure information. By using parameters learned on a new data set, the statistical methods can achieve the accuracy level equal to that of a sophisticated method such as the neural network-based method BTPRED. It has been observed that BTPRED outperforms all other methods, and its accuracy depends on the accuracy of secondary structure prediction. Thus, there is a need to develop a prediction method based on neural network, trained on a new and larger data set, and to include the secondary structure information predicted from a more accurate method such as PSIPRED in order to obtain new updated weights.
To begin, the network is first trained with single sequences, and then a second filtering network is used to process the output from the first turn/nonturn network and is trained by using secondary structure information from PSIPRED (Jones 1999). Together, these two networks have resulted in substantial improvement in prediction accuracy compared with that of previous methods, by training on a larger data set and secondary structure information from PSIPRED. The method shows Matthews correlation coefficient (MCC) value of 0.41 compared with the MCC of 0.35 for BTPRED.
A new approach to β-turn prediction
It has been shown in the past that the prediction from a multiple alignment of protein sequences rather than a single sequence results in 6% to 7% increase in prediction accuracy of secondary structure prediction method (Rost and Sander 1993). PSIPRED is a method of protein secondary structure prediction based on a neural network evaluation of PSI-BLAST (Position-specific iterated blast)–generated profiles. The success of PSIPRED and its top ranking among other methods can be attributed to the fact that it uses PSI-BLAST, which searches homologs against a nonredundant database to generate multiple sequence alignment profiles. The approach so used by PSIPRED is applied in the present study for β-turn prediction, and it might well be expected that by using PSI-BLAST profiles, the β-turn prediction method will show measurable improvement in accuracy. This is the first time that multiple alignment information is specifically used for the prediction of β-turns. Therefore, the present study addresses the question of whether the combination of sophisticated technique neural network and multiple alignment information can lead to improvement in β-turn prediction accuracy.
It is interesting to note that a significant improvement in prediction accuracy compared with the single sequence has been achieved by training the net on PSI-BLAST–generated position-specific scoring matrices. The method shows MCC value of 0.37 compared with 0.31 for single sequence. Moreover, prediction from a second filtering network trained on predictions from the first network and predicted secondary structure information from PSIPRED yields a MCC value of 0.43 and a marked improvement in other performance statistics.
Results
Statistical analysis of β-turns: amino acid preferences
The sequences of β-turns have been analyzed to search for amino acid preferences. (The positional frequencies of each amino acid in each of the four positions are included as Electronic Supplemental Material.) It can be noted that at position i, Pro, Asp, Asn, Cys, and Ser all exhibit a significant preference to be at the first position of a β-turn. At position i + 1, Pro is the most strongly preferred amino acid, followed by Asp, Ser, and Asn. Position i + 2 is dominated by Gly and, to a lesser extent, by Asn. Also, there are significant preferences for Asp and Ser. There is a strong preference for Gly at i + 3 position. All these preferences are in accordance with the preferences noted by Wilmot and Thornton (1988).
Prediction of β-turns
In this work, we have used unbalanced sets containing the natural ratio of β-turn residues and non–β-turn residues as found in proteins. The results averaged over seven tests are presented. The value of the learning parameter has been set to 0.0001. Training have been performed for 5000 epochs for both networks, after which the learning has been terminated when the error reached a stable value; differences between errors in subsequent steps become sufficiently small. Prediction performance measures have been averaged over seven sets and are expressed as the mean ± SD.
Prediction with single sequences
The net is trained with single sequences encoded as binary bits and contains no secondary structure information, with a window size of nine residues. When applying a sevenfold cross-validation test on a data set containing single sequences, we found that the network reached an overall accuracy of 71.6 ± 0.7%. The prediction results are presented in Table 1. The net has achieved an MCC of 0.31 ± 0.01, which is comparable to that of BTPRED with a single network; however, the percentage accuracy is lower than that of BTPRED. A comparison of MCC and Qpred/Qobs values of BTPRED (Shepherd et al. 1999) and other statistical methods tested on the same data set (Kaur and Raghava 2002) has also been made (see Electronic Supplemental Material). The probability of correct prediction is better than with statistical methods but lower than that of BTPRED. However, the coverage of turns is maximum among all the methods. Moreover, with single sequences, as input to the network, the performance is better than that of statistical methods.
Table 1.
Results of β-turn/nonturn predictions by using single sequence with and without secondary structure information
| Network with single sequence and secondary structure | ||||
| Network with single sequence | DSSP | PHD | PSIPRED | |
| Qtotal | 71.6 ± 0.7 | 79.3 ± 1.1 | 72.6 ± 1.1 | 74.3 ± 1.5 |
| (72.5 ± 0.9) | (74.6 ± 0.8) | |||
| Qpred | 44.1 ± 1.3 | 55.4 ± 2.0 | 46.1 ± 1.5 | 48.4 ± 1.7 |
| (47.5 ± 1.3) | (48.1 ± 1.5) | |||
| Qobs | 57.3 ± 2.6 | 80.8 ± 2.7 | 67.1 ± 2.6 | 71.2 ± 3.0 |
| (66.8 ± 2.5) | (70.4 ± 3.2) | |||
| MCC | 0.31 ± 0.01 | 0.53 ± 0.01 | 0.38 ± 0.01 | 0.41 ± 0.01 |
| (0.38 ± 0.01) | (0.41 ± 0.01) | |||
Values in parentheses correspond to the prediction results obtained by excluding the proteins that were used to develop PHD and PSIPRED methods.
Prediction with single sequences and secondary structure information
The next improvement in prediction accuracy is expected by using a second filtering network and incorporating predicted secondary structure information in training. The output obtained from first-level 9(21)-10-1 network and secondary structure is presented to the second-level 9(4)-10-1 network. The secondary structure information from two different methods, PHD and PSIPRED, is used. The improvement in prediction accuracy in both the cases is evident from the results of 9(4)-10-1 network shown in Table 1. We achieved final MCC for turn/nonturn prediction of 0.53 with observed secondary structure information (DSSP) and 0.41 ± 0.01 with PSIPRED predicted secondary structure information. This is a substantial improvement on the MCC of 0.35 of BTPRED. The net has an accuracy of 74.3 ± 1.5%. A more than 10-percent gain is obtained in probability of correct prediction. Finally, better predictions results with PSIPRED in comparison to PHD shows that the accuracy of β-turn prediction depends crucially on the accuracy of secondary structure prediction method.
Although our data set is nonhomologous, it contains some of the protein chains used to train the PHD and PSIPRED. As a consequence, we have cross-validated the results by removing those proteins from our data set that were used to develop PHD and PSIPRED. The difference in prediction results is very small or almost negligible, as evident from the values given in Table 1.
Prediction with multiple alignment
To further enhance the prediction performance, the multiple sequence alignment is implemented for prediction. The first-level network 9(21)-10-1 is trained on PSI-BLAST–generated position-specific matrices. The comparative results of network with single sequence and with multiple alignment are shown in Table 2.
Table 2.
Summary of prediction results by using single sequence and multiple alignment
| Single sequence | Multiple alignment | |||
| First network | Second network | First network | Second network | |
| Qtotal | 71.6 ± 0.7 | 74.3 ± 1.0 | 73.5 ± 1.5 | 75.5 ± 1.7 |
| (74.6 ± 1.4) | (75.8 ± 1.6) | |||
| Qpred | 44.1 ± 1.3 | 48.4 ± 1.7 | 47.2 ± 1.9 | 49.8 ± 2.0 |
| (48.6 ± 1.8) | (49.9 ± 1.9) | |||
| Qobs | 57.3 ± 2.6 | 71.2 ± 2.0 | 64.3 ± 2.2 | 72.3 ± 2.6 |
| (70.4 ± 2.0) | (70.8 ± 2.0) | |||
| MCC | 0.31 ± 0.01 | 0.41 ± 0.01 | 0.37 ± 0.01 | 0.43 ± 0.01 |
| (0.41 ± 0.01) | (0.43 ± 0.01) | |||
Values in parentheses correspond to the prediction results obtained by excluding the proteins that were used to develop PSIPRED method.
It is clear from the results that the network performance is significantly improved when PSI-BLAST–generated scoring matrices are used as input, compared with single sequence. The prediction accuracy is improved from 71.6% to 73.5%. The most dramatic improvement is achieved in MCC value. It is increased from 0.31 with single sequence to 0.37 with PSI-BLAST. Thus, substantial improvements in prediction performance have come from the use of PSI-BLAST scoring matrices in preference to binary encoding of single sequences.
Prediction with multiple alignment and secondary structure information
Accuracy is further improved by using a second filtering network and secondary structure information. Output from the first network (trained on PSI-BLAST scoring matrices) and secondary structure predicted by PSIPRED is applied to the second network, which is trained for an additional 5000 cycles. Use of PSIPRED-predicted secondary structure and multiple alignment information improves the MCC to 0.43 ± 0.01 and prediction accuracy to 75.5 ± 1.7%, the best available at present (Table 2). The final network yields Qpred value of 49.8 ± 2.0% and Qobs value of 72.3 ± 1.6% and is marginally better than the results of second-level network with single sequence. Therefore, the use of multiple alignment information in the form of PSI-BLAST position-specific matrices as input to the first network and filtering by second network has further improved the level of prediction performance.
The prediction results with multiple alignment information have also been validated by removing those proteins from our data set that were used to develop PSIPRED. The results, given in Table 2, show negligible differences in performance measures except in Qobs value.
Receiver operating characteristic results
Performance of different networks has also been evaluated by calculating the area under the receiver operating characteristic (ROC) curve. Figure 1 ▶ shows the ROC curves for four different networks. The four curves have been compared by computing the area under the curves. The corresponding areas under the curves are as follows: single sequence, 0.67; multiple alignment, 0.72; single sequence with secondary structure, 0.76; and multiple alignment with secondary structure, 0.77. These reflect the better discrimination of network system, which consists of first network that is trained on multiple alignment profiles, and a second network that is trained on secondary structure in comparison to other three network systems.
Figure 1.

ROC curves for four different network systems. Solid line indicates single sequence; dotted line indicates multiple alignment; dashed line indicates single sequence with secondary structure; and solid/dotted line indicates multiple alignment with secondary structure.
Discussion
It is known that using information from sequence alignments significantly improves protein secondary structure prediction. Typically, more divergent profiles yield better predictions. The recent improvement in secondary structure prediction method such as PSIPRED has resulted from the use of improved searching tool for multiple sequence alignment such as PSI-BLAST. PSI-BLAST searches the homologs against a larger database such as a nonredundant database. So, a part of success of PSIPRED can also be contributed to the growth of sequence databases (switching from SWISS-PROT, currently containing 90,000 sequences, to a nonredundant database containing 500,000 sequences). Moreover, it has also been shown recently that using larger databases and PSI-BLAST raises the accuracy of secondary structure prediction from 72% to 75% (Przybylski and Rost 2002).
Here, we have used the same approach for β-turn prediction, and it differs significantly from the earlier methods. We have developed a method based on neural networks by using multiple alignment information in the form of PSI-BLAST–generated scoring matrices to improve the β-turn prediction accuracy. From this study, it is clear that a combination of neural network and evolutionary information contained in multiple sequence alignment has improved the performance of β-turn prediction method. There are three possible explanations for the improvements obtained: (1) use of large and recent data set for learning; (2) use of PSI-BLAST profiles, which finds more distantly related homologs than pair-wise search methods against a nonredundant database; and (3) use of a second filter network, which includes predictions from the first network and secondary structure information from a highly successful method PSIPRED.
To begin, the net is first trained with single sequences encoded as binary bits. The results of prediction when net is trained on single sequences are better than statistical methods and comparable to BTPRED results with a single network. It has MCC of 0.31. A second-level network has been used to refine the results produced by the first network. In second network, at each position in the window, the turn/nonturn outputs from the first network and predicted secondary structure states are used in place of sequence information as input to the network. The architecture of the second-level network is the same as for the first-level network. The performance is further improved by using a second filtering network and secondary structure information. The accuracy is improved by 3%, and MCC is raised from 0.31 to 0.41. A significant improvement in Qpred and Qobs values has also been achieved. The effect of two secondary structure prediction methods, PHD and PSIPRED, on β-turn prediction accuracy has also been assessed, and it has been found that β-turn prediction by incorporating PSIPRED-predicted secondary structure is more accurate for the same cross-validated set than is that for PHD. The higher prediction accuracy of PSIPRED compared with PHD is the reason of better β-turn prediction results with PSIPRED in comparison to PHD.
A new approach that uses PSI-BLAST to generate multiple sequence alignment profiles has been implemented for β-turn prediction. The first-level net is trained on the PSI-BLAST–generated position-specific matrices, which are produced as part of PSIPRED prediction method. MCC is dramatically increased, from 0.31 of single sequence to 0.37, which is even better than that with BTPRED. Improvement in other performance measures can also be observed. So, β-turn prediction accuracy is improved by taking into account the information brought about by multiple alignment matrices. The overall results in comparison to single sequence shows an additional gain in performance, and the method reaches the final accuracy of 73.5%. The reason for such a better performance is that at alignment level, PSI-BLAST produces profiles by searching homologs against a large nonredundant database. It is a sensitive scoring system, which involves the probabilities with which amino acids occur at various positions. As expected, the prediction accuracy is further improved by using a second filtering network trained on predictions from first network, along with predicted secondary structure information. The MCC is raised from 0.37 to 0.43, the maximum value for β-turn prediction achieved so far.
The improvements in β-turn prediction performance so obtained are significant, especially in the context of overall increase in prediction accuracy of secondary structure prediction, and will be helpful to the researchers working in the field of fold recognition. The method depends on the accuracy of secondary structure prediction method. The suggested approach has a larger potential for further improvement of prediction accuracy, especially in view of the further extension or growth of the sequence database of proteins and a further improvement in protein secondary structure prediction.
Materials and methods
The data set
In present study, the data set is comprised of 426 nonhomologous protein chains as described by Guruprasad and Rajkumar (2000). In this data set, no two protein chains have > 25% sequence identity. The structure of these proteins is determined by X-ray crystallography at ≥2.0-Å resolution. Each chain contains at minimum one β-turn. The PROMOTIF program has been used to assign β-turns in proteins (Hutchinson and Thornton 1996).
The extracted β-turn residues have been assigned different secondary structure states by DSSP (Kabsch and Sander, 1983). It has been found that the maximum number of β-turn residues have T state followed by S state in their nomenclature (see Electronic Supplemental Material).
Sevenfold cross-validation
A prediction method is often developed by cross-validation or jack-knife method (Chou and Zhang 1995). Because of the size of the data set, the jack-knife method (individual testing of each protein in the data set) was not feasible, so a more limited cross-validation technique has been used, in which the data set is randomly divided into seven subsets, each containing equal number of proteins. Each set is an unbalanced set that retains the naturally occurring proportion of β-turns (∼25%) and nonturns.
The data set has been divided into training set, validation set, and testing set. The training set is consisted of five of these subsets. The network is validated for minimum error on validation set to avoid over-training, and the network is tested on the excluded set of proteins, the testing set. This has been done seven times to test for each subset. The final prediction results have been averaged over seven testing sets.
Neural network architecture
In the present study, two feed-forward back-propagation networks with a single hidden layer are used. Both the networks have input window that is nine residues wide, and have 10 units in a single hidden layer. The target output consists of a single binary number and is one or zero (true or false). The window is shifted residue by residue through the protein chain, thus yielding N patterns for a chain with N residues. This is in accordance with the previous work (Shepherd et al. 1999), which showed that a window size of nine gave optimal prediction results. The architecture of the network system used in present work is shown in Figure 2 ▶.
Figure 2.

The network system used for β-turn prediction. The network system consists of two networks: first-level sequence-to-structure network and second-level structure-to-structure network. Shaded circles indicate basic cell containing 20 + 1 units to code residues at that position in the window. Here, window size is nine. Square boxes indicate hidden layer containing 10 units. In second-level network, four units encode each residue. Solid circles indicate prediction obtained from first network; open circles, secondary structure state (coil, helix, and strand).
For the neural network implementation and to generate the neural network architecture and the learning process, the publicly available free simulation package SNNS, version 4.2, from Stuttgart University is used (Zell and Mamier 1997). It allows incorporation of the resulting networks into an ANSI C function for use in stand-alone code. A linear activation function is used. At the start of each simulation, the weights are initialized with the random values. The training is carried out by using error back-propagation with a sum of square error function (SSE; Rumelhart et al. 1986). The magnitude of the error sum in the test and training set is monitored in each cycle of the training. The ultimate number of cycles is determined where the network converges. During the testing of network, a cutoff value is set for each network, and the output produced by the network is compared with the cutoff value. If the output is greater than the cutoff value, then that residue is taken as a β-turn residue, whereas if it is lower, it is considered as a non–β-turn. For each network, the cutoff value is adjusted that it yields the highest accuracy for that network. An overview of each network is given below.
First level: sequence-to-structure net
The input to the first network is either single sequence or multiple alignment profiles. Patterns are presented as window of nine residues, in which a prediction is made for the central residue. With single sequence input, binary encoding scheme has been used. In this scheme, each amino acid at each window position is encoded by a group of 21 inputs, 20 units code for each possible amino acid type at that position and one is used when the moving window overlaps the amino- or carboxy-terminal end of the protein. In each group of 21 inputs, the input corresponding to the amino acid type at that window position is set to one, and all other inputs are set to zero.
With multiple alignment profile input, the position-specific scoring matrix generated by PSI-BLAST has been used as input to the neural network. The matrix has 21 × M real-number elements, where M is the length of the target sequence. Each element represents the likelihood of that particular residue substitution at that position. Thus, 21 real numbers rather than binary bits encode each residue.
Second level: Structure-to-structure net
An important feature of the predictions generated by the first network is that they are uncorrelated; that is, the network made prediction for each residue in isolation without reference to neighboring prediction. The correlation can be taken into account by using a second level, a structure-to-structure network. Qian and Sejwonski (1988) achieved 1% improvement in secondary structure prediction accuracy by using a second filtering network.
The input to second filtering network is predictions obtained from the first net and the predicted secondary structure. Four units encode each residue, in which one unit codes for turn/nonturn prediction from first network, and it is either set to one or zero. The remaining three units code for three secondary structure states (helix, strand, and coil; Fig. 2 ▶).
Secondary structure information is also encoded by the actual probabilities of three states provided in the output of the PSIPRED prediction. The probabilities are just the strengths of the prediction for each of the three target states (helix, strand, coil) and are represented by a real number in the range zero to one. The actual score of turn/nonturn predictions obtained from first network is also used as input to the network in the place of binary bits.
Multiple alignment or position-specific scoring matrices
PSIPRED uses PSI-BLAST to detect distant homologs of a query sequence and generate position-specific scoring matrix as part of the prediction process, and here, we have used these intermediate PSI-BLAST–generated position-specific scoring matrices as a direct input to the first-level network. The matrix has 21 × M elements, where M is the length of the target sequence, and each element represents the frequency of occurrence of each of the 20 amino acids at one position in the alignment (Altschul et al. 1997).
Secondary structure prediction and assignment
The second filtering network is trained with output obtained from first network and predicted secondary structure information. In order to prove that β-turn prediction accuracy depends on the accuracy of secondary structure prediction, two methods have been used for predicting secondary structure: PHD (Rost 1996) and PSIPRED (Jones 1999). The protein secondary structure assignment by DSSP is used to establish an upper bound of predictive performance. DSSP provides eight states assignment of secondary structure (Kabsch and Sander 1983). The eight states of DSSP have been decomposed into three states (G, H, and I are taken as helices; B and E as strand; and the rest as coil).
Filtering the prediction
Because the prediction is performed for each residue separately, the final prediction includes a number of unusually short β-turns of one or two residues. Although the second-level structure-to-structure network corrects the tendency of the first-level sequence-to-structure network to predict too short β-turns, the final predictions still contain single residue β-turns. To exclude such unrealistic turns, we have applied simple filtering rule, the "state-flipping" rule, as described in the work of Shepherd et al. (1999). A set of four rules have been used in the following order: flip isolated nonturn predictions to turn (i.e., t-t → ttt), flip isolated turn predictions to nonturn (i.e., -t- → —), flip isolated pairs of turn predictions to nonturn (i.e., -tt- → —), and flip the adjacent nonturn predictions to turn (i.e., -ttt- → tttt- or -tttt).
Performance measures
Performance measures used are categorized as the following.
Threshold-dependent measures
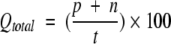
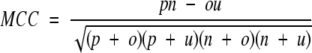
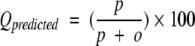
Four parameters have been used in present work to measure the performance of prediction method as described by Shepherd et al. (1999). Following is the brief description of these parameters: (1) Qtotal (or prediction accuracy) is the percentage of correctly classified residues, (2) MCC accounts for both over and under-predictions, (3) Qpred is the percentage of correct prediction of β-turns (or probability of correct prediction), and (4) Qobs is the percentage of observed β-turns that are correctly predicted (or percent coverage). The parameters can be calculated by following equations:
 |
 |
 |
 |
where p and n are number of correctly classified β-turn and non–β-turn residues, respectively; and o and u are the number of incorrectly classified β-turn and non–β-turn residues, respectively.
Threshold-independent measures
One problem with the threshold-dependent measures is that they measure the performance on a given threshold. They fail to use all the information provided by a method. The ROC is a threshold-independent measure that was developed as a signal processing technique. For a prediction method, ROC plot is obtained by plotting all sensitivity values (true-positive fraction) on the y-axis against their equivalent (1-specificity) values (false-positive fraction) for all available thresholds on the x-axis. The area under the ROC curve is taken as an important index because it provides a single measure of overall accuracy that is not dependent on a particular threshold (Deleo 1993). It measures discrimination, the ability of a method to correctly classify β-turn and nonturn residues. Sensitivity (Sn) and specificity (Sp) are defined as
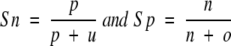 |
Electronic supplemental material
The supplemental information has Protein Data Bank codes of protein chains used in the present study. Supplemental Table 1 contains the composition of seven different training sets. Supplemental Table 2 has secondary structure composition of β-turn residues in terms of DSSP eight states. Supplemental Table 3 contains the β-turn positional frequencies for all 20 amino acids. Supplemental Table 4 contains the results of β-turn/nonturn predictions, with a single network trained on single sequences and its comparison with other methods tested on the same data set. Supplemental Figure 1 ▶ shows a sample output of β-turn/nonturn predictions by the BetaTPred2 server.
Availability
The program is implemented on the Web server BetaTPred2, available at http://www.imtech.res.in/raghava/betatpred2/ by using CGI/Perl script. The SNNS-generated network is converted into C program and is used as an interface.
Users can enter primary amino acid sequence in fasta or free format. The residues can be predicted as β-turn or non–β-turn residues. Prediction can also be e-mailed back to them after a short period of time, depending on the server load.
Acknowledgments
We thank Dr. Balvinder Singh for checking the manuscript. We also thank the Council of Scientific and Industrial Research (CSIR) and the Department of Biotechnology (DBT), India, for financial assistance.
The publication costs of this article were defrayed in part by payment of page charges. This article must therefore be hereby marked "advertisement" in accordance with 18 USC section 1734 solely to indicate this fact.
Article and publication are at http://www.proteinscience.org/cgi/doi/10.1110/ps.0228903.
Supplemental material: See www.proteinscience.org.
References
- Altschul, S.F., Madden, T.L., Alejandro, A.S., Zhang, J., Zhang, Z., Miller, W., and Lipman, D.J. 1997. Gapped blast and psi-blast: A new generation of protein databases and search programs. Nucleic Acids Res. 25 3389–3402. [DOI] [PMC free article] [PubMed] [Google Scholar]
- Chou, K.C. 1997. Prediction of β-turns. J. Pept. Res. 49 120–144. [PubMed] [Google Scholar]
- ———. 2000. Prediction of tight turns and their types in proteins. Anal. Biochem. 286 1–16. [DOI] [PubMed] [Google Scholar]
- Chou, K.C. and Blinn, J.R. 1997. Classification and prediction of β-turn types. J. Protein Chem. 16 575–595. [DOI] [PubMed] [Google Scholar]
- Chou, K.C. and Zhang, C.T. 1995. Prediction of protein structural classes. Crit. Rev. Biochem. Mol. Biol. 30 275–349. [DOI] [PubMed] [Google Scholar]
- Chou, P.Y. and Fasman, G.D. 1974. Conformational parameters for amino acids in helical, β-sheet and random coil regions calculated from proteins. Biochemistry 13 211–222. [DOI] [PubMed] [Google Scholar]
- ———. 1979. Prediction of β-turns. Biophys. J. 26 367–384. [DOI] [PMC free article] [PubMed] [Google Scholar]
- Deleo, J.M. 1993. Proceedings of the second International Symposium on Uncertainty Modelling and Analysis, pp. 318–325. IEEE, Computer Society Press, College Park, MD.
- Garnier, J., Osguthorpe, D.J., and Robson, B. 1987. Analysis and implications of simple methods for predicting the secondary structure of globular proteins. J. Mol. Biol. 120 97–120. [DOI] [PubMed] [Google Scholar]
- Guruprasad, K. and Rajkumar, S. 2000. β- and γ-turns in proteins revisited: A new set of amino acid–dependent positional preferences and potential. J. Biosci. 25 143–156. [PubMed] [Google Scholar]
- Hutchinson, E.G. and Thornton, J.M. 1996. PROMOTIF: A program to identify and analyze structural motifs in proteins. Protein Sci. 5 212–220. [DOI] [PMC free article] [PubMed] [Google Scholar]
- Jones, D.T. 1999. Protein secondary structure prediction based on position-specific scoring matrices. J. Mol. Biol. 292 195–202. [DOI] [PubMed] [Google Scholar]
- Kabsch, W. and Sander, C. 1983. Dictionary of protein secondary structure: Pattern recognition of hydrogen-bonded and geometrical features. Biopolymers 22 2577–2637. [DOI] [PubMed] [Google Scholar]
- Kaur, H. and Raghava, G.P.S. 2002. An evaluation of β-turn prediction methods. Bioinformatics 18 1508–1514. [DOI] [PubMed] [Google Scholar]
- Przybylski, D. and Rost, B. 2002. Alignments grow, secondary structure prediction improves. Proteins 46 197–205. [DOI] [PubMed] [Google Scholar]
- Qian, N. and Sejnowski, T.J. 1988. Predicting the secondary structure of globular proteins using neural network models. J. Mol. Biol. 202 865–884. [DOI] [PubMed] [Google Scholar]
- Richardson, J.S. 1981. The anatomy and taxonomy of protein structure. Adv. Protein Chem. 34 167–339. [DOI] [PubMed] [Google Scholar]
- Rose, G.D., Gierasch, L.M., and Smith, J.A. 1985. Turns in peptides and proteins. Adv. Protein Chem. 37 100–109. [DOI] [PubMed] [Google Scholar]
- Rost, B. 1996. PHD: Predicting one-dimensional protein structure by profile based neural networks. Meth. Enzymol. 266 525–539. [DOI] [PubMed] [Google Scholar]
- Rost, B. and Sander, C. 1993. Prediction of protein secondary structure at better than 70% accuracy. J. Mol. Biol. 232 584–599. [DOI] [PubMed] [Google Scholar]
- Rumelhart, D.E., Hinton, G.E., and Williams, R.J. 1986. Learning representations by back-propagation errors. Nature 323 533–536. [Google Scholar]
- Shepherd, A.J., Gorse, D., and Thornton, J.M. 1999. Prediction of the location and type of β-turns in proteins using neural networks. Protein Sci. 8 1045–1055. [DOI] [PMC free article] [PubMed] [Google Scholar]
- Takano, K., Yamagata, Y., and Yutani, K. 2000. Role of amino acid residues at turns in the conformational stability and folding of human lysozyme. Biochemistry 39 8655–8665. [DOI] [PubMed] [Google Scholar]
- Wilmot, C.M. and Thornton, J.M. 1988. Analysis and prediction of the different types of β-turns in proteins. J. Mol. Biol. 203 221–232. [DOI] [PubMed] [Google Scholar]
- Zell, A. and Mamier, G. 1997. Stuttgart neural network simulator, version 4.2. University of Stuttgart, Stuttgart, Germany.
- Zhang, C.T. and Chou, K.C. 1997. Prediction of β-turns in proteins by 1–4 & 2–3 correlation model. Biopolymers 41 673–702. [Google Scholar]