Abstract
A hallmark of soluble globular protein tertiary structure is a hydrophobic core and a protein exterior populated predominantly by hydrophilic residues. Recent hydrophobic moment profiling of the spatial distribution of 30 globular proteins of diverse size and structure had revealed features of this distribution that were comparable. Analogous profiling of the hydrophobicity distribution of the α-helical buried bundles of several transmembrane proteins, as the lipid/protein interface is approached from within the bilayer, reveals spatial hydrophobicity profiles that contrast with those obtained for the soluble proteins. The calculations, which enable relative changes of hydrophobicity to be simply identified over the entire spatial extent of the multimer within the lipid bilayer, show the accumulated zero-order moments of the bundles to be mainly inverted with respect to that found for the soluble proteins. This indicates a statistical increase in the average residue hydrophobic content as the lipid bilayer is approached. This result differs from that of a relatively recent calculation and qualitatively agrees with earlier calculations involving lipid exposed and buried residues of the α-helices of transmembrane proteins. Spatial profiling, over the entire spatial extent of the multimer with scaled values of residue hydrophobicity, provides information that is not available from calculations using lipid exposure alone.
Keywords: Transmembrane proteins, α-helical bundles, hydrophobicity, spatial profiling, zero-order moment
The distribution of residue hydrophobicity from protein interior to exterior has been a subject of continued interest. The identification of the hydrophobic core of soluble globular proteins (Kauzmann 1959; Perutz et al. 1965; Meirovitch and Scheraga 1981; Kytte and Doolittle 1982) has provided a key feature relating an amino acid attribute to tertiary protein structure. Furthermore, a detailed relationship between the hydrophobic character of a local sequence of amino acids and variations of its proximity to the protein exterior has been described (Rose 1978; Rose and Roy 1980; Kidera et al. 1985). The spatial segregation of residues, dependent on amino acid hydrophobicity, has also assisted with validating predicted native protein structures (Novotny et al. 1988; Holm and Sander 1992; Huang et al. 1995; Bonneau et al. 2001), as well as with identifying the origin of nucleation sites during the initiation of protein folding (Lee and Shin 2001; Zagrovic et al. 2001; R. Zhou et al. 2001).
Although there has been a general consensus of opinion concerning the overall hydrophobic spatial distribution of the residues of soluble proteins, opinion concerning the hydrophobic distribution of the residues of transmembrane protein structures has had a more varied history. Early work (Engelman and Zaccai 1980) had indicated that bacteriorhodopsin was an inside-out protein. The term “inside-out” referred to a reversed sense of the hydrophobic distribution within the lipid bilayer from that of soluble globular proteins, namely, that the interior was composed of hydrophilic residues and the exterior of hydrophobic residues. Apparently the inside-out model of membrane protein structure is no longer accepted (White and Wimley 1999; Rees and Eisenberg 2000). Notwithstanding, a relatively recent calculation (Stevens and Arkin 1999) that uses solvent–lipid accessibility, as have prior investigations (Rees et al. 1989; Wallin et al. 1997), and purports to discredit the “inside-out” hypothesis, actually attempts to discredit a more general hypothesis, namely, that residues of greater hydrophobic character have a statistical preference to reside nearer the protein–lipid interface. This latter hypothesis is independent of the residue character of the protein interior, being a statement of variations about the mean or average residue hydrophobicity of the distribution, whatever that distribution might be.
Motivated by this, the present paper investigates the distribution of residue hydrophobicity of several transmembrane proteins from a different point of view. The direct spatial profiling of the residue distribution of the multimeric protein structures is performed without reference to residue solvent–lipid accessibility. Profiling in this manner also enables a determination of the spatial distribution of hydrophobicity within the interior of the structure, where the residue solvent–lipid exposure either vanishes or is minimal. Spatial profiling across the extent of a protein structure, from interior to exterior, has been performed previously (Meirovitch and Scheraga 1981).
A recent calculation (Silverman 2001) had examined the spatial distribution of the residue hydrophobicity of soluble globular proteins. It was shown that shifting the scale of residue hydrophobicity, such that the total residue hydrophobicity of each structure vanished, enabled variations of the spatial distribution of residue hydrophobicity about the mean of the distribution to be simply identified. It also enabled a comparison to be made between the hydrophobicity distributions of different proteins over their different length scales. Such procedure is, therefore, appropriate for examining spatial variations of the hydrophobic content of the residues of transmembrane proteins. It not only addresses the question of the hydrophobic statistical preference of residues directly, but also provides information over the entire multimeric extent, not only in the region proximate to the protein–lipid interface.
The hydrophobicity profiles of globular proteins had revealed two spatial regions delineating the hydrophobic core and hydrophilic exterior. The profiles of the multimers comprised of transmembrane α-helices, although mainly inverted with respect to the profiles of the globular proteins, do not always exhibit such uniform delineation. The spatial profiling of structures about the normal to the plane of the lipid bilayer yields features related to structural details within the interior of the helical bundle as well as features related to exterior local structural details that are not characteristic of the entire protein–lipid periphery. On the other hand, the major fraction of residues that are proximate to the protein–lipid interface for all of the α-helical structures investigated will be shown to exhibit a statistical increase in residue hydrophobic content as the interface is approached. The results, therefore, qualitatively agree with previous calculations involving surface-exposed and buried residues (Rees et al. 1989; Wallin et al. 1997). This increase in residue hydrophobic content, as the protein–lipid interface is approached is, however, more modest than the converse variation observed for the soluble globular proteins.
Materials and methods
Eleven transmembrane protein structures with an SCOP (Murzin et al. 1995) “membrane all-αfold” classification were downloaded from the Protein Data Bank (Berman et al. 2000). The light-driven ion pump, bacteriorhodopsin, 1C3W (Luecke et al. 1999), and the photosynthetic reaction center, Rhodobacter sphaeroides 1PCR (Ermler et al. 1994), were chosen because they had been the subject of previous discussion (Engelman and Zaccai 1980;Rees et al 1989) focused on their spatial distribution of apolar and polar residues. Three of the structures were chosen because of their symmetric, as well as diverse multimeric geometries. The gated mechanosensitive ion channel from Mycobacterium tuberculosis, 1MSL (Chang et al. 1998), was chosen because of its interestingly entwined multimeric cylindrical symmetry with helices that are canted significantly with respect to the surface of the lipid bilayer. The subunit C of the ATP synthase from Escherichia coli, 1C17 (Rastogi and Girvin 1999), was chosen because of its cylindrically symmetric set of helices approximately perpendicular to the lipid bilayer. The potassium ion channel from Streptomyces lividans, 1K4D (Y. Zhou et al. 2001), was chosen because of the overall conical geometry of its membrane-spanning segment.
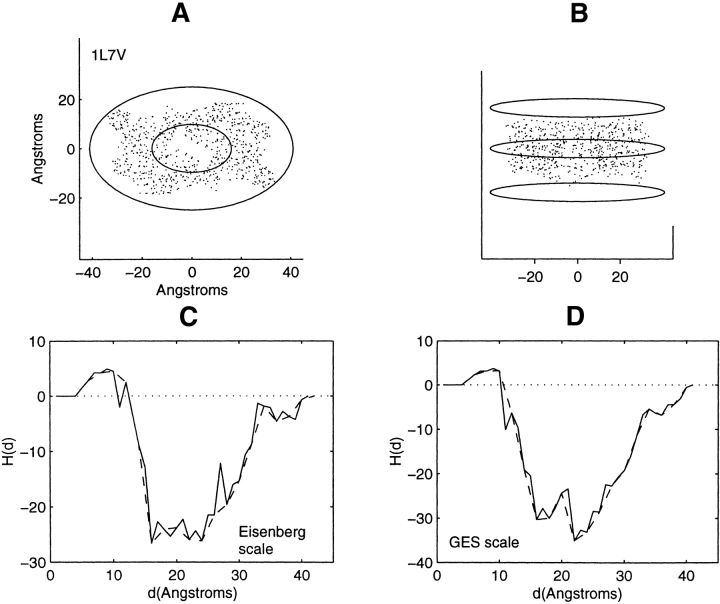
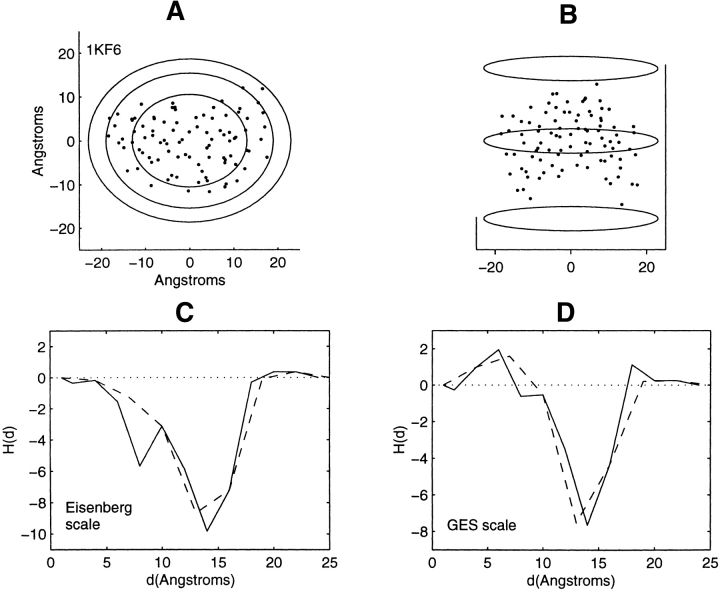
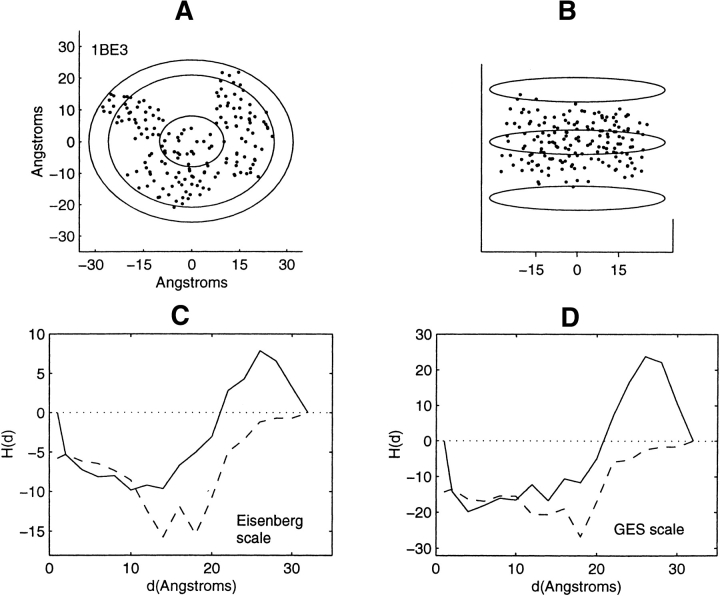
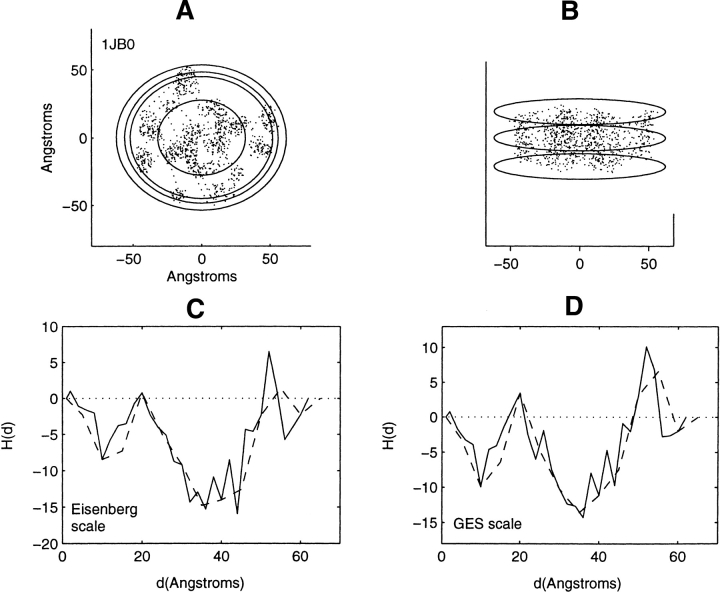
Six structures lacking symmetry about an axis normal to the plane of the bilayer were additionally chosen (recommended by one reviewer). The six are the cytochrome-C oxidase, 1EHK (Soulimane et al. 2000); the Aqp1 water channel, 1J4N (Sui et al. 2001); the bacterial Abc transporter, 1L7V (Locher et al. 2002); E. coli quinol-fumarate reductase, 1KF6 (Iverson et al. 2002); the cytochrome Bc1 complex, 1BE3 (Iwata et al. 1998); and the photosynthetic reaction center: Photosystem I, 1JB0 (Jordan et al. 2001).
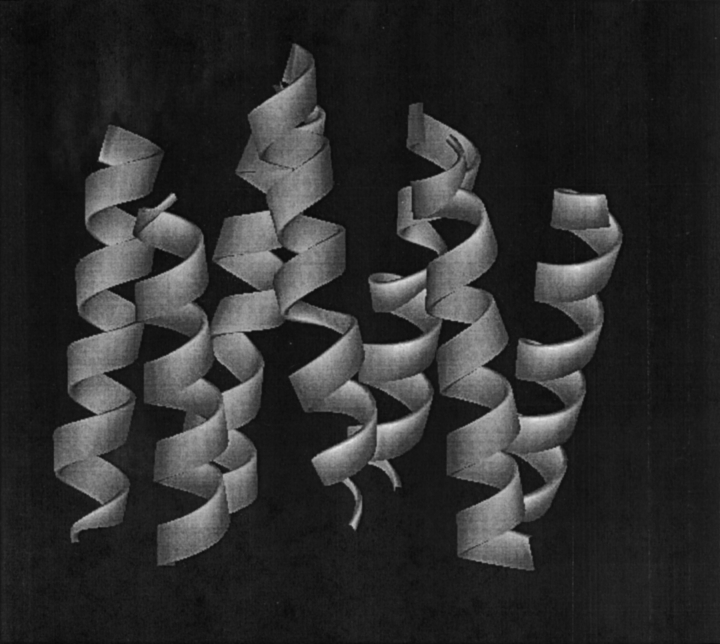
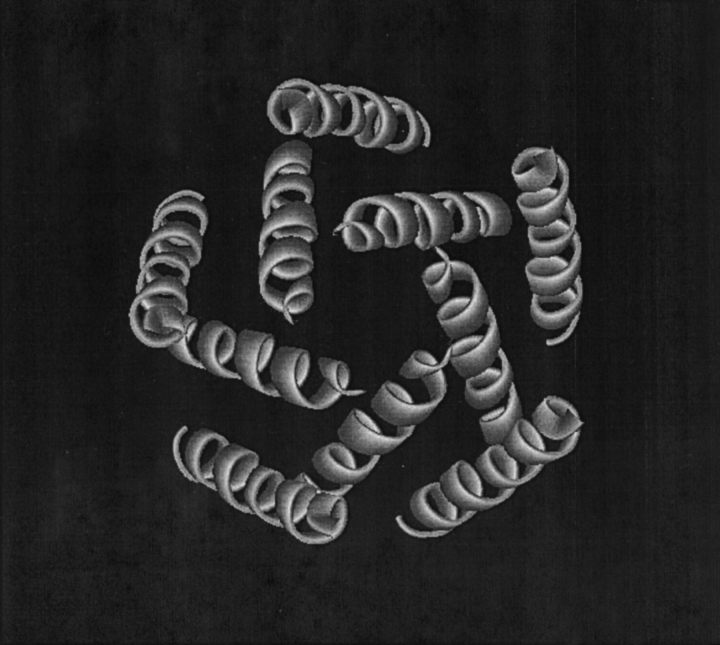
Prior to calculation, residues presumed to be external to the membrane were removed. These residues were identified by hydrophobicity sliding-window analysis (Kytte and Doolittle 1982) and by visual inspection. The final truncated protein structures were composed of a majority of α-helices with five turns or greater. Figure 1 ▶ shows the truncated structure of the seven helices of bacteriorhodopsin after residue elimination. The largest structure, the photosynthetic reaction center 1JB0, contained 31 truncated helices.
Figure 1.
The truncated structure of the seven A-chain helices of bacteriorhodopsin, 1C3W.
The centroid of each residue side chain of the truncated structure is calculated, and the geometric center of the distribution of residue centroids is obtained. The shape of a profiling geometry is then chosen, and the hydrophobicity profile is calculated about the axis through the geometric center and normal to the plane of the membrane. For the structures exhibiting symmetry about the profiling axis, namely, 1C3W, 1C17, 1MSL, and 1K4D, the choice of the profiling geometry was chosen to approximate the overall external shape of the multimer within the lipid bilayer, and a series of nested shapes consistent with this geometry was generated. This choice of nested shapes provides contours about the profiling axis that correlate with the lipid exposure for residues proximate to the protein–lipid boundary.
For the structures with no symmetry about the profiling axis, an elliptical cylinder was chosen for profiling. At the greatest distances from the profiling axis, averages with ellipses over an irregular distribution of protein centroids will have contributions from local regions that are most distant from the profiling axis. This contrasts with the averages over the symmetric structures, where at large distances from the profiling axis, symmetrically related features that are not spatially contiguous are included in the average. Certain consequences of averaging over the structures lacking symmetry are discussed below.
Results are obtained for the Eisenberg (Eisenberg et al. 1982) and for the GES (Engelman et al. 1986) scales of residue hydrophobicity. The GES scale was chosen because it had been used in the previous calculation (Stevens and Arkin 1999) alluded to. Although these two particular scales have been used, the overall qualitative features to be described would be relatively insensitive to the choice of any scale that would similarly segregate the amino acid values of hydrophobicity into apolar, polar uncharged, and polar charged residues. The scales are shifted to provide a value of zero hydrophobicity when all residues of each truncated structure are collected. The shifted values are also scaled to provide a standard deviation of unity for each structure. Because the average value of residue hydrophobicity of the entire structure is then zero, this shift of the scale enables a simple interpretation of the changes in the accumulated values of residue hydrophobicity with increasing distance from the protein interior. If the value increases with increasing distance from the interior, residues of greater hydrophobic content than the average of the entire structure have been collected. If the value decreases with increasing distance from the interior, residues of lesser hydrophobic content have been collected. Shifting the scale of residue hydrophobicity in this manner then provides a baseline for comparison of changes in the spatial distribution of residue hydrophobicity of the truncated structures. It enables concise quantitative statements of the spatial changes in residue hydrophobicity that are independent of the overall hydrophobic content of the structures as well as enabling a comparison of these changes over the spatial extent of different structures.
With the choice of a profiling geometry the values of residue hydrophobicity are then accumulated as a function of increasing size of each nested shape of the profiling geometry until the largest shape encapsulates all of the residues. The accumulated spatial distribution of residue hydrophobicity, or accumulated zero-order moment profile, is given by the function H(d). H(d) is the sum of the values of residue hydrophobicity within the circular, elliptical, or conical cylinder of radius d (Silverman 2001).
 |
The hi’ are the shifted and scaled values of hydrophobicity of the i-th residue. The hydrophobicity profile is obtained by calculating the values of H(d) in steps of either 1 or more angstroms. As previously noted, the changes in H(d) are interpreted simply for each increasing value of d. If H(d) increases, the average hydrophobic value of the residues collected over the shell of width 1 or more angstroms is greater than the average value of residue hydrophobicity for the entire structure. If H(d) decreases, residues of less than average hydrophobic value have been collected. Any subsequent comment made with regard to increasing or decreasing hydrophobic residue content is then made with respect to the average value of residue hydrophobicity of the entire structure.
Collecting the values of residue hydrophobicity in this manner provides a set of sequential values of accumulated residue hydrophobicity with increasing distance from the center of the structure to the protein–lipid interface within the bilayer. These values are a zero-order moment profile of the residue hydrophobicity from the interior to the exterior of the structure. Such profiles had been previously obtained for 30 soluble globular proteins (Silverman 2001). A second-order moment, which had been used to amplify the distance dependence of the hydrophobicity distribution, and had provided the quasi-invariant hydrophobic ratio of distances for soluble globular proteins, is not used in the present analysis.
Results
Figures 2, 3, and 5–13 ▶ ▶ ▶ ▶ ▶ ▶ ▶ ▶ ▶ ▶ ▶ below graphically illustrate the hydrophobicity profiles H(d) for the structures and the distribution of residue centroids with elliptical or circular boundaries that delimit regions of contrasting behavior. The shapes are mainly inverted with respect to the shapes obtained for the 30 soluble globular proteins previously investigated. The interior regions exhibit diverse behavior, either populated, on average, by residues of greater than, roughly equal to, or of lesser hydrophobic content than the average of the entire structure. All of the profiles display an intermediate spatial region of decreasing hydrophobic content. At the most distant values from the interior, the majority of the profiles increase, on average, with increasing distance. The few profiles that do not, namely, profiles of the structures 1KF6, 1BE3, and 1JB0, reflect averages over local regions of the interface and not averages over a major portion of the interface. The average over the major fraction of the interface near the protein–lipid boundary shows a statistical increase in residue hydrophobic content with decreasing distance to the protein–lipid interface for all 11 structures.
Figure 2.
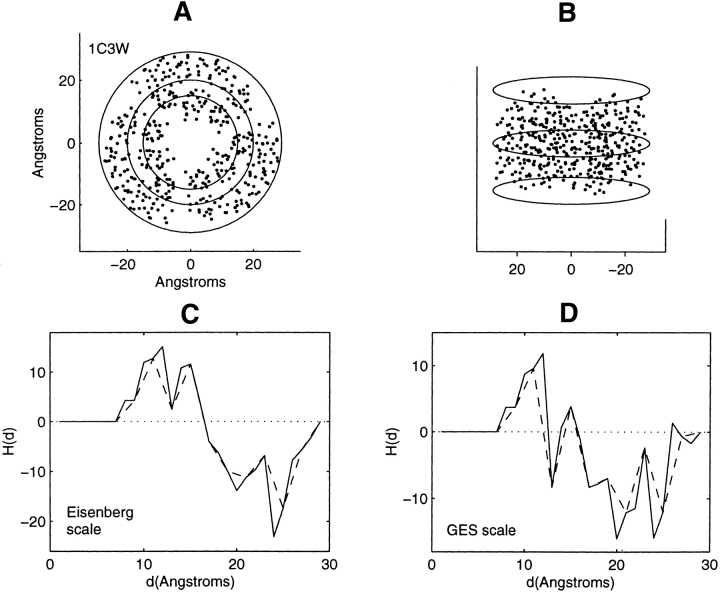
Distribution of residue centroids and hydrophobicity profiles of bacteriorhodopsin, 1C3W. (A) A view along the C3 symmetry axis normal to the plane of the membrane. (B) A view canted by 80° from the symmetry axis. (C) The hydrophobicity profile H(d) calculated with the Eisenberg hydrophobicity scale. (D) The hydrophobicity profile H(d) calculated with the GES hydrophobicity scale. The solid and dashed lines in C and D are calculated in steps of 1 Å and of 2 Å, respectively.
Figure 3.
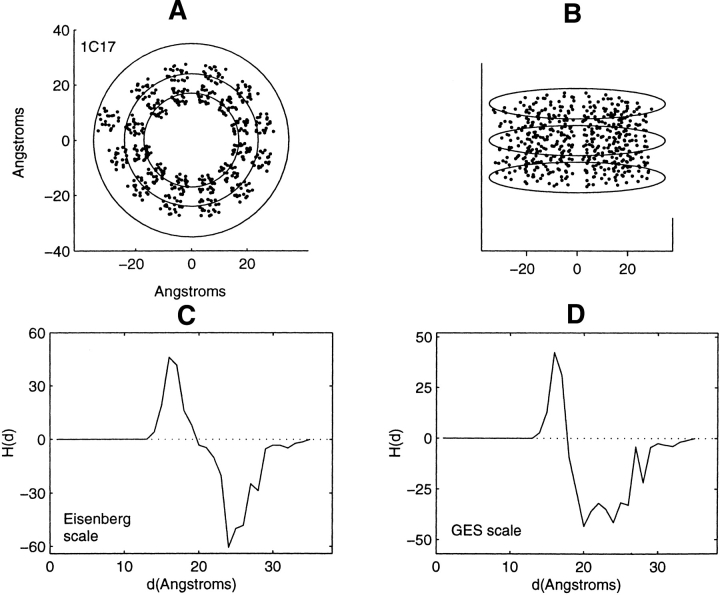
Distribution of residue centroids and hydrophobicity profiles of the subunit C of the ATP synthase from Escherichia coli, 1C17. (A) A view along the C3 symmetry axis normal to the plane of the membrane. (B) A view canted by 80° from the symmetry axis. (C) The hydrophobicity profile H(d) calculated with the Eisenberg hydrophobicity scale. (D) The hydrophobicity profile H(d) calculated with the GES hydrophobicity scale. The solid lines in C and D are calculated in steps of 1 Å.
Figure 5.
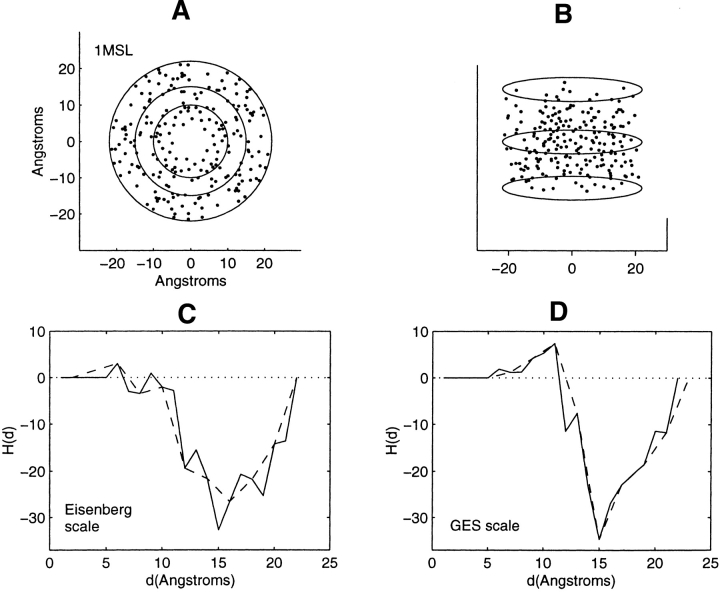
Distribution of residue centroids and hydrophobicity profiles of the gated mechanosensitive ion channel from Mycobacterium tuberculosis, 1MSL. (A) A view along the C3 symmetry axis normal to the plane of the membrane. (B) A view canted by 80° from the symmetry axis. (C) The hydrophobicity profile H(d) calculated with the Eisenberg hydrophobicity scale. (D) The hydrophobicity profile H(d) calculated with the GES hydrophobicity scale. The solid and dashed lines in C and D are calculated in steps of 1 Å and of 2 Å, respectively.
Figure 6.
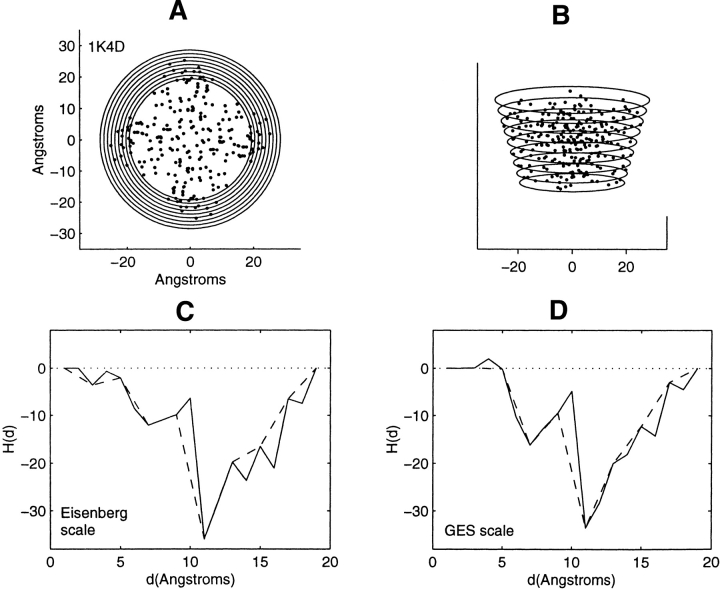
Distribution of residue centroids and hydrophobicity profiles of the potassium ion channel from Streptomyces lividans, 1K4D. (A) A view along the symmetry axis normal to the plane of the membrane. (B) A view canted by 80° from the symmetry axis. (C) The hydrophobicity profile H(d) calculated with the Eisenberg hydrophobicity scale. (D) The hydrophobicity profile H(d) calculated with the GES hydrophobicity scale. The solid and dashed lines in C and D are calculated in steps of 1 Å and of 2 Å, respectively. d is the radius of the smallest radial cross-section of the cone.
Figure 7.
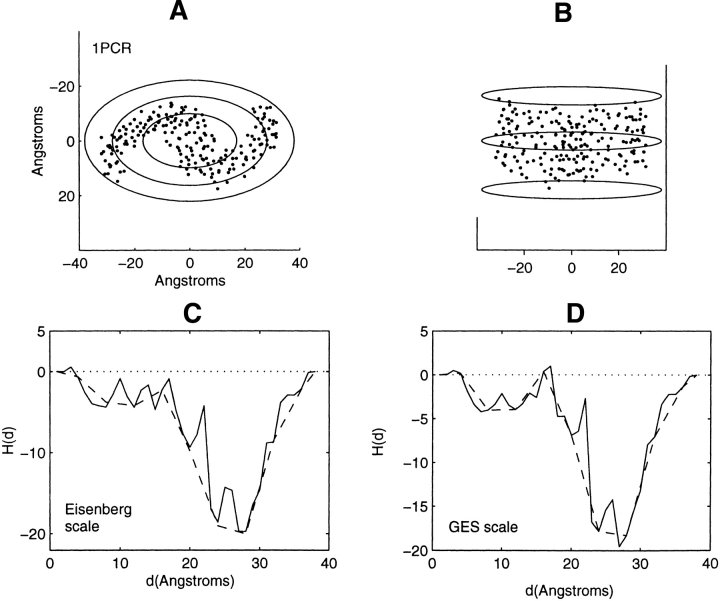
Distribution of residue centroids and hydrophobicity profiles of the photosynthetic reaction center, Rhodobacter sphaeroides, 1PCR. (A) A view along the axis normal to the plane of the membrane. (B) A view canted by 80° from the symmetry axis. (C) The hydrophobicity profile H(d) calculated with the Eisenberg hydrophobicity scale. (D) The hydrophobicity profile H(d) calculated with the GES hydrophobicity scale. The solid and the dashed lines in C and D are calculated in steps of 1 Å and 4 Å, respectively.
Figure 8.
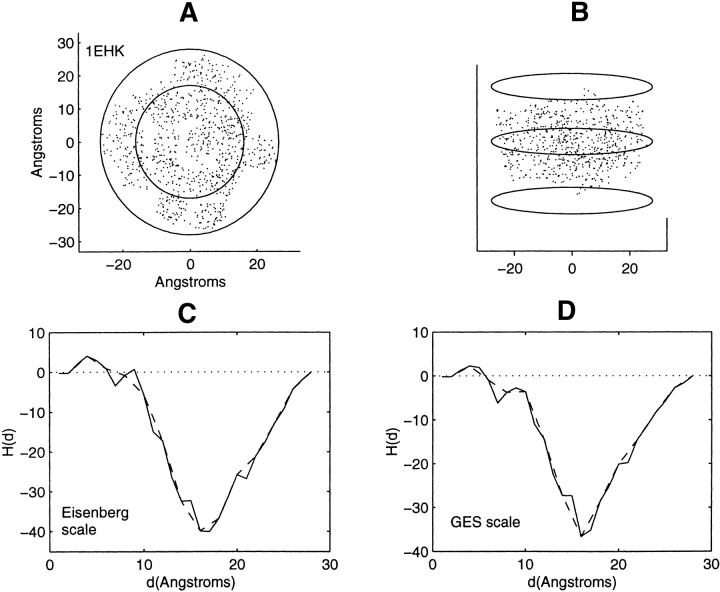
Distribution of residue centroids and hydrophobicity profiles of the cytochrome-C oxidase, 1EHK. (A) A view along the axis normal to the plane of the membrane. (B) A view canted by 80° from the symmetry axis. (C) The hydrophobicity profile H(d) calculated with the Eisenberg hydrophobicity scale. (D) The hydrophobicity profile H(d) calculated with the GES hydrophobicity scale. The solid and the dashed lines in figures C and D are calculated in steps of 1 Å and of 2 Å, respectively.
Figure 9.
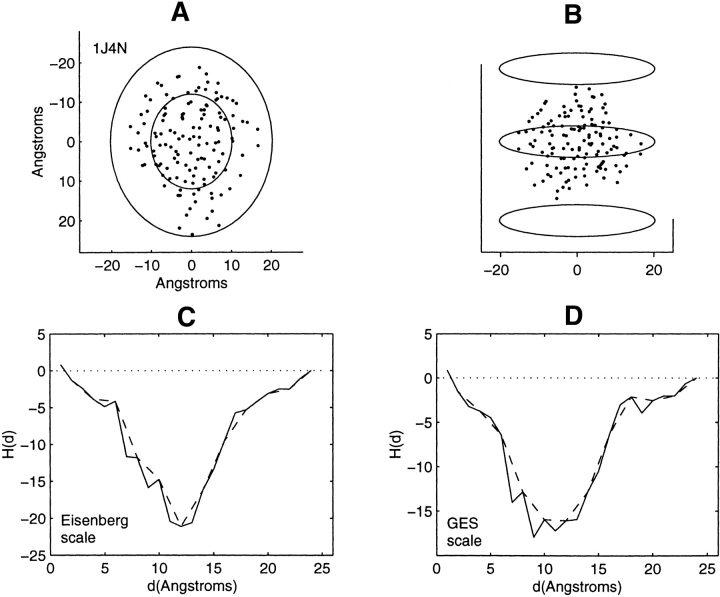
Distribution of residue centroids and hydrophobicity profiles of the Aqp1 water channel, 1J4N. (A) A view along the axis normal to the plane of the membrane. (B) A view canted by 80° from the symmetry axis. (C) The hydrophobicity profile H(d) calculated with the Eisenberg hydrophobicity scale. (D) The hydrophobicity profile H(d) calculated with the GES hydrophobicity scale. The solid and the dashed lines in C and D are calculated in steps of 1 Å and of 2 Å, respectively.
Figure 10.
Distribution of residue centroids and hydrophobicity profiles of the bacterial Abc transporter, 1L7V. (A) A view along the axis normal to the plane of the membrane. (B) A view canted by 80° from the symmetry axis. (C) The hydrophobicity profile H(d) calculated with the Eisenberg hydrophobicity scale. (D) The hydrophobicity profile H(d) calculated with the GES hydrophobicity scale. The solid and the dashed lines in C and D are calculated in steps of 1 Å and of 2 Å, respectively.
Figure 11.
Distribution of residue centroids and hydrophobicity profiles of E. coli quinol-fumarate reductase, 1KF6. (A) A view along the axis normal to the plane of the membrane. (B) A view canted by 80° from the symmetry axis. (C) The hydrophobicity profile H(d) calculated with the Eisenberg hydrophobicity scale. (D) The hydrophobicity profile H(d) calculated with the GES hydrophobicity scale. The solid and the dashed lines in C and D are calculated in steps of 2 Å and of 3 Å, respectively.
Figure 12.
Distribution of residue centroids and hydrophobicity profiles of the cytochrome Bc1 complex, 1BE3. (A) A view along the axis normal to the plane of the membrane. (B) A view canted by 80° from the symmetry axis. (C) The hydrophobicity profile H(d) calculated with the Eisenberg hydrophobicity scale. (D) The hydrophobicity profile H(d) calculated with the GES hydrophobicity scale. Both solid and dashed lines in C and D are calculated in steps of 2 Å. The solid line is calculated with the inclusion of the D helical chain; the dashed line is calculated with deletion of this chain.
Figure 13.
Distribution of residue centroids and hydrophobicity profiles of the photosynthetic reaction center: Photosystem I, 1JB0. (A) A view along the axis normal to the plane of the membrane. (B) A view canted by 80° from the symmetry axis. (C) The hydrophobicity profile H(d) calculated with the Eisenberg hydrophobicity scale. (D) The hydrophobicity profile H(d) calculated with the GES hydrophobicity scale. The solid and the dashed lines in C and D are calculated in steps of 2 Å and of 5 Å, respectively.
Profile features will be related to the structural features of the α-helical bundles for the structures exhibiting symmetry. Bacteriorhodopsin (1C3W) has been profiled with a series of nested cylinders of varying radii. Figure 2A ▶ is a view along the C3 symmetry axis that lies close to the perpendicular to the plane of the membrane. The distribution of residue centroids is shown along with three cylindrical circular cross-sections of different radii. The largest cylinder with a radius of 29 Å encloses all residue centroids. Figure 2B ▶ is a view that is canted by 80° from this axis. Three circular cross-sections of the largest cylinder are shown in Figure 2B ▶.
Figure 2, C and D ▶, show H(d) calculated with the Eisenberg and the GES residue hydrophobicity scales, respectively. The general trends with increasing radial distance from the cylindrical axis are similar. The first six hydrophobic residues are collected at 8 Å. There is a subsequent increase in H(d), indicating the collection of residues of increasing hydrophobic content within the protein interior. In the range of 15–20 Å, the accumulation of hydrophilic residues and diminishing accumulation of hydrophobic residues are responsible for the plunge to negative values. This range of distances spans the range between the two inner circles of Figure 2A ▶, which delineate the region between the inner and outer nested bundles of α-helices. In this region are the water-bound molecules, the retinal Schiff bases, and three arginine, lysine, and aspartic acid residues. From 24 Å to final residue accumulation at 29 Å there is an increase in the number of hydrophobic residues collected, which include 30 leucine and valine residues.
Figure 3A ▶ shows the truncated residue centroid distribution of 1C17 with a view along the normal to the plane of the membrane. The truncated helices of all 12 chains are approximately perpendicular to the plane of the membrane. The slight deviation from cylindrical symmetry is partially accounted for by the presence of the M chain. This chain, which is adjacent to the helical bundle with approximate cylindrical symmetry, has been deleted in the present calculation. Because the truncated structure exhibits approximate cylindrical symmetry, profiling has been performed with a cylinder of elliptical cross-section. The largest ellipse shown in Figure 3A ▶, enclosing all residue centroids, has a major principal axis of 35 Å. The hydrophobicity profiles, Figure 3, C and D ▶, have shapes qualitatively similar to bacteriorhodopsin. The profiles show an initial increase in hydrophobicity after collection of the first three residues at 14 Å. Between the range of values from 17 to 24 Å there is a significant reduction in the hydrophobic content of the residues collected. This is the range of distances between the two inner ellipses of Figure 3A ▶, and is the range of distances between the inner and outer sets of nested helices. The final region of residue accumulation, between the values of 24 and 35 Å, displays an increase in hydrophobic residue content as the protein–lipid interface from within the bilayer is approached.
Of the 11, 1C3W and 1C17 are the only structures with approximate cylindrical symmetry and with helical axes lying near the normal to the lipid bilayer. Profiles about the cylindrical axes with such orientation will reflect the demarcation between α-helical nested structures differently from helices that are canted with respect to the bilayer surface. Might a region of decreasing hydrophobic content be a general feature of the residue distribution between the nested α-helical bundles of transmembrane proteins?
Figure 4 ▶ is a view of the helices of the truncated mechanosensitive ion channel, 1MSL, along the normal to the membrane surface. Like bacteriorhodopsin, there are sets of interior and exterior helices, which are canted, however, with respect to the membrane surface. A view along the normal to the surface of the bilayer of the distribution of residue centroids, Figure 5A ▶, reveals a region of separation between the centroids of the interior and exterior helices. This region, 10–15 Å, is between the two inner circles shown in the figure. Figure 5, C and D ▶, show a decrease in residue hydrophobic content with increasing distance within this region, which is similar to that observed for 1C3W and1C17. The prominent increase in hydrophobic content over the range of interior distances is, however, not observed. With increasing radial distance in the region of the multimer proximate to the protein–lipid interface, one observes increasing residue hydrophobic content.
Figure 4.
A view along the normal to the membrane surface, of the helices of the truncated multimer of the mechanosensitive ion channel, 1MSL.
Because the truncated transmembrane protein structure of the potassium ion channel, 1K4D, has an overall conical shape, a cone has been chosen as the profiling geometry. The pitch of the cone is chosen visually to register closely with the exterior distribution of residue centroid locations. As had been mentioned, the nested conical contours will correlate with lipid exposure for residues that are near the protein–lipid boundary. The protein has fourfold symmetry about the normal to the membrane surface, and the cone is created with varying spherical cross-sections along the conical axis. Figure 6B ▶ is a view of the distribution of centroids along a direction tilted by 80° from the normal to the membrane surface. The circles of varying radii delineate the cone just large enough to enclose all of the residue centroids. Figure 6A ▶ is a view along the normal to the membrane surface. The set of circular cross-sections shown differs from previous sets shown because cross-sections for only one profiling conical geometry have been displayed. The different circles delineate the different conical cross-sections of the cone that just enclose all of the centroids. Figure 6, C and D ▶, show the accumulated hydrophobicity H(d) as a function of the radius d. d is the radius of the smallest circular cross-section of each of the cones of the nested set of conical structures. The significant drop in hydrophobic content between 10 and 11 Å is caused by the collection of four arginine residues. Both residue hydrophobicity scales yield an inverted profile with respect to that found for the 30 globular soluble proteins. This, again, indicates that residues nearer to the protein–lipid interface have increased hydrophobic character with respect to the interior residues.
As the profiling geometry increases in extent over the structures lacking symmetry, it sweeps out spatial regions within nested ellipsoids that bear little or no structural resemblance to each other. Consequently, a detailed description of the correspondence between profile features and structural features would be extensive and will not be provided. Profiles of these structures, Figures 7–13 ▶ ▶ ▶ ▶ ▶ ▶ ▶, are mainly inverted with respect to that found for the soluble proteins. There are, however, certain features that require examination. Attention is focused on the three structures showing little change or a decrease in hydrophobic content at the farthest distances from the interior. These are the structures 1K6, 1BE3, and 1JB0 (Figs. 11–13 ▶ ▶ ▶). These particular profile features are not representative of residue accumulation along the major fraction of the periphery of the protein–lipid interface.
The truncated helical bundle 1KF6 in the range of 19 Å to complete residue collection at 23 Å (Fig. 11A ▶) collects only a few residues at two different spatial locations. These residues have, on average, a hydrophobic content comparable to the average hydrophobicity of the entire multimer. The residues collected in the range of values from 15 to 19 Å are greater in number and span the major fraction of the protein–lipid interface. Over this range of distances the hydrophobic residue content, on average, increases as the interface is approached.
The profiles of the 1BE3 multimer, the solid lines in Figure 12, C and D ▶, show a decrease in hydrophobic content over a range of distances, 26 Å to complete residue collection at 32 Å. This behavior is a consequence of the residues of the helical D chain having an average value of hydrophobicity that is less than that of the entire multimer. Profiling the structure with deletion of the D chain yields the dashed profiles shown in the figures. The major fraction of the periphery of the multimer then shows increasing hydrophobic content as the interface with the lipid is approached.
The profiles (Fig. 13C,D ▶) of the multimer 1JB0, the most structurally complex structure examined, with multiple chains, show a narrow range of decreasing hydrophobic content with distance close to the lipid interface. This range of distances is illustrated in Figure 13A ▶. It is the narrow range of distances between the two closest ellipses. Averages over this range of distances arise from accumulation over several different local regions near the interface. The decrease in hydrophobic content at a distance of 56 Å is caused by the collection of one arginine and one lysine residue in different local regions. Both residues are not only near the protein–lipid interface within the bilayer but in the vicinity of the bilayer surface as well. From 56 Å to final residue collection at 62 Å, there is an increase in hydrophobic content. Differences in the profiles in this narrow spatial region dependent on windowing size and the choice of the hydrophobicity scale should also be noted.
The profiles of 1BE3 and 1JB0 emphasize that the distribution of residue hydrophobicity exhibits variations not only in an inside–outside or radial direction but in an angular direction as well, near to and along the periphery of the protein–lipid interface. Such variations can be investigated by profiling along the protein–lipid periphery. As has been seen, local regions in the vicinity of the protein–lipid interface may be of lesser hydrophobic content than the multimeric average. It is of interest that so few such variations have been seen in the 11 structures examined. Finally, when profiling a complex structure with multiple helical chains, the baseline for comparison is important, for example, which of the chains are to be chosen to provide the reference value of hydrophobicity against which local variations are to be compared.
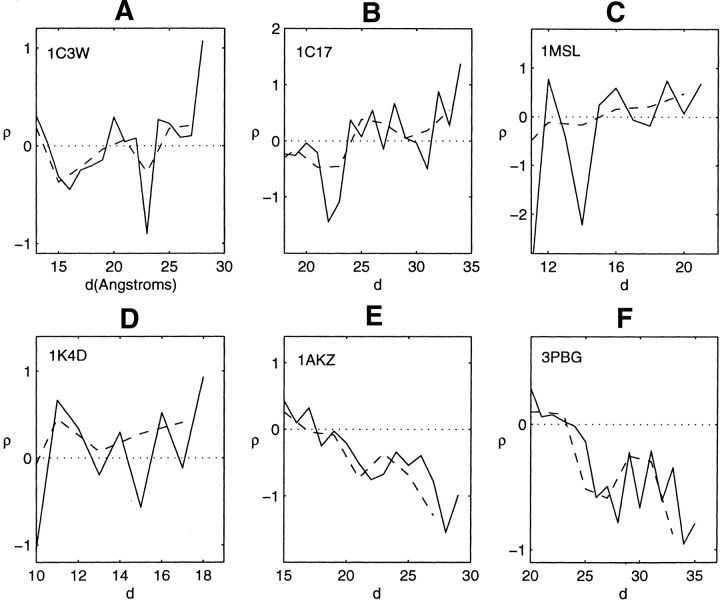
A statistical advantage of collecting the values of residue hydrophobicity within a profiling surface that increases in size involves a reduction in the fluctuations about the mean, compared with collecting the values of residue hydrophobicity within each shell bounded by adjacent nested profiling surfaces. The total residue hydrophobicity within each shell divided by the numbers of residues in the shell, calculated with increasing distance from the axial center of the profiling geometry, provides the residue hydrophobicity density ρ(d) as a function of distance d from the center of the structure. Despite the fluctuations in value, this density is of interest. It is shown in Figure 14 ▶ for the four symmetric α-helical transmembrane bundles, over the larger half of the radial distances d from the cylindrical axis; the range of distances nearer the protein–lipid interface. One notes that on average, despite the fluctuations in value, the density of the four transmembrane structures exhibits increasing hydrophobic content as the protein–lipid interface is approached. The two lower right entries in the figure, for the soluble proteins 1AKZ and 3PBG, have been included to highlight the different behavior of these proteins. For these proteins, the hydrophobic content decreases as the protein–lipid interface is approached. These results obtained for 1AKZ and 3PBG are typical of the 30 soluble proteins previously profiled. As noted from the figure, however, the spatial decrease in the hydrophobic densities of the soluble proteins 1AKZ and 3PBG is more pronounced than the increase observed for the transmembrane structures. Comparing peak height amplitudes of the accumulated profiles of the soluble proteins with the amplitudes of the peak valleys of the α-helical structures generally highlights this more modest segregation of the residue hydrophobic content of the transmembrane bundles.
Figure 14.
Hydrophobicity density ρ(d) as a function of distance d from the protein interior of the four transmembrane bundles of, 1C3W, 1C17, 1MSL, and 1K4d, and of the soluble proteins 1AKZ and 3PBG. The solid lines are the results of calculations for shells of 1 Å thickness. The dashed lines are for shells of 2 Å thickness.
The terminology inside-out had been used previously in connection with a comparison between the spatial hydrophobicity distributions of transmembrane and soluble globular proteins. For the Eisenberg hydrophobicity scale (Eisenberg et al. 1982), which is a consensus set of values that approximates the free energy of transfer of the side chain of the amino acid from water to an apolar environment, the average value per residue of 30 soluble globular proteins (Silverman 2001) is −0.13 kcal/mole. The average value per residue of the four symmetric transmembrane bundles is 0.27 kcal/mole. The difference between these two values is comparable to the difference between the values of threonine and alanine on this scale. In the present paper, differences about the mean value of hydrophobicity have been calculated for each of the structures. This requires a redistribution of the individual values of residue hydrophobicity for each structure, a result achieved by scaling the values of residue hydrophobicity such that the net hydrophobicity of each structure vanished. Table 1 lists the shifted and normalized values of amino acid hydrophobicity that had provided the values of the densities, ρ(d). One notes a significant difference between the values for the soluble and transmembrane structures, as well as a range of values of opposite sign, within the blank spaces. These are the values that yield what might be called an inside-out distribution of the hydrophobic density of the four symmetric transmembrane bundles relative to the soluble proteins 1AKZ and 3PBG. They are a measure of differences about averages, with averages that are very different. The distributions are not inside-out in the traditional sense in which each residue is considered to have a fixed polar or apolar identity.
Table 1.
Rescaled Eisenberg amino acid hydrophobicity scale
| Amino acid | 1C3W | 1C17 | 1MSL | 1K4D | 1AKZ | 3PBG |
| Arg | −3.98 | −7.85 | −4.89 | −4.08 | −2.61 | −2.65 |
| Lys | −2.49 | −5.40 | −3.31 | −2.70 | −1.55 | −1.57 |
| Asp | −1.63 | −4.00 | −2.41 | −1.90 | −0.94 | −0.95 |
| Glu | −1.56 | −3.88 | −2.33 | −1.84 | −0.89 | −0.90 |
| Asp | −1.45 | −3.70 | −2.21 | −1.74 | −0.81 | −0.82 |
| Glu | −1.40 | −3.63 | −2.17 | −1.69 | −0.78 | −0.79 |
| His | −0.90 | −2.81 | −1.64 | −1.23 | −0.42 | −0.43 |
| Ser | −0.59 | −2.29 | −1.31 | −0.94 | −0.20 | −0.20 |
| Thr | −0.41 | −2.00 | −1.12 | −0.77 | −0.07 | −0.07 |
| Pro | −0.16 | −1.59 | −0.85 | −0.54 | 0.11 | 0.11 |
| Tyr | 0.05 | −1.25 | −0.64 | −0.36 | 0.26 | 0.26 |
| Cys | 0.09 | −1.18 | −0.59 | −0.31 | 0.29 | 0.29 |
| Gly | 0.36 | −0.74 | −0.30 | −0.06 | 0.48 | 0.49 |
| Ala | 0.57 | −0.40 | −0.09 | 0.12 | 0.63 | 0.64 |
| Met | 0.59 | −0.37 | −0.07 | 0.15 | 0.64 | 0.65 |
| Trp | 0.84 | 0.04 | 0.20 | 0.38 | 0.82 | 0.83 |
| Leu | 1.20 | 0.63 | 0.58 | 0.71 | 1.08 | 1.09 |
| Val | 1.22 | 0.67 | 0.60 | 0.73 | 1.09 | 1.11 |
| Phe | 1.38 | 0.93 | 0.77 | 0.88 | 1.21 | 1.22 |
| Ile | 1.65 | 1.37 | 1.06 | 1.13 | 1.40 | 1.42 |
Discussion
The present paper has examined the spatial distribution of transmembrane residue hydrophobicity from a perspective that is different from the point of view of previous calculations. The spatial profile is obtained directly, without reference to solvent–lipid exposure. This provides a view of the variation of residue hydrophobicity from the interior to the exterior of the α-helical bundles buried within the surrounding lipid. Scaling the residue hydrophobicity for each multimer enables variations about the mean value of hydrophobicity over the spatial extent of the structure to be simply identified. This also enables a comparison of the profiles over the spatial extent of different structures with average values of hydrophobicity that are different. Such a procedure had previously identified comparable length scale features of the profiles of 30 soluble globular proteins of arbitrary structure and size.
The profiles of the α-helical buried bundles, although exhibiting certain differences, exhibit a comparable length scale feature as well. This is the onset of the decrease in hydrophobic residue content at distances from the interior that are at roughly half the spatial extent of the bundle. Consequently, the profiles are mainly inverted with respect to the profiles of the soluble globular proteins. The region proximate to the protein–lipid interface, that had generated previous contention (Stevens and Arkin 1999,Rees and Eisenberg 2000) Stevens and Arkin 2000 ), generally exhibits the increase in average residue hydrophobic content identified by previous calculations (Rees et al. 1989; Wallin et al. 1997). The profiling of the structures lacking symmetry show that such increase need not occur in every local region proximate to the protein–lipid periphery.
Acknowledgments
I thank Ajay Royyuru and Ruhong Zhou for useful discussions. The publication costs of this article were defrayed in part by payment of page charges. This article must therefore be hereby marked “advertisement” in accordance with 18 USC section 1734 solely to indicate this fact.
Article and publication are at http://www.proteinscience.org/cgi/doi/10.1110/ps.0214903.
References
- Berman, H.M., Westbrook, J., Feng, Z., Gilliland, G., Bhat, T.N., Weissig, H., Shindyalov, I.N., and Bourne, P.E. 2000. The Protein Data Bank. Nucleic Acids Res. 28 236–242. [DOI] [PMC free article] [PubMed] [Google Scholar]
- Bonneau, R., Strauss, C.E.M., and Baker, D. 2001. Improving the performance of Rosetta using multiple sequence alignment information and global measures of hydrophobic core formation. Proteins: Struct. Funct. Genet. 43 1–11. [DOI] [PubMed] [Google Scholar]
- Chang, G., Spencer, R.H., Lee, A.T., Barclay, M.T., and Rees, D.C. 1998. Structure of the MscL homolog from Mycobacterium tuberculosis: A gated mechanosensitive ion channel. Science 2822220–2226. [DOI] [PubMed] [Google Scholar]
- Eisenberg, D., Weiss, R.M., Terwilliger, T.C., and Wilcox, W. 1982. Hydrophobic moments of protein structure. Faraday Symp. Chem. Soc. 17 109–120. [Google Scholar]
- Engelman, D.M. and Zaccai, G. 1980. Bacteriorhodopsin is an inside-out protein. Proc. Natl. Acad. Sci. 77 5894–5898. [DOI] [PMC free article] [PubMed] [Google Scholar]
- Engelman, D.M., Steitz, T.A., and Goldman, A. 1986. Identifying nonpolar transbilayer helices in amino acid sequences of membrane proteins. Ann. Rev. Biophys. Hem. 15 321–353. [DOI] [PubMed] [Google Scholar]
- Ermler, U., Fritzsch, G., Buchanan, S.K., and Michel, H. 1994. Structure of the photosynthetic reaction centre from Rhodobacter sphaeroides at 2.65 Å resolution: Cofactors and protein–cofactor interactions. Structure 2 925–936. [DOI] [PubMed] [Google Scholar]
- Holm, H. and Sander, C. 1992. Evaluation of protein models by atomic solvation preference. J. Mol. Biol. 225 93–105. [DOI] [PubMed] [Google Scholar]
- Huang, E.S., Subbiah, S., and Levitt, M. 1995. Recognizing native folds by the arrangement of hydrophobic and polar residues. J. Mol. Biol. 252 709–720. [DOI] [PubMed] [Google Scholar]
- Iverson, T.M., Luna-Chavez, C., Croal, L.R., Cecchini, G., and Rees, D.C. 2002. Crystallographic studies of the Escherichia coli quinol-fumarate reductase with inhibitors bound to the quinol-binding site. J. Biol. Chem. 277 16124–16130. [DOI] [PubMed] [Google Scholar]
- Iwata, S., Lee, J.W., Okada, K., Lee, J.K., Iwata, M., Rasmussen, B., Link, T.A., Ramaswamy, S., and Jap, B.K. 1998. Complete structure of the 11-subunit bovine mitochondrial cytochrome bc1 complex. Science 281 64–71. [DOI] [PubMed] [Google Scholar]
- Jordan, P., Fromme, P., Witt, H.T., Klukas, O., Saenger, W., and Krauss, N. 2001. Three-dimensional structure of cyanobacterial Photosystem I at 2.5 Å resolution. Nature 411 909–917. [DOI] [PubMed] [Google Scholar]
- Kauzmann, W. 1959. Some factors in the interpretation of protein denaturation. Adv. Protein Chem. 14 1–63. [DOI] [PubMed] [Google Scholar]
- Kidera, A., Konishi, Y., Ooi, T., and Scheraga, H.A. 1985. Relation between sequence similarity and structural similarity in proteins. Role of important properties of amino acids. J. Protein Chem. 5 265–297. [Google Scholar]
- Kytte, J. and Doolittle, R.F. 1982. A simple method for displaying the hydropathic character of a protein. J. Mol. Biol. 157 105–132. [DOI] [PubMed] [Google Scholar]
- Lee, J. and Shin, S.M. 2001. Understanding β-hairpin formation by molecular dynamics simulations of unfolding. Biophys. J. 81 2507–2516. [DOI] [PMC free article] [PubMed] [Google Scholar]
- Locher, K.P., Lee, A.T., and Rees, D.C. 2002. The E. coli BtuCD structure: A framework for ABC transporter architecture and mechanism. Science 296 1091–1098. [DOI] [PubMed] [Google Scholar]
- Luecke, H., Schobert, B., Richter, H.T., Cartailler, J.P., and Lanyi, J.K. 1999. Structure of bacteriorhodopsin at 1.55 Å resolution. J. Mol. Biol. 291 899–911. [DOI] [PubMed] [Google Scholar]
- Meirovitch, H. and Scheraga, H.A. 1981. Empirical studies of hydrophobicity. 3. Radial distribution of clusters of hydrophobic and hydrophilic amino acids. Macromolecules 14 340–345. [Google Scholar]
- Murzin, A.G., Brenner, S.E., Hubbard, T., and Chothia, C. 1995. SCOP: A structural classification of proteins database for the investigation of sequences and structures. J. Mol. Biol. 247 536–540. (1J4N, 1L7V, and 1KF6 have not been listed). [DOI] [PubMed] [Google Scholar]
- Novotny, J., Rashin, A.A., and Bruccoleri, R.E. 1988. Criteria that discriminate between native proteins and incorrectly folded models. Proteins: Struct. Funct. Genet. 4 19–30. [DOI] [PubMed] [Google Scholar]
- Perutz, M.F., Kendrew, J.C., and Watson, H.C. 1965. Structure and function of haemoglobin. J. Mol. Biol. 13 669–678. [Google Scholar]
- Rastogi, V.K. and Girvin, M.E. 1999. Structural changes linked to proton translocation by subunit C of the ATP synthase. Nature 402 263–268. [DOI] [PubMed] [Google Scholar]
- Rees, D.C. and Eisenberg, D. 2000. Turning a reference inside-out: Commentary on an article by Stevens and Arkin entitled: “Are membrane proteins ’inside-out’ proteins?” Proteins: Struct. Funct. Genet. 38 121–122. [PubMed] [Google Scholar]
- Rees, D.C., DeAntonio, L., and Eisenberg, D. 1989. Hydrophobic organization of membrane proteins. Science 245 510–513. [DOI] [PubMed] [Google Scholar]
- Rose, G. 1978. Prediction of chain turns in globular proteins on a hydrophobic basis. Nature 272 586–590. [DOI] [PubMed] [Google Scholar]
- Rose, G.D. and Roy, S. 1980. Hydrophobic basis of packing in globular proteins. Proc. Natl. Acad. Sci. 77 4643–4647. [DOI] [PMC free article] [PubMed] [Google Scholar]
- Silverman, B.D. 2001. Hydrophobic moments of protein structures: Spatially profiling the distribution. Proc. Nat. Acad. Sci. 98 4996–5001. [DOI] [PMC free article] [PubMed] [Google Scholar]
- Soulimane, T., Buse, J., Bourenkov, G.P., Bartunik, H.D., Huber, R., and Than, M.E. 2000. Structure and mechanism of the aberrant Ba3-cytochrome C oxidase from Thermus thermophilus. EMBO J. 191766–1776. [DOI] [PMC free article] [PubMed] [Google Scholar]
- Stevens, T.J. and Arkin, I.T. 1999. Are membrane proteins “inside-out” proteins? Proteins: Struct. Funct. Genet. 36 135–143. [DOI] [PubMed] [Google Scholar]
- ———. 2000. Turning an opinion inside-out: Rees and Eisenberg’s commentary (2000. Proteins 38: 121–122) on “Are membrane proteins ’inside-out’ proteins?” (1999. Proteins 36: 135–143). Proteins: Struct. Funct. and Genet. 40 463–464. [DOI] [PubMed] [Google Scholar]
- Sui, H., Han, B.G., Lee, J.K., Walian, P., and Jap, B.K. 2001. Structural basis of water-specific transport through the AQP1 water channel. Nature 414 872–878. [DOI] [PubMed] [Google Scholar]
- Wallin, E., Tsukihara, T., Yoshikawa, S., Von Heijne, G., and Elofsson, A. 1997. Architecture of helix membrane proteins: An analysis of cytochrome c oxidase from bovine mitochondria. Protein Sci. 6 808–815. [DOI] [PMC free article] [PubMed] [Google Scholar]
- White, S.H. and Wimley, W.C. 1999. Membrane protein folding and stability: Physical principles. Annu. Rev. Biophys. Biomolec. Struct. 28 319–365. [DOI] [PubMed] [Google Scholar]
- Zagrovic, B., Sorin, E.J., and Pande, V. 2001. β-Hairpin folding simulations in atomistic detail using an implicit solvent model. J. Mol. Biol. 313 151–169. [DOI] [PubMed] [Google Scholar]
- Zhou, R., Berne, B.J., and Germain, R. 2001. The free energy landscape for β hairpin folding in explicit water. Proc. Natl. Acad. Sci. 98 14931–14936. [DOI] [PMC free article] [PubMed] [Google Scholar]
- Zhou, Y., Morais-Cabral, J.H., Kaufman, A., and MacKinnon, R. 2001. Chemistry of ion coordination and hydration revealed by a K+ channel–FAB complex at 2.0 Å resolution. Nature 41443–48. [DOI] [PubMed] [Google Scholar]


