Abstract
The recessive mutation at the pale ear (ep) locus on mouse chromosome 19 was found to be the homologue of human Hermansky–Pudlak syndrome (HPS). A positional cloning strategy using yeast artificial chromosomes spanning the HPS locus was used to identify the HPS gene and its murine counterpart. These genes and their predicted proteins are highly conserved at the nucleotide and amino acid levels. Sequence analysis of the mutant ep gene revealed the insertion of an intracisternal A particle element in a protein-coding 3′ exon. Here we demonstrate that mice with the ep mutation exhibit abnormalities similar to human HPS patients in melanosomes and platelet-dense granules. These results establish an animal model of HPS and will facilitate biochemical and molecular analyses of the functions of this protein in the membranes of specialized intracellular organelles.
Hermansky–Pudlak syndrome (HPS) is an autosomal recessive genetic disorder characterized by a triad of phenotypic manifestations: oculocutaneous albinism, storage pool-deficient platelets, and ceroid storage disease (1). HPS-associated oculocutaneous albinism is similar to that seen in the more common oculocutaneous albinism-2, or P gene-related albinism (2, 3). HPS individuals lack platelet-dense bodies (or their contents), which leads to prolonged bleeding time and defective platelet aggregation (4, 5). The ceroid storage disease is associated with granulomatous colitis and restrictive lung disease. The autofluorescent material (ceroid) stored in HPS is histochemically similar to that stored within the lysosomes of patients with neuronal ceroid-lipofuscinosis (6, 7). Thus, HPS is a disorder that affects melanosomes and platelet-dense bodies and that is associated with ceroid storage disease.
The frequency of HPS among Puerto Ricans is ≈1/1800 (it is thought to be traced to a single founder), predicting that ≈1/21 are carriers (8, 9). The Puerto Rican HPS locus was mapped to chromosome 10q2 by linkage disequilibrium mapping (8, 9). A gene associated with HPS recently has been cloned and encodes a novel protein (10). However, because several different mouse loci display HPS-like phenotypes, it is believed that HPS may prove to be a genetically complex disease.
Fifteen mouse mutants display HPS-like phenotypes (11), including ep (pale ear) (12), ru (ruby eye) (13), pa (pallid) (14), le (light ear) (15), and sut (subtle gray) (16). However, only two, ep and ru, map to the distal portion of chromosome 19 in a region of homology with human chromosome 10q2 (8, 9, 17). Of these two, ep is most similar phenotypically, sharing with HPS the triad of hypopigmentation, storage pool-deficient platelets, and ceroid storage disease (7). Indeed, the ep mouse has been suggested as a model for HPS on the basis of its phenotype (18). Although ceroid storage disease has not been documented for ru, this locus also was considered a potential candidate because of its homologous map position (8–10).
The ep mutation arose spontaneously in the C3HeB/FeJ inbred strain (12). The ears and tail of adult ep/ep mice are pale in color. However, the pigmentation of the coat and eyes darkens with age, the adult coat being almost normal. Homozygous ep mice have a 2-fold increase in the kidney lysosomal enzymes β-glucuronidase, β-galactosidase, and α-mannosidase accompanied by lowered lysosomal enzyme excretion in the urine (14). Serum levels of glucuronidase and galactosidase are elevated compared with wild-type controls (19). The gene encoded by the ep locus has been proposed to function in the secretion of the enzymes from the lysosomes, the mutant ep allele inhibiting secretion from macrophages and kidney cells (20, 21) and elevating secretion from platelets (11). Bone marrow transplants from normal donors can restore normal platelet function in ep/ep mice (22).
In parallel efforts, we and Oh et al. (10) have identified the HPS gene. In this report, we show that the mouse homologue of HPS is ep and present the sequence of the normal mouse gene and the mutant ep allele. Additionally, a more detailed phenotypic characterization of the ep mutation is presented in light of its definitive status as the mouse model for HPS.
MATERIALS AND METHODS
Genomic and cDNA Cloning.
Human yeast artificial chromosomes (YACs) CEPH 811d8 (1.080 Mb) and 943f9 (830 kb) were obtained from Research Genetics (Huntsville, AL), and libraries containing each YAC were constructed. In brief, total yeast DNA was partially digested with EcoRI and separated by agarose gel (0.8%) electrophoresis. DNA fragments of 8–12 kb were isolated by electroelution and cloned in EcoRI-digested, phosphatase-treated Lambda ZAP Express (Stratagene). The resulting libraries were plated at low density and screened using radiolabeled total human DNA. Single plaques hybridizing to human DNA were purified, and cloned fragments were isolated by in vivo excision according to the manufacturer’s protocol. DNA from 96 individual clones was prepared, digested with restriction enzymes (EcoRI and HindIII and both together), and subjected to Southern analysis using total human DNA as a probe. Individual, nonhybridizing fragments (i.e., human unique sequence DNA) were then used as probes on Southern blots of human and mouse genomic DNA. A 2.3-kb EcoRI–HindIII fragment, derived from YAC subclone 811d8-Z7, hybridized strongly to mouse DNA and was further dissected. Cross-species hybridizing sequences were localized to a 900-bp EcoRV–HindIII subfragment (7RV-H), and polymorphisms detected by this DNA probe demonstrated no recombination with ep (see below). A single human cDNA clone was isolated by screening 2 × 10⁵ phages from a human erythroleukemia cell cDNA library in λ-gt11 (gift of J. Ware, Scripps Research Institute; ref. 23) using the 7RV-H probe and was plaque-purified. From this, a 1.5-kb fragment was subcloned into pUC 18 and sequenced (accession no. U96721; S.C.W., J. P. Fryer, J.M.G., W. S. Oetting, R.T.S., M.H.B., and R.A.K., unpublished work). Five mouse cDNA clones (MEP-1–5) were obtained by screening a 16-day mouse embryo cDNA library in Lambda ZAP Express with the 1.5-kb human cDNA insert.
To investigate the nature of the ep mutation, a mutant-specific, ≈9.0-kb EcoRI fragment of ep DNA was cloned from a subgenomic library of size-selected EcoRI fragments (Lambda ZAP Express) using a 1.2-kb ScaI fragment of MEP-2 cDNA as a probe and was partially sequenced. Wild-type genomic sequences (C57BL/6J and C3H/HeJ) from the region altered in ep were amplified using cDNA-derived primers MHB284 (5′-TGTCCACTGCTCTAAACCCTTGG-3′) and MHB287 (5′-CAGCCAGAGGGAGTACCTTCTGAT-3′). These primers produced products of 2.3 kb (for both wild-type strains) that were subcloned in pCR 2.1 using the TA Cloning Kit (Invitrogen) and were sequenced. Using these same primers, the corresponding ep genomic PCR fragment (≈10.0 kb) was amplified using Elongase (GIBCO/BRL), subcloned in pCR 2.1, and partially sequenced. 3′ rapid amplification of cDNA ends (RACE)–PCR was performed on mouse liver cDNA as described (24). In brief, 1 μg of liver poly(A)+ RNA (wild-type or ep/ep) was reverse transcribed with Superscript (GIBCO/BRL) using a hybrid oligo(dT) primer (QT) that consists of 35 bp of unique oligonucleotide sequence (QO-QI) followed by 17 nt of (dT). A first round of amplification was performed using QO and the gene-specific primer MHB312 (5′-TCTCAGCCCCAACGAAAAG3′). A second set of amplification cycles was carried out using nested primers, QI and MHB313 (5′-CCTACTTCCTGTGGTTCGAG3′). cDNA amplification reactions were performed with the Expand Long Template PCR System (Boehringer Mannheim). 3′ RACE products from wild type and ep were gel-purified, subcloned into pCR 2.1, and sequenced. Southern and Northern blotting were as described (25).
Interspecific Backcross and Mapping.
B6C3Fe-bm ep ru/bm ep ru laboratory stock females were mated to wild-derived and inbred PWK (Mus musculus musculus) males. Heterozygous +++/bm ep ru F1 females were crossed with homozygous bm ep ru/bm ep ru males to produce 1197 progeny. Restriction fragment length polymorphisms were identified by Southern blotting of parental and backcross DNA. The fine structural mapping of the initial 457 progeny at the ru and ep loci have been detailed (17) and included loci encoding terminal deoxynucleotidyl transferase (Tdt) and cytochrome P450 17 (Cyp17). These expressed genes were mapped in the expanded 1197 animal backcross in addition to the following genes: fibroblast growth factor 8 (Fgf8; ref. 26), which revealed informative fragment sizes of 9.2 kb (PWK) and 2.4 kb (B6C3Fe-bm ep ru) after XhoI digestion; the murine paired-box gene (Pax2; ref. 27), which revealed informative fragments of 21 kb (PWK) and 15 kb (B6C3Fe-bm ep ru) after SstI digestion; cytochrome P450–2C (Cyp2c; ref. 28), which revealed informative fragments of 14 kb (PWK) and 16 kb (B6C3Fe-bm ep ru) after EcoRI digestion. Stearoyl–CoA desaturase (Scd1) was mapped by PCR techniques using primers for D19Nds1 (29). Microsatellite markers obtained from Research Genetics were mapped by PCR procedures (30). D19Umi1 was assayed by PCR (17).
Electron Microscopy of Eyes and Cultured Melanocytes.
Primary melanocytes from C57BL/6J +/+ and C57BL/6J ep/ep mice were isolated and cultured by methods reported (31, 32). In brief, melanocytes were explanted from the skin after removal of the epidermis and cultured in Ham’s F-10 medium containing 10% fetal calf serum, 100 units/ml penicillin, 100 μg/ml streptomycin, 2 mM glutamine, 0.1 mM dibutyryl cAMP, 100 nM phorbol 12-myristate 13-acetate, and 40 μg/ml bovine pituitary extract protein (GIBCO/BRL). Confluent flasks of melanocytes and whole eye tissues were processed for electron microscopy. Tissues were fixed for at least 18 hr at 4°C in 3% glutaraldehyde and 0.1 M phosphate buffer (pH 7.2). The fixed tissue was dissected to 1 × 1 × 3-mm pieces. Postfixation was in 1% osmium tetroxide and 0.1 M phosphate buffer for 1 hr followed by en bloc staining for 30 min in 1% uranyl acetate and 50% ethanol. The tissues were then dehydrated using serial alcohol and acetone incubations and embedded in Spurr resin. A Sorvall MT-2B ultramicrotome was used to section the tissues to 80 nm (silver–gold). Sections were stained with uranyl acetate and lead citrate. Grids were viewed on a Philips 400 electron microscope at an accelerating voltage of 80 kV.
Platelet Aggregation and ATP Secretion.
Platelet aggregation with collagen was determined in a ChronoLog whole blood aggregometer (model 500; Havertown, PA) as described (33). ATP secretion was determined simultaneously by coupling with luciferin–luciferase and measuring light emitted in comparison with that produced by known concentrations of ATP.
RESULTS
Identification of the HPS and ep Genes.
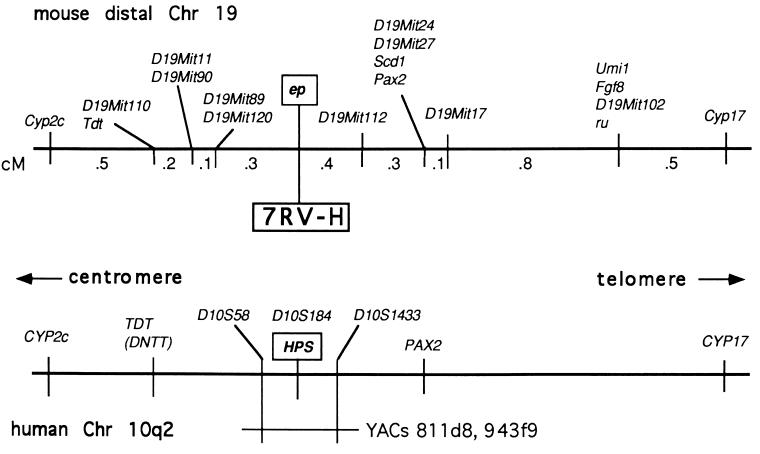
Using homozygosity mapping, we (8) and others (9) placed HPS at chromosome 10q2. We further refined the position of HPS by pedigree analysis, placing HPS between markers D10S58 and D10S1433. No recombination between HPS and marker D10S184 was detected. On the basis of these results, several YAC clones were selected that contained all three markers and, presumably, the HPS gene. Two of these YACs, 811d8 and 943f9, were used to make λ libraries. Several hundred clones containing human DNA were identified by hybridization to total human DNA. DNA from 96 individual clones was prepared, digested with restriction enzymes, and subjected to Southern analysis using total human DNA as a probe. Individual, nonhybridizing fragments (i.e., unique sequence DNA) were then used as probes on Southern blots of human and mouse genomic DNA. The 7RV-H fragment produced the most robust cross-hybridizing signal of the first 20 probes screened and was mapped using a 1200-mouse backcross, segregating for ep and ru. No recombination was found between 7RV-H and ep in our backcross. Because of the striking homology between the human HPS and the mouse ep regions (Fig. 1), we reasoned that a sequence conserved between human and mouse that was nonrecombinant with ep in this large backcross would be a likely candidate for an exon-bearing fragment of the HPS/ep gene.
Figure 1.
Homology between mouse distal chromosome 19 and human chromosome 10q2. The upper portion shows the location of the ep locus relative to other markers in our backcross (see Materials and Methods). No recombination was detected between ep and 7RV-H, a human unique sequence fragment found in YAC 811d8 that spanned the HPS region on Chromosome 10q2 (shown at Bottom).
The 7RV-H fragment was used to screen a cDNA library from a human erythroleukemia cell line (23), and one putative HPS clone was isolated and sequenced (accession no. U96721; S.C.W., J. P. Fryer, J.M.G., W. S. Oetting, R.T.S., M.H.B., and R.A.K., unpublished work). Coding sequences from this clone were used to isolate mouse cDNAs from a 16-day mouse embryo library. Five clones were obtained from this screen, and the entire sequence of one representative cDNA clone (MEP-1, accession no. U97149) was determined. While this analysis was in progress, Oh et al. (10) independently identified the same gene as the HPS gene (accession no. U65676). A comparison of the predicted amino acid sequences of the mouse and the human proteins is presented in Fig. 2. Our analysis of the mouse protein predicts the presence of one hydrophobic domain capable of spanning the lipid bilayer (amino acids 374–392), but we did not detect the presence of a leader or signal sequence in the N-terminal region of the protein using von Heijne’s method of signal sequence recognition (34). We did note the existence of several motifs that may play a role in the function of the protein (Fig. 2; see Discussion).
Figure 2.
The amino acid sequences encoded by the mouse ep (MEP-1, accession no. U97149, top row) and human HPS (10, accession no. U65676, bottom row) genes. Vertical bars between the sequences indicate identity. Similarity is indicated by dots between the sequences, with two dots indicating a higher degree of amino acid similarity and less evolutionary distance than one dot. Dashes indicate nonconservation or gaps. Key features of the mouse sequence are indicated as follows: single underline, helix–loop–helix motif; overline, polyglutamic acid motif; double underline, transmembrane domain; asterisk, point of IAP element insertion; and bold, lysosome/endosome trafficking motif [(D or E)-X-X-X-X-L-L; ref. 41]. Amino acid homologies depicted represent analysis by the gap program of the GCG sequence analysis software (Wisconsin Package). Protein subsequence analysis and hydropathy plots were performed with the MacVector sequence analysis program (International Biotechnologies). Transmembrane domain assignments were determined with a window size of 20 and the Goldman, Engelman, and Steitz hydrophilicity scales (40).
The ep Mutation and Expression of the ep Gene.
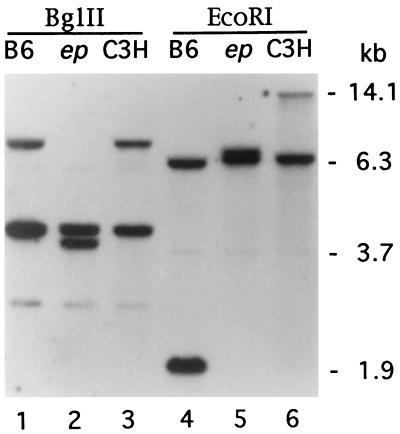
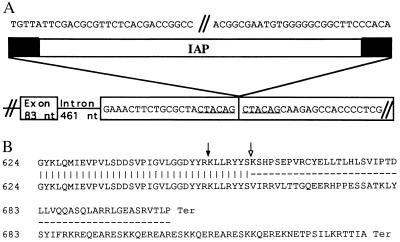
Southern blot analysis with a 1.2-kb ScaI fragment from the mouse cDNA MEP-2 revealed multiple polymorphisms between C57BL/6J and the congenic strain C57BL/6J ep/ep. The polymorphisms detected were not present in the C3H/HeJ strain, a close relation to the C3HeB/FeJ strain of origin of the ep mutation (12), suggesting that the ep mutation was associated with a large genomic alteration (Fig. 3). A mutant-specific genomic EcoRI fragment (≈9.0 kb) was isolated from a size-selected ep genomic library. Sequences from this fragment (accession nos. AF003868 and AF004353) matched those of intracisternal A particle (IAP) elements (35), whereas a PCR-derived wild-type sequence of this region did not (accession no. AF004353). IAP elements are retroviral-like elements present at ≈2000 copies per genome in the mouse and are known to be somewhat mobile in the mouse genome (35). Sequencing of the 3′ end of the gene in wild-type and ep genomic DNAs revealed that the mutant ep gene indeed has an insertion of an IAP element with a characteristic duplication of 6 bp of target DNA at the insertion site (Fig. 4A). From sequence analysis (not shown), we determined that the IAP element and the ep gene are in opposite transcriptional orientations.
Figure 3.
Southern blot analysis of genomic DNA from: C57BL/6J +/+ (B6); C57BL/6J ep/ep congenic (ep); and C3H/HeJ +/+ (C3H) digested with BglII and EcoRI. The blots were hybridized with a 1.2-kb ScaI fragment derived from the MEP-2 cDNA. Selected size markers at right indicate the position of lambda DNA fragments digested with BstEII. Note the presence of exon-bearing fragments of altered size in ep DNA (BglII: ≈4.0 kb; EcoRI: ≈9.0 kb) shown in lanes 2 and 5, respectively. The variation seen in the sizes of EcoRI-digested DNA between wild-type C57BL/6J and C3H/HeJ represents a restriction fragment length polymorphism. The position of marker fragments (in kilobases) is shown on the right.
Figure 4.
Consequences of the ep IAP insertion. (A) DNA sequence of the IAP chromosomal insertion point. Six base pairs of mouse genomic target DNA (underlined) are duplicated at the site of the IAP element insertion within a 3′ exon. The IAP element depiction has black boxes representing long terminal repeat sequences, portions of which are shown above. Sequence of the larger genomic region (not shown; accession nos. AF003868 and AF004352) indicate that the ep gene and the IAP element are in opposite transcriptional orientations. (B) Predicted C-terminal amino acid sequences from ep and wild type. The sequence of the C terminal region of the wild-type ep protein is shown on the top line; the dark arrow marks the junction between the two adjacent exons shown above in A, and the open arrow indicates the beginning of the ORF predicted by IAP sequences. The sequence of the mutant ep protein is shown on the bottom lines. The amino acid sequences shown were deduced from the nucleotide sequences of the 3′ RACE products from wild type (accession no. AF003866) and ep (accession no. AF003867).
Reverse transcriptase PCR (RT-PCR) experiments, using primers derived from the sequence of ep cDNA, were performed to assess the integrity of ep gene transcripts present in mutant tissues. No differences were observed in amplified products representing all but the most 3′ regions of the gene (data not shown). When primers representing sequences beyond nucleotide 2199 were used in RT-PCR, products were either missing or of aberrant size compared with those obtained using cDNA synthesized from wild-type mRNA (data not shown). 3′ RACE was performed to investigate the nature of the altered ep transcripts. Gene-specific primers MHB312 and MHB313, in combination with nested oligo(dT) primers, were used to amplify products from liver mRNA of 0.73 kb from wild type and 1.36 kb from ep/ep. The 0.73-kb wild-type product contains 273 nt of coding sequence and 457 nt of 3′ untranslated sequence (accession no. AF003866) whereas the 1.36-kb ep product only contains 133 nt of coding sequence followed by 1227 nt of IAP sequence (accession no. AF003867) (data not shown). The net result in the predicted ep protein is the loss of the last 46 wild-type amino acids and their replacement by 78 IAP-encoded amino acids (Fig. 4B).
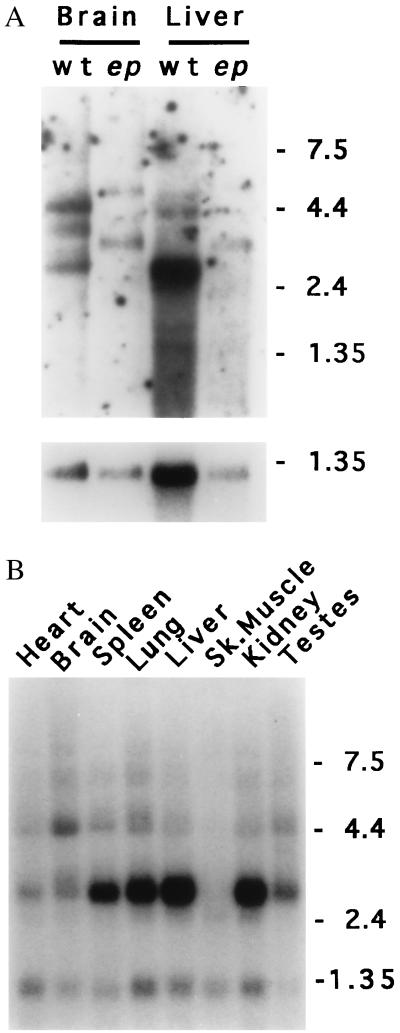
Northern analysis (Fig. 5A) demonstrated qualitative, but not quantitative, differences in mRNAs between wild-type and ep, consistent with the 3′ RACE results. Size differences on the order of 600 nt were observed between normal and mutant transcripts, suggesting that the alterations detected by 3′ RACE are present in the expressed transcripts. As has been demonstrated for the HPS gene (10), the predominant wild-type transcript is ≈3 kb (with some alternate transcripts readily detected, especially in brain; Fig. 5 A and B). The ep gene is expressed in all mouse tissues assayed, with the possible exception of skeletal muscle. Expression of the gene also was detected in cultured melanocytes, eyes, and bone marrow by RT-PCR (data not shown).
Figure 5.
Expression of the ep gene. (A) Northern blot of poly(A)+ RNAs (6 μg) isolated from brain or liver of homozygous wild-type (wt) or homozygous ep (ep) and hybridized with a 0.75-kb SmaI fragment of cDNA MEP-1 (Upper), or control probe from Gapd cDNA (Lower). Note the apparent size increase in all forms of the ep transcript compared with those observed in wild-type brain and liver RNA. (B) Mouse multiple tissue Northern blot (CLONTECH). Lanes: 1, 2 μg of poly(A)+ RNA from wild-type heart; 2, brain; 3, spleen; 4, lung; 5, liver; 6, skeletal muscle; 7, kidney; and 8, testes hybridized with a 0.75-kb SmaI fragment of cDNA MEP-1. Control hybridization to β-actin (not shown) confirmed the integrity and equal loading of all RNAs. For A and B, the sizes of marker RNAs are shown to the right in kilobases.
Phenotypic Characterization of the ep Mutation.
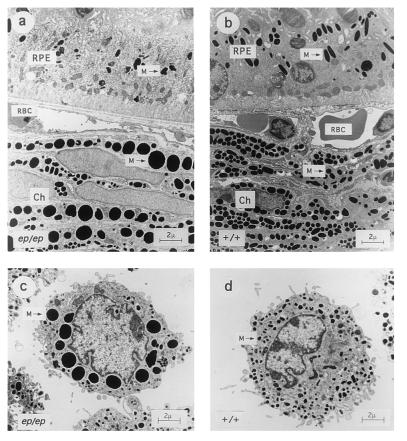
After determining that the mouse homologue of HPS was ep, we reexamined the phenotype of two cell types (melanocytes and platelets) known to be affected by HPS (36–38). Abnormally large melanosomes (macromelanosomes) were observed in choroidal melanocytes, and aberrantly shaped, incompletely melanized melanosomes were observed in the pigmented retinal epithelium (Fig. 6). Skin melanocytes in primary culture exhibited a phenotype similar to choroidal melanocytes of the appropriate genotype. In addition to the macromelanosomes, we noted the presence of intermediate structures that appeared to be fusions of smaller melanosomes. The 10 largest melanosomes from several random fields detected in ep and wild-type melanocytes were measured, and the volumes were determined by the formula for ellipsoid shapes: π/6 × length × width2. By this criterion, ep melanosomes were found to be 15.6 times larger in volume (1.018 ± 0.13 μm3) than those from C57BL/6J controls (0.065 ± 0.014 μm3).
Figure 6.
Ultrastructure of eye tissue and cultured skin melanocytes from C57BL/6J +/+ and C57BL/6J ep/ep congenic mice. (Upper) Sections through (a) ep/ep and (b) +/+ eyes showing the pigmented retinal epithelium (RPE). Ch, choroid; RBC, red blood cells; and M, melanosomes (Lower) Cultured skin melanocytes from (c) ep/ep and (d) +/+ mice. Large melanosomes (macromelanosomes) are seen in the choroid and cultured melanocytes from ep/ep mice, which may be derived from fusions of smaller vesicles. Retinal melanocytes from ep/ep exhibit smaller melanosomes than their wild-type controls and are more unevenly pigmented. All panels are shown at the same magnification. (Bar = 2 μm.)
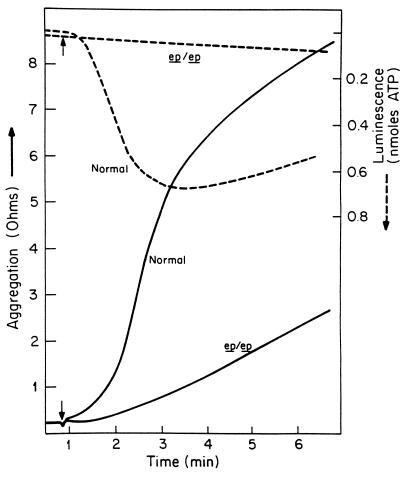
Platelets of ep mice and controls were examined as whole mount samples and by ultrastructure to detect dense bodies (data not shown). As has been reported for ep (11) and for HPS (39), very few dense bodies were observed. To further characterize the platelet dense body deficiency, we assayed platelet aggregation and ATP release. Aggregation of ep platelets was abnormal, as determined by whole blood aggregometry using collagen as an agonist. Likewise, the release of ATP from dense granules, monitored simultaneously using a firefly luminescence method, was greatly decreased. Even at low (1 μg/ml) collagen concentrations, normal ep/+ platelets had significant aggregation and ATP release (Fig. 7). These responses were accentuated at high (4 μg/ml) concentrations (data not shown). In contrast, mutant platelets had lowered rates of aggregation at both collagen concentrations. Most notably, ATP release from mutant platelets was minimal at both collagen concentrations. These aggregation and ATP release responses typify those of platelets from patients with platelet storage pool deficiency and HPS (4, 5). Moreover, these results are consistent with previous analyses of ep platelets that revealed normal platelet numbers but lowered platelet granule adenine nucleotide concentrations (18).
Figure 7.
Collagen-mediated aggregation of mutant pale ear (ep/ep) and normal (ep/+) platelets and release of ATP. Platelet aggregation was determined in whole blood by the impedance method in response to 1 μg/ml collagen. Release of ATP was determined simultaneously by luminescence methods. The small arrow indicates the time of addition of collagen.
DISCUSSION
We have identified the genes associated with human HPS and the mouse pale ear (ep) mutation. The mouse and human genes are both part of larger homologous genomic regions (distal mouse chromosome 19 and human chromosome 10q24q25; Fig. 1).
The mouse and human genes are highly conserved at both the nucleotide (83% overall homology for 2165 nt) and amino acid (81% identity, 89% similarity; Fig. 2) levels. Oh et al. (10) noted the novelty of the HPS protein, with the only predicted motifs being two transmembrane domains. Our sequence analysis of the mouse gene (using Goldman, Engelman, and Steitz hydrophilicity scales; ref. 40) predicts only one transmembrane domain (amino acids 374–392; Fig. 2) at a position homologous to one of the two transmembrane domains predicted by Oh et al. (10) for the human gene. In addition, our analysis predicts other motifs common to both the human and mouse proteins, such as a helix–loop–helix domain (amino acids 225–239) and three repeated motifs of (D or E)-X-X-X-X-L-L. The later motifs are of potential functional significance because this type of di-leucine motif has been proposed to mediate protein trafficking in the endosome/lysosome compartment (41) from which melanosomes are thought to be derived (42). The mouse protein has a polyglutamic acid sequence (amino acids 252–258) whose significance is unknown because it is not present in the human protein.
The spontaneous ep mutation was caused by the insertion of an IAP element in a 3′ coding exon (Figs. 3 and 4). Although most of the ≈2000 IAP elements are stable in the mouse genome (35), insertions are associated with several mutations, including at least four spontaneous mutant alleles at the agouti locus (43). Like the four agouti alleles, the ep IAP element is in an opposite transcriptional orientation to the gene. We note that the IAP insertion is predicted to result in an altered C terminus of the protein, with the last 46 wild-type amino acids replaced by 78 additional IAP-encoded amino acids before encountering a stop codon. The sizes of the major and minor transcripts appear larger in ep, but the mutant transcripts do not appear to be associated with a reduction in steady-state levels (Fig. 5A). The ep gene was expressed in all tissues examined, consistent with the pattern reported for the HPS gene (10), with the possible exception of skeletal muscle (Fig. 5B). The highest expression was observed in lung, liver, kidney, and spleen. Expression of the gene also was detected in cultured melanocytes, eyes, and bone marrow by RT-PCR (data not shown) although we do not know the level of expression in these tissues.
Examination of the ep phenotype in melanized cells and tissues revealed the presence of abnormally large melanosomes (Fig. 6) that may be derived from the fusion of smaller melanosomes also observed in ep melanocytes. The large melanosomes seen in ep melanocytes are similar to the described macromelanosomes seen in the skin of Swiss HPS patients, postulated to be formed by the fusion of smaller microvesicles (37). Thus, ep exhibits the same melanosome phenotype as HPS, which strongly suggests that an aberration of organelle membranes (in this case, melanosomal membranes) underlies the defect.
We also confirmed previous studies (18) that showed that ep platelets have few dense bodies (data not shown). Platelet function was measured in aggregation assays and by ATP release (Fig. 7). The latter assays further demonstrated that ep and HPS platelets have the same phenotype, namely that they are deficient in aggregation response thought to be mediated by dense granule components.
We have shown that ep mirrors HPS in two of the three defining phenotypes: oculocutaneous albinism and storage pool-deficient platelets. The third defining phenotype, ceroid storage disease, was found in ep by Witkop and coworkers (7). Thus, HPS and ep are homologous mutations associated with structural defects of organelles, i.e., dense bodies, melanosomes, and perhaps lysosomes (at least in some tissues). The encoded protein is likely to affect the membrane structures of these organelles, at the level of biosynthesis/trafficking or by mediating the interaction of organelle membranes with other membranes of the cell, perhaps through the di-leucine motif: (D or E)-X-X-X-X-L-L (41). Thus, an understanding of the function of the ep/HPS protein may shed light on the biogenesis of organelles.
Variations in the clinical phenotype from mild to severe are characteristic of HPS (2, 7), even in individuals homozygous for the same mutant allele (ref. 10 and S.C.W., unpublished work). This suggests that other gene products can affect the same pathways as HPS. It will be interesting to see if these gene products include those encoded by the 14 other mouse mutations with similar phenotypes (e.g., the recently identified product of the beige locus, the mouse model for Chediak–Higashi syndrome; refs. 44–46). The identification of ep as the homologue for HPS affords a readily accessible model system in which to study HPS and may help to identify an interacting set of gene products important for organelle function.
Acknowledgments
We dedicate this paper to Donna Appell, R.N., and the HPS Network, Inc., for their tireless efforts to aid people with HPS and to Dr. Edward Kuff on the occasion of his retirement for his work that has enriched our understanding of intracellular organelles and the biology of IAP elements. We thank Drs. Ken Tartof, Kent Hunter, Colin MacNeill, and William Gahl for reviewing the manuscript, and Anita Cywinski for DNA sequencing. This work was supported by grants from the National Institutes of Health at the Fox Chase Cancer Center (Grants GM22167, GM/AR56181, CA09035, and CA06927), at the University of Minnesota (Grant GM22167), and at the Roswell Park Cancer Institute (Grant HL31698).
ABBREVIATIONS
- ep
pale ear
- HPS
Hermansky–Pudlak syndrome
- RT-PCR
reverse transcriptase–PCR
- IAP
intracisternal A particle
- YAC
yeast artificial chromosome
- RACE
rapid amplification of cDNA ends
Note Added in Proof
Feng et al. (47) have reported that ep is the mouse homolog of HPS.
Footnotes
References
- 1.Hermansky F, Pudlak P. Blood. 1959;14:162–169. [PubMed] [Google Scholar]
- 2.Summers C G, Knobloch W H, Witkop C J, King R A. Ophthalmology. 1988;95:545–554. doi: 10.1016/s0161-6420(88)33152-0. [DOI] [PubMed] [Google Scholar]
- 3.King R A, Hearing V J, Oetting W S. In: The Metabolic and Molecular Bases of Inherited Disease, Seventh Edition. Scriver C R, Beaudet A L, Sly W S, Valle D, editors. New York: McGraw–Hill; 1994. pp. 4353–4392. [Google Scholar]
- 4.Bithell T C. In: Wintrobe’s Clinical Hematology. 9th Ed. Lee G R, Bithell T C, Foerster J, Athens J W, Lukens J N, editors. Philadelphia: Lea & Febiger; 1993. pp. 1397–1421. [Google Scholar]
- 5.Weiss H J. In: Hemostasis and Thrombosis: Basic Principles and Clinical Practice. 3rd Ed. Colman R W, Hirsh J, Marder V J, Salzman E W, editors. Philadelphia: Lippincott; 1994. pp. 673–684. [Google Scholar]
- 6.Schinella R A, Greco M A, Cobert B L, Denmark L, W, Cox R P. Ann Intern Med. 1980;92:20–23. doi: 10.7326/0003-4819-92-1-20. [DOI] [PubMed] [Google Scholar]
- 7.Witkop C J, White J G, Townsend D, Sedano H O, Cal S X, Babcock M, Krumwiede M, Keenan K, Love J E, Wolfe L S. In: Lipofuscin—1987: State of the Art. Zs.-Nagy I, editor. Amsterdam: Excerpta Medica; 1988. pp. 413–435. [Google Scholar]
- 8.Wildenberg S C, Oetting W S, Almodovar C, Krumwiede M, White J G, King R A. Am J Hum Genet. 1995;57:755–765. [PMC free article] [PubMed] [Google Scholar]
- 9.Fukai K, Oh J, Frenk E, Almodovar C, Spritz R A. Hum Mol Genet. 1995;4:1665–1669. doi: 10.1093/hmg/4.9.1665. [DOI] [PubMed] [Google Scholar]
- 10.Oh J, Bailin T, Fukai K, Feng G H, Ho L, Mao J, Frenk E, Tamura N, Spritz R A. Nat Genet. 1996;14:300–306. doi: 10.1038/ng1196-300. [DOI] [PubMed] [Google Scholar]
- 11.Novak E K, Hui S-W, Swank R T. Blood. 1984;63:536–544. [PubMed] [Google Scholar]
- 12.Lane P W, Green E L. J Hered. 1967;58:17–20. doi: 10.1093/oxfordjournals.jhered.a107529. [DOI] [PubMed] [Google Scholar]
- 13.Novak E K, Wieland F, Jahreis G P, Swank R T. Biochem Genet. 1980;18:549–561. doi: 10.1007/BF00484401. [DOI] [PubMed] [Google Scholar]
- 14.Novak E K, Swank R T. Genetics. 1979;92:189–204. doi: 10.1093/genetics/92.1.189. [DOI] [PMC free article] [PubMed] [Google Scholar]
- 15.Meisler M H. J Biol Chem. 1978;253:3129–3134. [PubMed] [Google Scholar]
- 16.Swank R T, Reddington M, Novak E K. Lab Anim Sci. 1996;46:56–60. [PubMed] [Google Scholar]
- 17.O’Brien E P, Novak E K, Keller S A, Poirier C, Guénet J-L, Swank R T. Mamm Genome. 1994;5:356–360. doi: 10.1007/BF00356554. [DOI] [PubMed] [Google Scholar]
- 18.Novak E K, Hui S-W, Swank R T. Blood. 1981;57:38–43. [PubMed] [Google Scholar]
- 19.Novak E K, Swank R T, Meisler M. Genet Res Camb. 1980;35:195–204. doi: 10.1017/s001667230001404x. [DOI] [PubMed] [Google Scholar]
- 20.Brown J A, Novak E K, Swank R T. J Cell Biol. 1985;100:1894–1904. doi: 10.1083/jcb.100.6.1894. [DOI] [PMC free article] [PubMed] [Google Scholar]
- 21.Piccini A E, Jahreis G P, Novak E K, Swank R T. Mol Cell Biochem. 1980;31:89–95. doi: 10.1007/BF00240814. [DOI] [PubMed] [Google Scholar]
- 22.McGarry M P, Novak E K, Swank R T. Exp Hematol. 1986;14:261–265. [PubMed] [Google Scholar]
- 23.Zieger B, Hashimoto Y, Ware J. J Clin Invest. 1997;99:520–525. doi: 10.1172/JCI119188. [DOI] [PMC free article] [PubMed] [Google Scholar]
- 24.Frohman M A. In: The Polymerase Chain Reaction. Mullis K B, Ferre F, Gibbs R A, editors. Boston: Birkhauser; 1994. pp. 14–37. [Google Scholar]
- 25.Gardner J M, Nakatsu Y, Gondo Y, Lee S, Lyon M F, King R A, Brilliant M H. Science. 1992;257:1121–1124. doi: 10.1126/science.257.5073.1121. [DOI] [PubMed] [Google Scholar]
- 26.Mattei M-G, deLapeyriere O, Bresnick J, Dickson C, Birnbaum D, Mason I. Mamm Genome. 1995;6:196–197. doi: 10.1007/BF00293012. [DOI] [PubMed] [Google Scholar]
- 27.Dressler G R, Deutsch U, Chowdhury K, Nornes H O, Gruss P. Development. 1990;109:787–795. doi: 10.1242/dev.109.4.787. [DOI] [PubMed] [Google Scholar]
- 28.Henderson C J, Russell A L, Allan J A, Wolf C R. Biochim Biophys Acta. 1992;1118:99–106. doi: 10.1016/0167-4838(92)90135-z. [DOI] [PubMed] [Google Scholar]
- 29.Poirier C, Guenet J-L. Mamm Genome. 1996;6:S309–S316. [PubMed] [Google Scholar]
- 30.Rusiniak M E, O’Brien E P, Novak E K, Barone S M, McGarry M P, Reddington M, Swank R T. Mamm Genome. 1996;7:98–102. doi: 10.1007/s003359900027. [DOI] [PubMed] [Google Scholar]
- 31.Eisinger M, Marko O. Proc Natl Acad Sci USA. 1982;79:2018–2022. doi: 10.1073/pnas.79.6.2018. [DOI] [PMC free article] [PubMed] [Google Scholar]
- 32.Tamura A, Halaban R, Moellmann G, Cowan J M, Lerner M R, Lerner A B. In Vitro Cell Dev Biol. 1987;23:519–522. doi: 10.1007/BF02628423. [DOI] [PubMed] [Google Scholar]
- 33.Swank R T, Sweet H O, Davisson M T, Reddington M, Novak E K. Genet Res Camb. 1991;58:51–62. doi: 10.1017/s0016672300029608. [DOI] [PubMed] [Google Scholar]
- 34.von Heijne G. Nucleic Acids Res. 1986;14:4683–4690. doi: 10.1093/nar/14.11.4683. [DOI] [PMC free article] [PubMed] [Google Scholar]
- 35.Kuff E L, Lueders K K. Adv Cancer Res. 1988;51:183–276. doi: 10.1016/s0065-230x(08)60223-7. [DOI] [PubMed] [Google Scholar]
- 36.Witkop C J, Quevedo W C, Fitzpatrick T B, King R A. In: The Metabolic Basis of Inherited Diseases. Sciver C R, Beaudet A L, Sly W S, Valle D, editors. New York: McGraw–Hill; 1989. pp. 2905–2947. [Google Scholar]
- 37.Frenk E, Lattion F. J Invest Dermatol. 1982;78:141–143. doi: 10.1111/1523-1747.ep12506274. [DOI] [PubMed] [Google Scholar]
- 38.Shinella R A, Greco M A, Garay S M, Lackner H, Wolman S R, Fazzini E P. Hum Pathol. 1985;16:366–376. doi: 10.1016/s0046-8177(85)80230-6. [DOI] [PubMed] [Google Scholar]
- 39.Witkop C J, Krumwiede M, Sedano H, White J G. Am J Hematol. 1987;26:305–311. doi: 10.1002/ajh.2830260403. [DOI] [PubMed] [Google Scholar]
- 40.Engleman D M, Steitz T A, Goldman A. Annu Rev Biophys Biophys Chem. 1986;15:321–353. doi: 10.1146/annurev.bb.15.060186.001541. [DOI] [PubMed] [Google Scholar]
- 41.Pond L, Kuhn L A, Teyton L, Schutze M-P, Tainer J A, Jackson M R, Peterson P A. J Biol Chem. 1995;270:19989–19997. doi: 10.1074/jbc.270.34.19989. [DOI] [PubMed] [Google Scholar]
- 42.Orlow S J. J Invest Dermatol. 1995;105:3–7. doi: 10.1111/1523-1747.ep12312291. [DOI] [PubMed] [Google Scholar]
- 43.Argeson A C, Nelson K K, Siracusa L D. Genetics. 1996;142:557–567. doi: 10.1093/genetics/142.2.557. [DOI] [PMC free article] [PubMed] [Google Scholar]
- 44.Perou C M, Moore K J, Nagle D L, Misumi D J, Woolf E A, McGrail S H, Holmgren L, Brody T H, Dussault B J, Jr, Monroe C A, Duyk G M, Pryor R J, Li L, Justice M J, Kaplan J. Nat Genet. 1996;3:303–308. doi: 10.1038/ng0796-303. [DOI] [PubMed] [Google Scholar]
- 45.Barbosa M D, Nguyen Q A, Tchernev V T, Ashley J A, Detter J C, Blaydes S M, Brandt S J, Chotai D, Hodgman C, Solari R C, Lovett M, Kingsmore S F. Nature (London) 1996;382:262–265. doi: 10.1038/382262a0. [DOI] [PMC free article] [PubMed] [Google Scholar]
- 46.Nagle D L, Karim M A, Woolf E A, Holmgren L, Bork P, Misumi D J, McGrail S H, Dussault B J, Jr, Perou C M, Boissy R E, Duyk G M, Spritz R A, Moore K J. Nat Genet. 1996;14:307–311. doi: 10.1038/ng1196-307. [DOI] [PubMed] [Google Scholar]
- 47.Feng G H, Bailin T, Oh J, Spritz R A. Hum Mol Genet. 1997;6:793–797. doi: 10.1093/hmg/6.5.793. [DOI] [PubMed] [Google Scholar]


