Abstract
Metallothioneins (MTs) are a family of metal binding proteins that have been proposed to participate in a cellular defense against zinc toxicity and free radicals. In the present study, we investigated whether increased expression of MT in MT-1 isoform-overexpressing transgenic mice (MT-TG) affords protection against mild focal cerebral ischemia and reperfusion. Transient focal ischemia was induced in control (wild type) and MT-TG mice by occluding the right middle cerebral artery for 45 min. Upon reperfusion, cerebral edema slowly developed and peaked at 24 hr as shown by T2-weighted MRI. The volume of affected tissue was on the average 42% smaller in MT-TG mice compared with control mice at 6, 9, 24, and 72 hr and 14 days postreperfusion (P < 0.01). In addition, functional studies showed that 3 weeks after reperfusion MT-TG mice showed a significantly better motor performance compared with control mice (P = 0.011). Although cortical baseline levels of MT-1 mRNA were similar in control and MT-TG mice, there was an increase in MT-1 mRNA levels in the ischemic cortex of MT-TG mice to 7.5 times baseline levels compared with an increase to 2.3 times baseline levels in control mice 24 hr after reperfusion. In addition, MT-TG mice showed an increased MT immunoreactivity in astrocytes, vascular endothelial cells, and neurons 24 hr after reperfusion whereas in control mice MT immunoreactivity was restricted mainly to astrocytes and decreased in the infarcted tissue. These results provide evidence that increased expression of MT-1 protects against focal cerebral ischemia and reperfusion.
Metallothioneins (MTs) are a family of four low molecular weight, metal binding proteins with a high cysteine content, known as MT-1, MT-2, MT-3, and MT-4 (1). In adult mice, MT-1 and MT-2 are found in all organs, whereas MT-3 is expressed mainly in brain (2), and MT-4 is most abundant in certain stratified squamous epithelial tissues (3). MT-1 and MT-2 gene promoters are complex, consisting of multiple regulatory elements that are activated by heavy metals, oxygen free radicals, glucocorticosteroids, cytokines, and immediate early genes (4–6). These regulatory elements account for the rapid transcription of MT-1 and MT-2. Previous studies suggest that MTs serve as important regulators of metal homeostasis and as a source of zinc incorporated into proteins, including transcription factors (7, 8). As such, MTs are able to prevent zinc deficiency and toxicity in vivo (9–11), but also have been proposed to function as detoxifying agents of other reactive metals and free radicals (12–14). Both zinc toxicity (15) and oxidative stress (16) previously have been shown to contribute to ischemia-induced cell death. Although zinc serves as an important cofactor in many proteins, high levels of free zinc are deleterious to many cells including those in the central nervous system (17). In a recent study, Koh et al. (15) showed that selective neuronal cell death after global cerebral ischemia is associated with the accumulation of zinc and that chelation of zinc with calcium-EDTA decreased this degeneration. Although MT-1 and MT-2 previously have been shown to increase after an ischemic insult (18), it is still unknown whether they exert a protective role after ischemia. Transgenic mice have been created that contain 56 copies of a MT-1 transgene expressed from its endogenous promoter (19). These mice have been shown to express increased levels of MT-1 protein and mRNA in various tissues and responded to MT inducers similar to control mice (20). In the present study, we show that MT-1 transgenic (MT-TG) mice have a reduced infarct size and reduced sensorimotor defects after cerebral ischemia.
Materials and Methods
Surgical Procedure.
All experiments involving the use of animals were approved by Genentech’s Animal Care and Use Committee (American Association for the Accreditation of Laboratory Animal Care accredited). Mice were obtained from The Jackson Laboratory. The MT-TG mice originally were developed on a C57BL/6J × SJL background (19). At The Jackson Laboratory, these mice were back-crossed with C57BL/6J for five generations. Homozygous mice [C57BL/6J-TgN(Mt1)174Bri] were obtained by inter-crossing the progeny from N5, and the colony was maintained by homozygous breeding. C57BL/6J mice were used as controls.
Adult 8- to 10-week-old MT-TG mice (n = 31) and control mice (n = 36) were anesthetized with 1.5% isoflurane (O2/N2O, 30%:70%, vol/vol). Core temperature was maintained at 37°C during and 6 hr after reperfusion. The right middle cerebral artery (MCA) was exposed via a craniotomy and ligated with a 11–0 Dermalon suture (TE50, Davis+Geck, Wayne, NJ). The right common carotid artery also was occluded for the ischemic period (45 min). Complete interruption of the blood flow and subsequent reflow were verified directly under the microscope. The cranial window was covered with Gelfoam (size 4, Upjohn), and the skin was temporarily sutured for MRI during occlusion or permanently sutured after reflow. These animals then were allowed to recover for imaging at later time points. A group of four control and four MT-TG mice were imaged during occlusion and again at 3, 9, and 24 hr after reperfusion. Another group of 20 control and 18 MT-TG animals were analyzed by MRI at 6, 9, and 24 hr after reperfusion. At 24 hr after reperfusion, eight control animals and nine MT-TG animals were sacrificed for immunocytochemical or mRNA analysis. The remaining animals were reanalyzed at 3 days and 14 days after reperfusion. After behavior tests, animals were sacrificed for immunocytochemical, histopathological, or mRNA analysis. Between 6 and 24 hr after reperfusion, one animal in each group died. In a separate group of animals (seven control and nine MT-TG mice), the right femoral artery was cannulated with a microcannula (Microcannulation System, FST 18000–10, Fine Science Tools, Foster City, CA) for monitoring of blood pressure and pulse rate, blood glucose, and blood gases. Measurements were performed before, during, and 30 min after 45 min of MCA occlusion.
MRI Measurements.
MRI experiments were performed on a Varian Unity Inova imaging system operating at 4.7 T and using a 40-mm inner diameter volume radio frequency coil operating in quadrature mode. Images were obtained with a field of view 20 mm square, acquisition matrix size 64 square, slice thickness 1 mm, repetition time 2 s, and with two averages. Image analysis was performed off-line by using the mrvision software (MRVision, Menlo Park, CA). Parameter maps were obtained from two parameter monoexponential fits. T2-weighted images were obtained with a multiecho sequence with eight equally spaced echoes 15 ms apart. Diffusion-weighted images were obtained by using a pulsed field gradient spin echo technique with an echo time of 21 ms and three diffusion weights (21) (b = 262,513,1048 s/mm2). Diffusion sensitization was perpendicular to the image plane. At time points up to 72 hr infarcted cortex was delineated by using the apparent diffusion coefficient (ADC) and T2 parameter maps in the two hemispheres. Regions of interest bounding the cortex were drawn by hand over each hemisphere and evaluated three times before using the mean result. “Normal” tissue was considered to have a value within two SDs of the mean parameter value in the contralateral side. Infarcted tissue was identified by a value threshold more than two SDs below (diffusion) or above (T2) the normal range. At 14 days, the infarct size was evaluated in high-resolution anatomical fast spin echo images (acquisition matrix size 128 square) by subtracting the volume of the ipsilateral from the contralateral hemispheres. The volume of the hemisphere was determined from hand-drawn regions of interest around the cortex through 13 contiguous images of the brain. Image analysis was carried out independently by two investigators (M.v.L.C. and J.T.P.) blinded to the identity of the animals.
Behavior Test.
Four groups of animals were tested 3 weeks after reperfusion: control (n = 15) and MT-TG (n = 8) nonoperated animals, and control (n = 9) and MT-TG (n = 10) operated animals. Before commencing this study, we performed several behavioral tests and found the rotarod test to be most sensitive to the sensorimotor defects induced by the ischemic insult. The rotarod consisted of an automated six-lane unit connected to a personal computer for system control and data management. Mice were first habituated to a stationary rod (Ugo Basile, Varese, Italy). After habituation they were exposed to the rotating rod. The latency (in sec) to fall was measured (22). The rod was started at 2 rpm and accelerated linearly to 20 rpm within 300 sec. Mice were required to stay on the accelerating rod for a minimum of 30 sec. If they were unable to reach this criterion, the trial was repeated for a maximum of five times. The two best (largest) fall latency values a mouse could achieve then were averaged and used for data analysis. The examiner (R.G.) was blinded to the identity of the animals.
Histopathology and Immunocytochemistry.
Control animals (n = 8) and MT-TG animals (n = 8) were perfusion-fixed, and the brains were paraffin-embedded, sectioned, and stained with hematoxylin and eosin. Antigen retrieval was achieved by heating the sections to 90°C in antigen retrieval compound (AR-10 solution, BioGenex). Immunocytochemistry was performed by using a mAb recognizing both MT-1 and MT-2 (0.1 μg/ml; E9, Dako; n = 10) and peroxidase-conjugated secondary antibodies. Staining was performed with the ImmunoPure Metal Enhanced DAB Substrate Kit (Pierce) according to the manufacturer’s instructions. For double labeling of MT and glial fibrillary acidic protein (GFAP), an additional step was added by using polyclonal antibodies to GFAP (Dako) and the Dako EnVision Doublestain System according to the manufacturer’s instructions. The specificity of the immunoreaction for MT was tested by using sections obtained from MT knockout mice (The Jackson Laboratory, 129/Sv-Mt1tm1Bri Mt2tm1Bri).
mRNA Expression Analysis.
One day and 21 days after reperfusion, total RNA from the parietal cortices was isolated by using the RNA Stat procedure (Tel-Test, Friendswood, TX). Real-time TaqMan PCR quantification of MT-1 mRNA was performed by using gene-specific primers and fluorogenic probes and a TaqMan PCR detector (Applied Biosystems) as described (23). Reagents used were included in the Access reverse transcriptase–PCR kit (Promega). The primer sets amplified a 134-bp fragment overlapping exons 1, 2, and 3 of murine MT-1 (corresponding to sequences 392–401, 885–950, and 1162–1220, respectively. GenBank accession no. J00605; ref. 24). MT-1 mRNA levels were corrected for mouse glyceraldehyde-3-phosphate dehydrogenase or ribosomal protein L19 (RPL-19) and expressed as arbitrary units.
Statistics.
Differences in the volume of tissue with a reduced ADC were tested with a two-sided t test. Quadratic curves were fitted to individual profiles in which changes in the volume of tissue with an increased T2 relaxation time were plotted versus time. Differences in the estimated parameters between control and MT-TG mice then were statistically tested. Differences in rotarod performance and mRNA content were tested by using ANOVA followed by the Fisher’s least-significant-difference test, and differences in ADC and T2 values and infarct volumes at 14 days reperfusion were tested with the Student’s t test.
Results
Physiological Variables.
There were no significant differences in the physiological variables between control and transgenic animals after 30 min reperfusion. The values for control and MT-TG mice were as follows: mean arterial blood pressure (mmHg) 76.1 ± 9.7 and 81.6 ± 13.9, plasma glucose (mg/dl) 183.5 ± 28.85 and 176.7 ± 21.54, arterial pH 7.33 ± 0.04 and 7.37 ± 0.04, partial blood CO2 pressure (torr) 31.5 ± 6.7 and 33.0 ± 5.5, partial blood O2 pressure (torr) 124.8 ± 28.9 and 123.9 ± 23.0 and core temperature (°C) 37.2 ± 0.2 and 37.1 ± 0.1. The mean arterial blood pressure before and during occlusion was 83.0 ± 9.5 and 82.8 ± 9.4 mm Hg for control, and 86.6 ± 10.2 and 87.7 ± 10.7 mm Hg for MT-TG animals.
Reduction in Cerebral Edema and Infarct Size in MT-TG Mice.
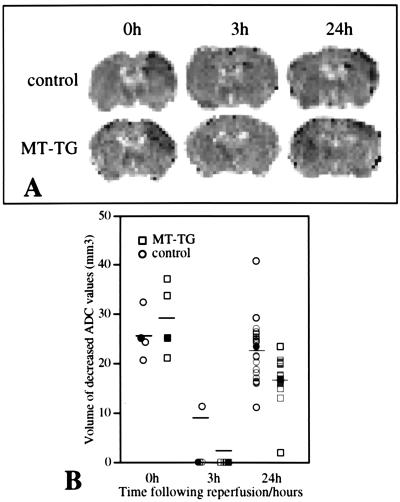
MCA occlusion induced an acute reduction in the ADC of water in the ischemic parietal cortex. The extend of the ADC reduction was comparable in MT-TG and control mice (637 ± 76 × 10−6 mm2/s in the contralateral cortex versus 415 ± 40 × 10−6 mm2/s in the ischemic cortex of control mice, and 620 ± 21 × 10−6 mm2/s in the contralateral cortex versus 410 ± 43 × 10−6 mm2/s in the ischemic cortex of MT-TG mice, mean ± SD, n = 4, P = 0.45). Similarly, the volume of the ischemic territory as defined by a decrease in tissue ADC did not differ significantly between the two groups during occlusion (Fig. 1 A and B). Three hours after reperfusion, the ADC changes were normalized, but a secondary reduction in ADC was seen at 6 hr and further progressed until 24 hr after reperfusion (Fig. 1A). The volume of tissue over which the second ADC reduction took place was significantly smaller in the MT-TG mice compared with control mice at 24 hr after reperfusion (P < 0.01; Fig. 1B).
Figure 1.
Acute and delayed changes in the volume of tissue with a reduction in the ADC in control and MT-TG mice. (A) Maps depicting the ADC values at 20 min after occlusion (0h) and at 3 and 24 hr after reperfusion. The dark areas in the upper right cortex indicate tissue with a reduced ADC. (B) The volumes of ADC reduction during occlusion (0h) were similar in control and MT-TG mice. The ADC response normalized at 3 hr after reperfusion, but during the secondary response at 24 hr, the volume of tissue with a reduced ADC was significantly smaller in MT-TG mice as compared with wild-type (control) mice (P < 0.01). Individual values are plotted, and the mean values are indicated by the horizontal bars at each time point. The images shown are obtained from the same animals at different time points. The filled symbols represent values obtained from the animals shown in A. At 24 hr measurements from an additional group of animals have been included.
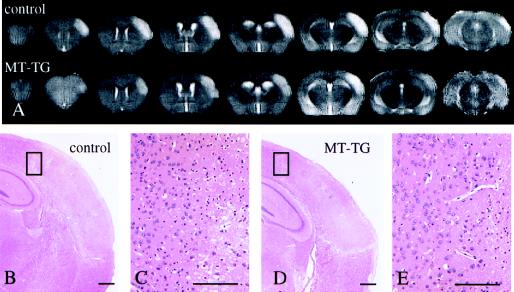
Changes in T2-weighted images were directly compared with histological changes in the same animals. The increase in T2 relaxation time was maximal for both control and MT-TG mice at 24 hr as evidenced by an hyperintense area on T2-weighted images (Fig. 2A). The hyperintensity in the T2-weighted images corresponded to an area of edematous and pyknotic changes in histological sections (Fig. 2 B–E). The infarcted area was restricted mainly to the forelimb and barrelfields of the somatosensory cortex with an extension into the secondary somatosensory cortex. Some edema formation and cell death could be detected in the dorsolateral areas of the striatum of control animals (results not shown). The ischemic insult did not affect the underlying hippocampus or basal ganglia. Sham operation induced no changes in tissue ADC but a minor (± 1–2 mm3) local T2 response around the site of the MCA occlusion (results not shown).
Figure 2.
(A) Reduction in infarct size in MT-TG mice as shown by serial high-resolution coronal MRI images and histological sections through the brains of representative control and MT-TG mice, 24 hr after reperfusion. The volume of tissue with an increased T2-relaxation time (light area) is reduced in the MT-TG mouse as compared with a control animal. After imaging, brains were fixed and processed for paraffin embedding and hematoxylin and eosin staining. The areas with an increased T2 response in A are marked by cell swelling and nuclear pycnosis (B and D, boxed areas of the ischemic border zone are shown at higher magnification in C and E). (Scale bars = 200 μm.)
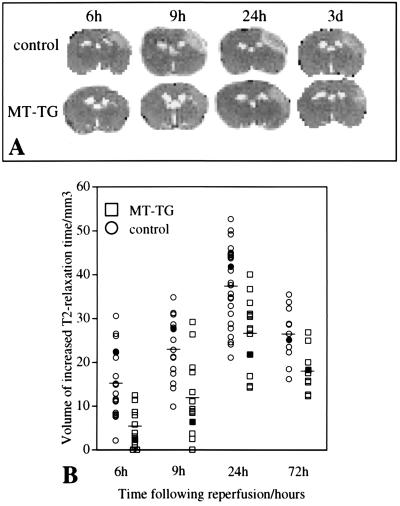
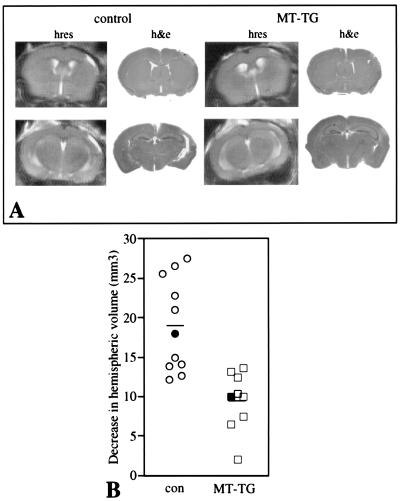
Changes in the extent of cerebral edema were measured in T2-weighted maps (Fig. 3A). The volume of tissue with an increased T2 relaxation time expanded beyond 6 hr of reperfusion and was maximal by 24 hr. At this time point, T2 values were significantly higher in the ipsilateral cortex of control animals (89 ± 8 ms) as compared with MT-TG animals (78 ± 14 ms, mean ± SD, P < 0.01, n = 17–19). The average T2 value in the contralateral cortex of control and MT-TG animals was 52 ± 4 ms. The cerebral edema partly resolved by 72 hr after reperfusion. Overall, there was no significant difference in the average shape of the profile plots of time versus T2 volume between transgenic and control mice. But, at all time points, the extent of cerebral edema measured from the hyperintensity in T2-weighted images was significantly smaller in MT-TG as compared with control mice (Fig. 3B, P < 0.01). Over the next 2 weeks, the ischemic area developed into a cavity infiltrated with macrophages and monocytes. At 2 and 3 weeks after reperfusion, a reduced infarct size in MT-TG mice was detected by using both high-resolution MRI and histological sections, respectively (Fig. 4A). The infarction was determined by the amount of tissue loss in the ipsilateral compared with the contralateral hemisphere in high-resolution MRI (Fig. 4B) and was significantly smaller in MT-TG mice as compared with control mice (P < 0.01).
Figure 3.
MT-TG mice show a reduction in the volume of T2-weighted changes. (A) Representative T2 maps from the same animals at different time points after reperfusion. The bright area in the upper right cortex indicates tissue with an elevated T2 relaxation time. (B) Volumes of tissue with an increased T2 relaxation time. Individual values are plotted and the mean values are indicated by the horizontal bars at each time point. MT-TG mice had a significantly smaller volume of tissue with an increased T2 relaxation time at all time points (P < 0.01). Filled symbols represent the volumetric measurements of the animals shown in A.
Figure 4.
(A) Sparing of cortical tissue in MT-TG mice. High-resolution (hres) anatomical images taken 2 weeks after reperfusion are compared with hematoxylin and eosin (h&e)-stained sections from the same animal, prepared 3 weeks after reperfusion. The images show a reduction in the amount of cortical tissue when the infarct develops into a cavitary lesion containing foamy macrophages and neutrophils bordered by relatively intact tissue. (B) Volumes of lost tissue are calculated from serial high-resolution images obtained 2 weeks after reperfusion. There is significant sparing of cortical tissue in MT-TG mice as compared with control mice (P < 0.01). The filled symbols represent the values of the animals shown in A. Horizontal lines indicate the means for each time point.
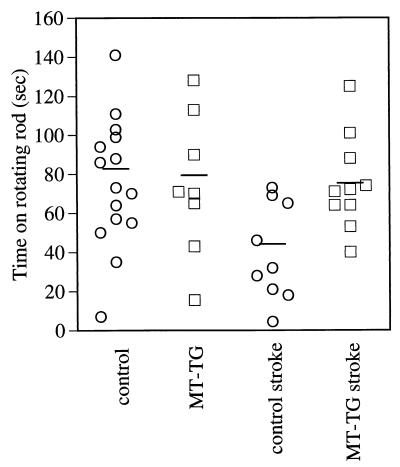
Three weeks after reperfusion, mice underwent a test for motor performance. The rotarod test reflects alterations in motor learning and sensory and motor function and was performed to determine whether sparing of somatosensory cortical tissue in MT-TG mice resulted in sparing of function. MT-TG mice performed significantly better in the rotarod test as compared with control mice 3 weeks after reperfusion (Fig. 5, P = 0.011). This finding was not caused by a difference in genetic background because no significant differences in baseline performance were found between nonoperated control and MT-TG animals.
Figure 5.
Improved motor performance in MT-TG mice. Rotarod testing of MT-TG and control mice were performed 3 weeks after MCA occlusion. MT-TG animals performed significantly better in a rotarod test compared with control animals [control stroke is significantly different from MT-TG stroke, P = 0.011, Fisher’s least-significant-difference test; ANOVA: F (3,38) = 4.827, P = 0.006]. Nonoperated control and MT-TG animals performed similarly.
Regulation of MT-1 mRNA and Protein Expression After MCA Occlusion and Reperfusion.
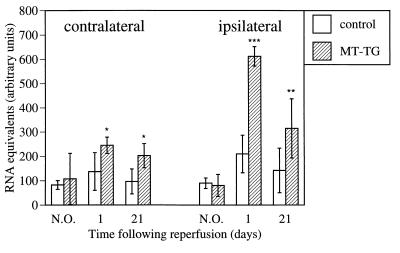
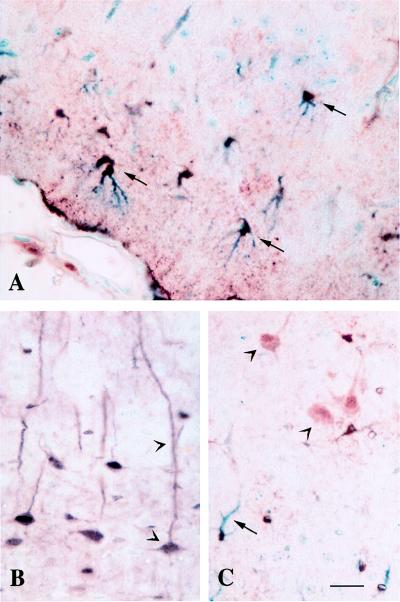
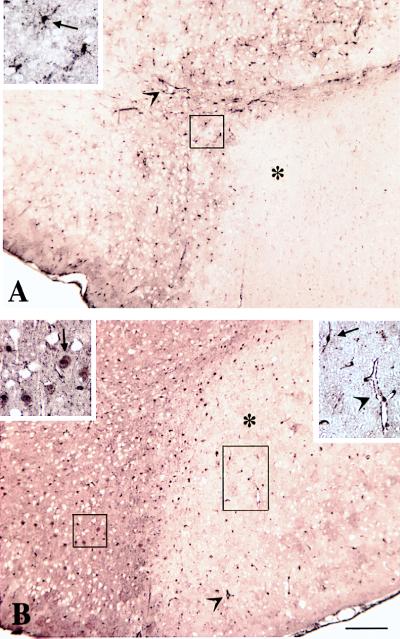
The expression pattern of MT in nonoperated MT-TG mice compared with control C57BL/6J mice was similar to that described in a previous study in which the transgenic offspring from B57BL/6J × SJL mice were compared with wild-type littermates (20). Similar to this study, we found seven times higher MT-1 mRNA levels in liver of MT-TG animals as compared with wild-type control animals (42.74 ± 19.27 versus 6.32 ± 3.26 RNA equivalents; arbitrary units, mean ± SD, corrected for glyceraldehyde-3-phosphate dehydrogenase levels) whereas cortical MT-1 mRNA levels did not differ significantly (see Fig. 6). This finding indicates that the genetic background had little effect on cortical MT-1 expression. MT-1 mRNA levels in the ipsilateral parietal cortex of MT-TG mice significantly increased to reach 7.5 times baseline levels at 24 hr after reperfusion, compared with 2.3 times baseline levels in control mice (Fig. 6). At 21 days after reperfusion, MT-1 mRNA levels reduced to 3.9 times baseline levels in MT-TG animals and 1.5 times baseline levels in control animals. In the contralateral cortex, a significant increase to 2.3 times baseline MT-1 mRNA levels was found in the MT-TG mice at 1 day and was still twice the baseline levels at 21 days whereas no significant changes were found in contralateral MT-1 mRNA levels of control animals. Similar results were obtained when MT-1 mRNA was corrected for RPL-19 mRNA (results not shown). Immunocytochemistry showed MT staining in the peri-infarct area of control animals including the ependymal cells of the ventricles, the pia mater, arachnoid and in glial cells, some of which stained positive for glial-fibrillary acidic protein (Fig. 7A). The mAb used in this study detects both MT-1 and MT-2, and the antigen therefore is referred to as MT. Although the mRNA content of cortical homogenates did not differ between nonoperated MT-TG and control animals, clear expression of MT protein was found in dendrites and cell bodies of pyramidal neurons in nonischemic (Fig. 7B) and ischemic (Fig. 7C) cortices of MT-TG mice. The lack of a clear difference in MT-1 mRNA between control and MT-TG animals indicates that either the fraction of neuronally expressed transgenic MT-1 mRNA is too small to be detected with the applied method, or the increased expression of the transgene is compensated for by the down-regulation of endogenous MT-1. Twenty-four hours after reperfusion, increased MT immunoreactivity was found in glial cells and vascular endothelial cells of the ischemic border zone, but a near absence of staining was found in the infarcted area of control mice (Fig. 8A). In contrast, MT-TG animals showed an increased expression of MT in astrocytes and vascular endothelial cells of the infarcted cerebral cortex and in the different cell types including neurons of the infarct border area (Fig. 8B). At 3 weeks after reperfusion, expression of MT-1 protein in MT-TG animals was increased in astrocytes, microglia/macrophages, microvascular endothelial cells, and neurons bordering the infarct, which had now progressed into a discrete cavitary lesion (results not shown). Specificity of the MT immunoreactivity was proven by the absence of staining in sections obtained from MT knockout mice (results not shown).
Figure 6.
Increased expression of MT-1 mRNA in MT-TG mice. MT-1 levels were significantly higher in MT-TG mice both in the ipsilateral (ischemic) cortex and contralateral cortex 1 day and 21 days after reperfusion as compared with nonoperated (N.O.) animals. Values in arbitrary units are expressed as mean ± SD, n = 5–7. * indicates significant difference from N.O. value; * = P < 0.05; ** = P < 0.001; *** = P < 0.0001, Fisher’s least-significant-difference test.
Figure 7.
Different expression pattern of MT in control and MT-TG mice. In the infarct border zone of the cortex of control mice, MT immunoreactivity was predominantly found in astrocytes [arrows in A; shown is double labeling of MT (brown) and glial fibrillary acidic protein (blue)]. In MT-TG animals, MT immunoreactivity was found both in cortical pyramidal neurons of the contralateral cortex (arrowheads in B) and in neurons (arrowheads) and astrocytes (arrow) of the infarcted cortex (C). (Scale bar = 50 μm.)
Figure 8.
Increased expression of MT in the ischemic cortex of MT-TG mice 24 hr after reperfusion. In control mice (A), a low level of MT immunoreactivity was found in glial cells (arrow in Inset) and vascular endothelial cells (arrowhead) of the infarct border zone, but no MT immunoreactivity was found in the infarcted cortex (∗). In MT-TG mice (B), immunocytochemical staining of MT was increased in neurons of the infarct border zone (arrow in Upper Left Inset) and in vascular endothelial cells (arrowheads) and glial cells (arrow in Upper Right Inset) of the infarcted cortex (∗). (Scale bar = 200 μm.)
Discussion
This study shows that mice overexpressing MT-1 have a reduction in cerebral edema, a reduced infarct volume, and improvement in sensory and motor function after focal cerebral ischemia and reperfusion. Along with an increased expression of MT-1 mRNA and protein in the infarcted cortex of MT transgenic mice after an ischemic insult, these results indicate a protective role for MT-1 in cerebral ischemia and reperfusion.
MTs have both a capacity to serve as a reservoir for zinc and copper in the case of a deficiency (11) or as detoxifyers of heavy metals (8). The contribution of excessive intracellular free zinc to neuronal cell death after forebrain ischemia recently has been established. Synaptically released zinc may enter neurons through calcium channels or through transporter-mediated exchange with intracellular sodium (25). Neutralization of zinc through extracellular chelation with CaEDTA protects against ischemic injury (15). It is still unclear how transgenic MT-1 can help ameliorate zinc toxicity after an ischemic insult. When the ischemic insult induces cellular accumulation of free zinc, the MT-1 molecules are most likely fully saturated with zinc. It may be that the accumulation of zinc released from synaptic vesicles and zinc released from MTs after oxidative stress (26) could activate transcription of MT-1 through metal transcription factor-1 (27). The increased de novo synthesis of the transgene may then in turn have a protective role by binding excess zinc when the cellular redox state has been restored. A presumptive role of MTs as zinc detoxifying proteins in the brain has been reported in a recent study that showed that overexpression of the brain-specific MT family member MT-3 protects CA3 hippocampal neurons against cell death induced by seizures (28), a situation where massive release of zinc from mossy fiber terminals occurs (29). So far a role of MT-3 after ischemic cortical injury has not been established.
Apart from their role in zinc and copper homeostasis, MTs have been suggested to play a major role in protecting against free radicals in cell-free systems (30) but so far there is no evidence for this presumed role in vivo. There is considerable evidence that superoxide radical, formed in postischemic tissue, is an important mediator of reperfusion injury (16). Of interest, copper MT can substitute for superoxide dismutase (SOD) in protecting yeast from oxidative stress (31) and therefore may exert a protective function in the ischemic brain similar to SOD (32). In addition, cells expressing MTs are resistant to toxic effects of NO (33). After cerebral ischemia, the activity of inducible NO synthethase and the production of NO are increased and significantly contribute to infarct development (34).
An interesting finding in our study is the high neuronal expression of MT in the MT-TG mice that contrasts with the expression in wild-type mice, where MT protein is exclusively localized to non-neuronal cells (35). Although MT-3 is constitutively expressed in brain neurons and may serve as the neuroprotective MT in this area under circumstances of cellular injury (28), MT-3 is not inducible by the various factors that induce MT-1 and MT-2 expression (2), and, in contrast to MT-1 and MT-2, mRNA levels are reduced after an ischemic insult (36). Therefore, the high expression of MT in neurons may compensate for the lack of MT-3 expression in the infarcted cortex. Neuronal expression of MT-1 in the MT-TG mice makes these mice potentially suitable to study the protective roles of MT-1 in other neurodegenrative diseases models, like kainic acid-induced neurodegeneration in the CA3 area of the hippocampus. The transgene is most likely constitutively expressed, as shown by the increased expression MT-1 in neurons of transgenic nonoperated animals but total levels of cortical MT are not increased. Either the neuronal-expressed transgenic MT-1 contributes only to a too small portion of total MT to detect with the current method, or the increased expression of the transgene is compensated for by the down-regulation of endogenous MTs.
In this study we applied noninvasive MRI to monitor the effects of MT-1 overexpression over prolonged time periods to ascertain that the protection in the MT-TG animals was persistent. The two imaging parameters used, diffusion-weighted MRI and T2-weighted MRI, are now well-established techniques to measure cytotoxic and vasogenic edema, respectively (37). Furthermore, the use of noninvasive MRI allows us to monitor infarct development over an unlimited period of time in the same animal. In a mouse model of focal cerebral ischemia, cell death recently has been reported to continue beyond the first 24 hr after MCA occlusion and reperfusion (34). In the present study we show that, in addition to protecting against the development of cerebral edema as one of the acute consequences of ischemia/reperfusion in the brain, MT-1 further prevented delayed neurodegeneration, which may contribute to the significant sparing of function measured 3 weeks after reperfusion. A role for MT in recovery from cortical injury has been shown recently in MT-1/2-deficient mice that showed impaired wound healing after cortical freeze injury (38).
During the occlusion, the acute changes in diffusion-weighted images were similar in control and MT-TG mice, indicating that MT-1 overexpression did not influence the acute tissue response to MCA occlusion. In contrast, the secondary changes in diffusion-weighted images and the delayed increase in T2 relaxation time, which depicts a nonreversible process of blood-brain barrier breakdown and cellular necrosis (39), was attenuated in the transgenic mice. The processes underlying these secondary changes may be closely related to reperfusion injury (40) and may be major targets for MT-1-mediated protection. A function of MT-1 in protecting against blood-brain barrier breakdown is consistent with a high expression of MT-1 in microvascular endothelial cells and astrocytes, predominantly in the ischemic area. The endothelial cells and the astrocytic endfeet apposed to the parenchymal side of these cells exhibit specialized properties limiting the exchange of soluble substances between the circulation and the brain parenchyma. After cerebral ischemia and reperfusion, MT-1 may protect against microvascular permeability changes caused by free radical induced damage (41) or zinc toxicity (15). The cellular mechanisms by which MT-1 protects against cerebral ischemia-reperfusion injury may be similar to that in other tissues as shown by a recent study that reported that overexpression of MT-1 in the heart of mice inhibited ischemia-reperfusion injury (42).
In conclusion, this study describes a close correlation between increased expression levels of MT-1 and protection against cerebral ischemia and reperfusion. Based on the potential role of MT-1 as a modulator of zinc toxicity and cellular redox state, these results indicate MTs as novel target molecules for treatment of stroke and further support a role of free radicals and/or heavy metal toxicity in the pathogenesis of stroke.
Acknowledgments
We thank C. Galindo for statistical evaluation of the data, I. S. Grewal for critically reading the manuscript, and the DNA synthesis group for oligonucleotide synthesis.
Abbreviations
- ADC
apparent diffusion coefficient
- MT
metallothionein
- MT-TG
MT transgenic mice
- MCA
middle cerebral artery
Footnotes
This paper was submitted directly (Track II) to the PNAS office.
References
- 1.Hamer D H. Annu Rev Biochem. 1986;55:913–951. doi: 10.1146/annurev.bi.55.070186.004405. [DOI] [PubMed] [Google Scholar]
- 2.Palmiter R D, Findley S D, Whitmore T E, Durnam D M. Proc Natl Acad Sci USA. 1992;89:6333–6337. doi: 10.1073/pnas.89.14.6333. [DOI] [PMC free article] [PubMed] [Google Scholar]
- 3.Quaife C J, Findley S D, Erickson J C, Froelick G J, Kelly E J, Zambrowicz B P, Palmiter R D. Biochemistry. 1994;33:7250–7259. doi: 10.1021/bi00189a029. [DOI] [PubMed] [Google Scholar]
- 4.Palmiter R D. Exs. 1987;52:63–80. doi: 10.1007/978-3-0348-6784-9_4. [DOI] [PubMed] [Google Scholar]
- 5.Dalton T, Palmiter R D, Andrews G K. Nucleic Acids Res. 1994;22:5016–5023. doi: 10.1093/nar/22.23.5016. [DOI] [PMC free article] [PubMed] [Google Scholar]
- 6.Kasutani K, Itoh N, Kanekiyo M, Muto N, Tanaka K. Toxicol Appl Pharmacol. 1998;151:143–151. doi: 10.1006/taap.1998.8452. [DOI] [PubMed] [Google Scholar]
- 7.Zeng J, Vallee B L, Kagi J H. Proc Natl Acad Sci USA. 1991;88:9984–9988. doi: 10.1073/pnas.88.22.9984. [DOI] [PMC free article] [PubMed] [Google Scholar]
- 8.Palmiter R D. Proc Natl Acad Sci USA. 1998;95:8428–8430. doi: 10.1073/pnas.95.15.8428. [DOI] [PMC free article] [PubMed] [Google Scholar]
- 9.Kelly E J, Quaife C J, Froelick G J, Palmiter R D. J Nutr. 1996;126:1782–1790. doi: 10.1093/jn/126.7.1782. [DOI] [PubMed] [Google Scholar]
- 10.Lee D K, Fu K, Liang L C, Dalton T, Palmiter R D, Andrews G K. Mol Reprod Dev. 1996;43:158–166. doi: 10.1002/(SICI)1098-2795(199602)43:2<158::AID-MRD4>3.0.CO;2-Q. [DOI] [PubMed] [Google Scholar]
- 11.Dalton T, Fu K, Palmiter R D, Andrews G K. J Nutr. 1996;126:825–833. doi: 10.1093/jn/126.4.825. [DOI] [PubMed] [Google Scholar]
- 12.Liu J, Kershaw W C, Klaassen C D. Toxicol Appl Pharmacol. 1991;107:27–34. doi: 10.1016/0041-008x(91)90327-b. [DOI] [PubMed] [Google Scholar]
- 13.Liu Y, Liu J, Iszard M B, Andrews G K, Palmiter R D, Klaassen C D. Toxicol Appl Pharmacol. 1995;135:222–228. doi: 10.1006/taap.1995.1227. [DOI] [PubMed] [Google Scholar]
- 14.Thornalley P J, Vasak M. Biochim Biophys Acta. 1985;827:36–44. doi: 10.1016/0167-4838(85)90098-6. [DOI] [PubMed] [Google Scholar]
- 15.Koh J Y, Suh S W, Gwag B J, He Y Y, Hsu C Y, Choi D W. Science. 1996;272:1013–1016. doi: 10.1126/science.272.5264.1013. [DOI] [PubMed] [Google Scholar]
- 16.Chan P H. Stroke. 1996;27:1124–1129. doi: 10.1161/01.str.27.6.1124. [DOI] [PubMed] [Google Scholar]
- 17.Choi D W, Koh J Y. Annu Rev Neurosci. 1998;21:347–375. doi: 10.1146/annurev.neuro.21.1.347. [DOI] [PubMed] [Google Scholar]
- 18.Ebadi M, Iversen P L, Hao R, Cerutis D R, Rojas P, Happe H K, Murrin L C, Pfeiffer R F. Neurochem Int. 1995;27:1–22. doi: 10.1016/0197-0186(94)00164-p. [DOI] [PubMed] [Google Scholar]
- 19.Palmiter R D, Sandgren E P, Koeller D M, Brinster R L. Mol Cell Biol. 1993;13:5266–5275. doi: 10.1128/mcb.13.9.5266. [DOI] [PMC free article] [PubMed] [Google Scholar]
- 20.Iszard M B, Liu J, Liu Y, Dalton T, Andrews G K, Palmiter R D, Klaassen C D. Toxicol Appl Pharmacol. 1995;133:305–312. doi: 10.1006/taap.1995.1155. [DOI] [PubMed] [Google Scholar]
- 21.Le Bihan D, Breton E, Lallemand D, Grenier P, Cabanis E, Laval-Jeantet M. Radiology. 1986;161:401–407. doi: 10.1148/radiology.161.2.3763909. [DOI] [PubMed] [Google Scholar]
- 22.Gerlai R, Millen K J, Herrup K, Fabien K, Joyner A L, Roder J. Behav Neurosci. 1996;110:126–133. doi: 10.1037//0735-7044.110.1.126. [DOI] [PubMed] [Google Scholar]
- 23.Gibson U E, Heid C A, Williams P M. Genet Res. 1996;6:995–1001. doi: 10.1101/gr.6.10.995. [DOI] [PubMed] [Google Scholar]
- 24.Glanville N, Durnam D M, Palmiter R D. Nature (London) 1981;292:267–269. doi: 10.1038/292267a0. [DOI] [PubMed] [Google Scholar]
- 25.Sensi S L, Canzoniero L M, Yu S P, Ying H S, Koh J Y, Kerchner G A, Choi D W. J Neurosci. 1997;17:9554–9564. doi: 10.1523/JNEUROSCI.17-24-09554.1997. [DOI] [PMC free article] [PubMed] [Google Scholar]
- 26.Maret W, Vallee B L. Proc Natl Acad Sci USA. 1998;95:3478–3482. doi: 10.1073/pnas.95.7.3478. [DOI] [PMC free article] [PubMed] [Google Scholar]
- 27.Palmiter R D. Proc Natl Acad Sci USA. 1994;91:1219–1223. doi: 10.1073/pnas.91.4.1219. [DOI] [PMC free article] [PubMed] [Google Scholar]
- 28.Erickson J C, Hollopeter G, Thomas S A, Froelick G J, Palmiter R D. J Neurosci. 1997;17:1271–1281. doi: 10.1523/JNEUROSCI.17-04-01271.1997. [DOI] [PMC free article] [PubMed] [Google Scholar]
- 29.Kobayashi H, Uchida Y, Ihara Y, Nakajima K, Kohsaka S, Miyatake T, Tsuji S. Mol Brain Res. 1993;19:188–194. doi: 10.1016/0169-328x(93)90025-k. [DOI] [PubMed] [Google Scholar]
- 30.Kennedy M C, Gan T, Antholine W E, Petering D H. Biochem Biophys Res Commun. 1993;196:632–635. doi: 10.1006/bbrc.1993.2296. [DOI] [PubMed] [Google Scholar]
- 31.Tamai K T, Gralla E B, Ellerby L M, Valentine J S, Thiele D J. Proc Natl Acad Sci USA. 1993;90:8013–8017. doi: 10.1073/pnas.90.17.8013. [DOI] [PMC free article] [PubMed] [Google Scholar]
- 32.Pereira B M, Chan P H, Weinstein P R, Fishman R A. Adv Neurol. 1990;52:97–103. [PubMed] [Google Scholar]
- 33.Schwarz M A, Lazo J S, Yalowich J C, Allen W P, Whitmore M, Bergonia H A, Tzeng E, Billiar T R, Robbins P D, Lancaster J R, Jr, et al. Proc Natl Acad Sci USA. 1995;92:4452–4456. doi: 10.1073/pnas.92.10.4452. [DOI] [PMC free article] [PubMed] [Google Scholar]
- 34.Iadecola C, Zhang F Y, Casey R, Nagayama M, Rose M E. J Neurosci. 1997;17:9157–9164. doi: 10.1523/JNEUROSCI.17-23-09157.1997. [DOI] [PMC free article] [PubMed] [Google Scholar]
- 35.Nishimura N, Nishimura H, Ghaffar A, Tohyama C. J Histochem Cytochem. 1992;40:309–315. doi: 10.1177/40.2.1552172. [DOI] [PubMed] [Google Scholar]
- 36.Yuguchi T, Kohmura E, Sakaki T, Nonaka M, Yamada K, Yamashita T, Kishiguchi T, Sakaguchi T, Hayakawa T. J Cereb Blood Flow Metab. 1997;17:745–752. doi: 10.1097/00004647-199707000-00004. [DOI] [PubMed] [Google Scholar]
- 37.Moseley M E, Kucharczyk J, Mintorovitch J, Cohen Y, Kurhanewicz J, Derugin N, Asgari H, Norman D. Am J Neuroradiol. 1990;11:423–429. [PMC free article] [PubMed] [Google Scholar]
- 38.Penkowa M, Carrasco J, Giralt M, Moos T, Hidalgo J. J Neurosci. 1999;19:2535–2545. doi: 10.1523/JNEUROSCI.19-07-02535.1999. [DOI] [PMC free article] [PubMed] [Google Scholar]
- 39.Mintorovitch J, Moseley M E, Chileuitt L, Shimizu H, Cohen Y, Weinstein P R. Magn Res Med. 1991;18:39–50. doi: 10.1002/mrm.1910180106. [DOI] [PubMed] [Google Scholar]
- 40.Aronowski J, Strong R, Grotta J C. J Cereb Blood Flow Metab. 1997;17:1048–1056. doi: 10.1097/00004647-199710000-00006. [DOI] [PubMed] [Google Scholar]
- 41.Beckman J S, Beckman T W, Chen J, Marshall P A, Freeman B A. Proc Natl Acad Sci USA. 1990;87:1620–1624. doi: 10.1073/pnas.87.4.1620. [DOI] [PMC free article] [PubMed] [Google Scholar]
- 42.Kang Y J, Li G Q, Saari J T. Am J Physiol. 1999;45:H993–H997. doi: 10.1152/ajpheart.1999.276.3.H993. [DOI] [PubMed] [Google Scholar]


