Abstract
A systematic screen termed the allelic message display (AMD) was developed for the hunting of imprinted genes. In AMD, differential display PCR is adopted to image allelic expression status of multiple polymorphic transcripts in two parental mouse strains, reciprocal F1 hybrids and pooled backcross progenies. From the displayed patterns, paternally and maternally expressed transcripts can be unequivocally identified. The effectiveness of AMD screening was clearly demonstrated by the identification of a paternally expressed gene Impact on mouse chromosome 18, the predicted product of which belongs to the YCR59c/yigZ hypothetical protein family composed of yeast and bacterial proteins with currently unknown function. In contrast with previous screening methods necessitating positional cloning efforts or generation of parthenogenetic embryos, this approach requires nothing particular but appropriately crossed mice and can be readily applied to any tissues at various developmental stages. Hence, AMD would considerably accelerate the identification of imprinted genes playing pivotal roles in mammalian development and the pathogenesis of various diseases.
Mammalian genomes contain a small number of imprinted genes that are specifically expressed when inherited from one parent but not from the other. Consequently, maternal and paternal genomes function unequally, and both are required for normal embryonic development in mammals (1). Nuclear transplantation studies (1) and gene inactivation experiments (2, 3) have confirmed the prediction that imprinted genes are involved in the control of intrauterine embryonic growth, although it appears unlikely that every imprinted gene has a similar function. Also, the presence of genes showing species-specific (4–6) and polymorphic (7, 8) imprinting makes a simplistic explanation for their biological roles difficult. On the mechanistic aspect of genomic imprinting, involvement of DNA methylation was clearly demonstrated by gene disruption experiments (9). The correlation between parent-of-origin-specific methylation and monoallelic expression was observed in various imprinted genes (10–12), although a discrepancy between the two was also reported (13, 14). Thus, despite the considerable achievements in recent studies focusing mainly on a few particular imprinted genes, why and how some mammalian genes are imprinted still remains largely elusive (15).
To elucidate the underlying molecular mechanisms and to examine several hypotheses proposed for genomic imprinting, it is obviously necessary to identify and characterize more imprinted genes. These efforts will also contribute to the identification of genes involved in various human diseases in which the effect of genomic imprinting is implicated. These include not only well-defined genetic disorders like Prader–Willi and Beckwith–Wiedemann syndromes but also unstable triplet repeat diseases, insulin-dependent diabetes mellitus, atopy, bipolar affective disorder, various malignant tumors, and so forth (12).
Currently, 14 genes are known to be imprinted in mouse (12). Most of them were examined and identified so, because they lie in the vicinity of known imprinted genes or in the so-called “imprinted regions” revealed genetically (16). However, there remain some imprinted regions to which no imprinted genes have yet been mapped. It is also conceivable that some imprinted genes are found outside the established imprinted regions. To isolate these genes, systematic screening, instead of the one-by-one candidate gene approach based on chromosomal location, will be necessary.
Here we report the development of a unique screening method using the message display PCR technique and the isolation of a novel imprinted gene Impact on mouse chromosome 18.
MATERIALS AND METHODS
Mouse Resources.
The JF1/MsfB6C3F1 (JF) mice were obtained from the National Institute of Genetics (Mishima, Japan). The reciprocal F1 hybrid mice, (B6 × JF) F1 and (JF × B6) F1, were bred in the Animal Center at the Institute of Medical Science, University of Tokyo. The [JF × (B6 × JF) F1] backcross mice were a generous gift from H. Sasaki and M. Zubair (Kyushu University).
Allelic Message Display (AMD).
Total RNAs extracted from tissues of each mouse strain were subjected to message display PCR according to the protocol S described previously (17, 18). In brief, total RNAs (2.5 μg) were reverse-transcribed with SuperScript II reverse transcriptase (BRL) and fluorescein-labeled GT15C or GT15G, and the cDNA equivalent to 50 ng of RNA was subjected to PCR in 20 μl of GeneTaq buffer (Nippon Gene, Toyama, Japan) containing 0.5 μM anchor primer, 0.5 μM arbitrary primer, 50 μM each dNTP and 1 unit of GeneTaq DNA polymerase (Nippon Gene). In this screening, 64 semi-arbitrary primers, namely GGGGWXYZCG (W, X, Y = purine or pyrimidine; Z = one of A, C, G, or T) and GGNXYZGATC (X = purine or pyrimidine; Y or Z = one of A, C, G, or T) were used in combination with the two anchor primers. The thermal cycling parameters were as follows: (94°C × 3 min + 40°C × 5 min + 72°C × 5 min) × 1 cycle + (95°C × 15 sec + 40°C × 2 min + 72°C × 1 min) × 25 cycles + 72°C × 5 min. For initial screening, PCR products were analyzed on a modified Hitachi SQ-3000 DNA sequencer (Hitachi, Tokyo) to ensure high-speed and semi-automated screening (17–19). For the reconfirmation and excision of the bands of interest, Vistra FluorImager SI (Molecular Dynamics) was used. Postdisplay steps for the cloning of right product were performed according to the procedure described (17, 18).
Isolation of Full-Length cDNA.
Full-length cDNA was obtained by thermal RACE (Rapid Amplification of cDNA Ends) (20). To eliminate the effect of misincorporation during PCR, reverse transcriptase–PCR product for Impact transcript was subjected to direct cycle sequencing on both strands.
Expression Analysis.
Tissue distribution of Impact transcript was examined by Northern blot hybridization using filters containing 2 μg of poly(A)+ RNAs isolated from various adult tissues and 7–17 day-old embryos (CLONTECH). In situ hybridization with brain tissues was performed with 35S-labeled antisense and sense RNA probes generated by T7 RNA polymerase, as described (21).
Restriction Fragment Length Polymorphism (RFLP) Analysis.
The fragment containing the polymorphic Tsp509 I site was amplified from genomic or cDNA using primers ACGTTTCCCCATTTTACAAG and CTCTACATATGATTTTCTCTAC with the following thermal cycling: 94°C × 5 min + (94°C × 15 sec + 55°C × 1 min + 72°C × 1 min) × 30 cycles + 72°C × 10 min. The amplified products were digested with Tsp509 I (New England Biolabs) at 65°C for 1 hr, subjected to 8% PAGE and stained with SYBR green I (Molecular Probes).
Fluorescence in Situ Hybridization.
The full-length cDNA for Impact was biotinylated by nick-translation and hybridized to R-banded chromosomes from cultured splenocytes of male mice (C57BL/6J), prepared as described (22). Following the hybridization, washing, and blocking, the signals were amplified using rabbit anti-biotin (Enzo Biochem), fluorescein-labeled goat anti-rabbit IgG (Enzo Biochem), and Cy2-labeled donkey anti-goat IgG (Amersham) as described (23). The chromosome identification based on banding patterns was verified by stripping of the probes followed by the sequential hybridization with a mouse chromosome 18-specific painting probe (Cambio, Cambridge, U.K.) onto the same spread.
RESULTS
Principle of AMD.
Differential display (DD) is a PCR-based technique used to simultaneously visualize multiple transcripts as short cDNA fragments derived from 3′-end portions of arbitrarily selected mRNAs (24). As described previously (25), 3′-end regions of cDNAs provide a rich source for polymorphisms among different mouse strains or (sub)species. Accordingly, DD is expected to display polymorphic differences as well as differentially expressed messages when used to compare samples with different genetic backgrounds. In fact, we found 5–10 polymorphic bands per reaction when comparing RNAs from a conventional laboratory mouse strain (C57BL/6) and an inbred line derived from Mus musculus molossinus as described previously (17). We detected two types of polymorphism, presence/absence and length polymorphisms, the former and latter of which are due to the polymorphisms at, and the insertion/deletion between, the binding sites for PCR primers, respectively (17).
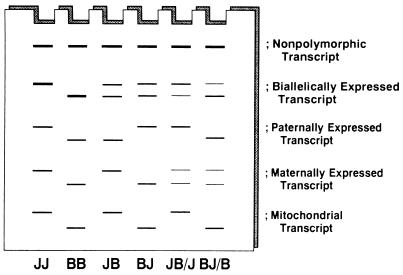
Based on these observations, we developed a novel screening method for imprinted genes designated as “Allelic Message Display (AMD).” In contrast with conventional DD analysis that compares RNAs under different anatomical or physiological conditions on the same genetic background, AMD uses RNAs from identical cells or tissues under the same physiological conditions but on different genetic backgrounds, thereby eliminating effects of differential gene expression to selectively detect polymorphic differences. AMD analysis of two parental strains and reciprocal F1 hybrids can visualize the expression status of paternally and maternally inherited alleles of polymorphic transcripts in F1 animals (Fig. 1). Whereas polymorphic cDNA bands expressed biallelically are displayed in both F1 hybrids, those expressed maternally or paternally should appear only in either one, but not both, of the reciprocal F1 hybrids (Fig. 1, four leftmost lanes). One can thus search transcripts showing parent-of-origin-dependent expression patterns.
Figure 1.
Principle of AMD. Total RNAs from four different mice, JF (JJ), B6 (BB), (JF × B6) F1 (JB), and (B6 × JF) F1 (BJ), are subjected to message display PCR to simultaneously amplify 3′ portions of anonymous cDNAs. Because some cDNAs are amplified from one species but not from the other due to polymorphisms at the priming sites for the arbitrary or anchor primers used, one can follow the inheritance of each polymorphic band. The insertion/deletion polymorphisms between the two priming sites result in length polymorphisms, which are similarly displayed and can be analyzed on AMD gel. While biallelically expressed transcripts appear in both F1 hybrids, those with monoallelic expression are displayed in one, but not the other, of the reciprocal F1 hybrids. To distinguish maternally expressed transcripts from mitochondrial ones, RNA samples from pooled backcross progenies, such as [(JF × B6) F1 × JF] and [(B6 × JF) F1 × B6] mice indicated as JB/J and BJ/B, respectively, should be included in the assay.
It should be noted that the AMD pattern in F1 hybrids cannot discriminate between maternally expressed transcripts and mitochondrial ones. To solve the problem, additional RNAs from two pooled backcross progenies have to be analyzed (Fig. 1, two rightmost lanes). The bands derived from maternally expressed genes would appear in both of the backcross pools due to the erasure and resetting of imprinting during the transmission to the next generation. (While each backcross progeny expresses either of the two alleles, both would be detected when they are analyzed en masse.) On the other hand, cDNA bands derived from mitochondrial transcripts would be displayed in only one, but not the other, of the pools due to its maternal inheritance. One can thus distinguish the two by examining the pooled backcross progenies (Fig. 1). Also, in male animals, polymorphic transcripts encoded on X and Y chromosomes show AMD patterns similar to those of maternally and paternally expressed messages, respectively. However, they can be discriminated from imprinted ones by simply examining their expression in female animals. Therefore, bearing these points in mind, one can readily use AMD to screen for both paternally and maternally expressed messages in any tissue at various developmental stages.
Screening for Monoallelically Expressed cDNAs.
To search novel imprinted genes by AMD, we bred four different mice, JF1/MsfB6C3F1 (JF, an inbred line derived from Mus musculus molossinus), C57BL/6J (B6), (JF × B6) F1 and (B6 × JF) F1 (Fig. 1). Total RNAs were prepared from various tissues of age- and sex-matched animals. In this study, we used whole-brain RNAs for AMD screening on the fluorescent DD (FDD) system, a high throughput fluorescence-based DD system, for its unsurpassed speed and high reliability (17–19).
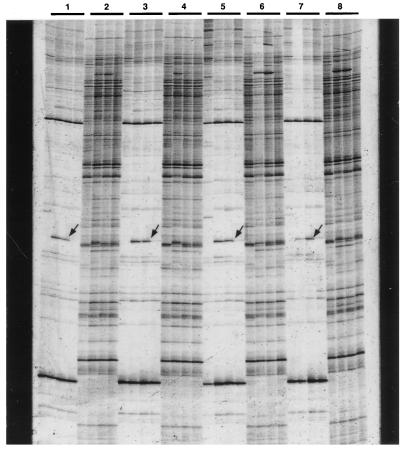
Each combination of arbitrary and anchor primers provides a unique fingerprint composed of ≈100 bands, among which 5–10 were polymorphic between B6 and JF, as described previously (17). In our initial screening with 128 primer combinations, we identified three bands displaying reproducibly paternal expression patterns. For instance, a B6-specific allele shown by the arrow in Fig. 2 was expressed in (JF × B6) F1 but not in (B6 × JF) F1, which inherited the allele paternally and maternally, respectively (Fig. 2). A number of cDNA bands with maternal expression pattern were not pursued further in this study, because maternally expressed transcripts have to be discriminated from mitochondrial ones using the pooled RNAs from backcross progenies, as discussed above (Fig. 1). Among the three bands with paternal expression pattern, we further characterized a band termed MIG26 (Fig. 2).
Figure 2.
Identification of a cDNA band displaying a paternal expression pattern. Typical AMD patterns of brain RNAs from four different mice, JF, B6, (JF × B6) F1, and (B6 × JF) F1 (from left to right in each quartet), are shown. Because different primer combinations are used in odd- and even-numbered quartets, two unique fingerprints were alternately displayed. The band indicated by the arrow in each odd-numbered quartet is a B6-specific allele termed MIG26 displaying paternal expression pattern that was detected using GT15G and GGNYGCGATC. Note that each quartet represents the pattern from an independent set of animals, thereby confirming the reproducibility of the expression pattern of MIG26. [The very faint band observed in some (B6 × JF) F1 animals may be a fragment comigrating with, but distinct from, MIG26, since the results shown in Fig. 5 indicated that the possibility of leaky imprinting is highly unlikely.]
Predicted Product and Expression of Impact.
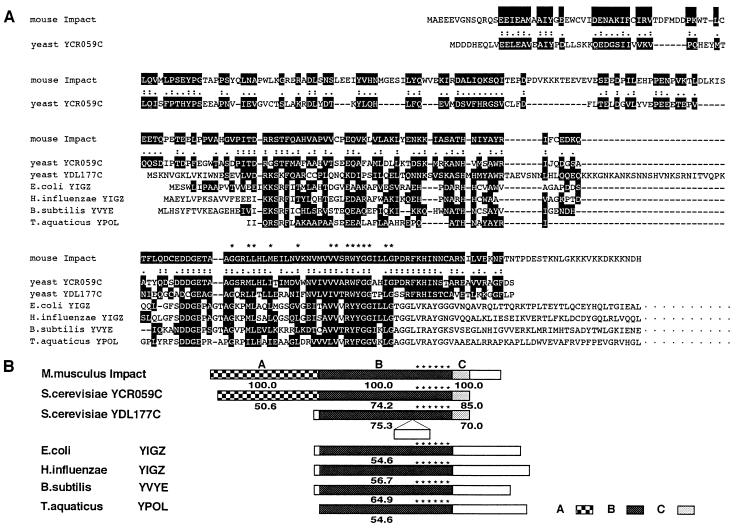
The band MIG26 was recovered from AMD gel and used to obtain a cognate cDNA 3.4 kb long, consistent with the size of its intact transcript revealed by Northern blot hybridization (see below). The isolated cDNA contains an ORF 954 bp long. A database search with its translated product (318 aa) revealed a significant homology to a budding yeast hypothetical protein encoded by a putative ORF, YCR059C, which was identified by the genomic sequencing of chromosome III (26). The predicted products of both ORFs are homologous with each other throughout the frames, in particular, in their C-terminal halves (Fig. 3). Notably, the region designated as B in Fig. 3B also showed remarkable similarity to another hypothetical protein in yeast, as well as those from various bacteria including Escherichia coli, Haemophilus influenzae, Bacillus subtilis and Thermus aquaticus (Fig. 3), thereby representing a prokaryote–eukaryote “ancient conserved region” (27). These proteins are postulated to comprise a YCR59c/yigZ hypothetical protein family with totally unknown function (28). Each member of this family shares a characteristic consensus motif, G-x(2)-[LIMV](2)-x(2)-[LIMV]-x(4)-[LIMV]-x(5)-[LIMV](2)-x-R-[FYW](2)-G-G-x(2)-[LIMV]-G (28). The predicted product of mouse gene contains an exact copy of this motif, thus providing this family with the first member from multicellular organisms. Because the mouse gene is imprinted (see below) and encodes a protein with an ancient conserved region, we named it as Impact after its “ imprinted and ancient” nature.
Figure 3.
Structure of predicted Impact gene product. (A) Amino acid homology between the predicted Impact gene product (GenBank no. D87973) and other hypothetical proteins, including Saccharomyces cerevisiae YCR059C (Swiss-Prot no. P25637), S. cerevisiae YDL177C (Protein Identification Resource no. S61035), E. coli YIGZ (Swiss-Prot no. P27862), H. influenzae YIGZ (Swiss-Prot no. P44842), B. subtilis YVYE (Swiss-Prot no. P32437), and T. aquaticus YPOL (Swiss-Prot no. P32438). Amino acid residues similarly conserved between putative Impact product and other hypothetical proteins are shaded. (B) Schematic presentation of members of the YCR59c/yigZ hypothetical protein family (PROSITE no. PS00910). The region B is the core region that is highly conserved among mouse, yeast, and various bacterial hypothetical proteins, and contains a characteristic signature G-x(2)-[LIMV](2)-x(2)-[LIMV]-x(4)-[LIMV]-x(5)-[LIMV](2)-x-R-[FYW(2)-G-G-x(2)-[LIMV]-G (PROSITE no. PDOC00707) shown by the asterisks. Regions A and C are common only between mouse and yeast hypothetical proteins. The number below each box is the similarity expressed in percentile to the corresponding region of putative Impact product.
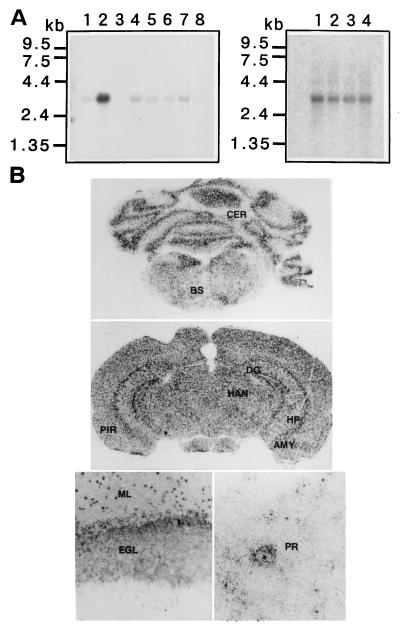
Northern blot hybridization with Impact probe detected an RNA of ≈3.4 kb expressed preferentially in brain and less abundantly in all other tissues examined except spleen (Fig. 4A Left). The RNA was also detected in embryos at days 7, 11, 15, and 17 (Fig. 4A Right). Because its prominent expression in brain was evident, in situ hybridization was performed with adult brain tissue. Signals were detected in regions rich in neurons (Fig. 4B), and microscopic examination revealed the predominant presence of Impact transcripts in neurons, but not in glial cells (Fig. 4B).
Figure 4.
Tissue distribution of Impact transcript. (A) Northern blot hybridization using RNAs from various adult tissues (Left) Lanes: 1, heart; 2, brain; 3, spleen; 4, lung; 5, liver; 6, skeletal muscle; 7, kidney; and 8, testis, and embryos (Right) Lanes: 1, 7 days; 2, 11 days; 3, 15 days; and 4, 17 days. (B) In situ hybridization. Signals were found on cerebellar cortex (CER) and brain stem (BS) (Top); hippocampal cortex (HP), dentate gyrus (DG), amygdaloid nucleus (AMY), piriform cortex (PIR), habenular nuclei (HN), and cerebral cortex (Middle); the cerebellar granular cell layer (Bottom Left) and cerebellar Purkinje cells (Bottom Right). ML, molecular layer; EGL, external granular cell layer; PR, Purkinje cell.
Paternal Expression of Impact.
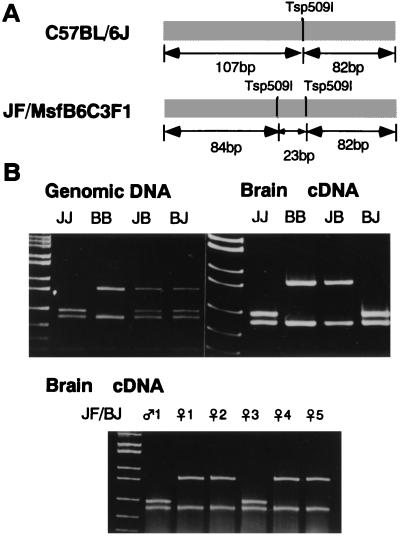
Comparison of the 3′-untranslated region of Impact between B6 and JF revealed two polymorphic sites. One was exactly at the priming site for the arbitrary primer used to detect the band MIG26, as expected from the rationale of AMD (Fig. 1). The other site was at a Tsp509 I site (AATT) on JF allele, that was lost from B6 allele due to a single base substitution (AGTT). We thus designed a PCR–RFLP assay to discriminate each allele using this polymorphic site (Fig. 5A). When genomic DNAs were subjected to this assay, both reciprocal F1 hybrids showed the heterozygous patterns, including both alleles (Fig. 5B). In contrast, the same assay revealed that brain cDNAs from (JF × B6) F1 and (B6 × JF) F1 contained only B6 allele and JF allele, respectively (Fig. 5B). These results indicate that Impact is expressed exclusively from the paternal allele in brain. The same assay also showed that Impact is expressed, albeit less abundantly, from the paternal allele in all the tissues examined, including kidney, lung, liver, skeletal muscle, uterus, and duodenum (not shown).
Figure 5.
Paternal allele-specific expression of Impact. (A) Tsp509 I sites in the 189-bp fragment amplified from the 3′-untranslated region of Impact. While B6 allele has a single unique Tsp509 I site, JF allele harbors an additional site. (B) PCR–RFLP. PCR products from genomic DNAs (Upper Left) and brain cDNAs (Upper Right) of JF (JJ), B6 (BB), (JF × B6) F1 (JB), and (B6 × JF) F1 (BJ) (from left to right) were digested with Tsp509 I and subjected to 8% PAGE. RT-PCR–RFLP assay of brain cDNA from the [JF × (B6 × JF) F1] backcross mice was shown (Lower). pBR322/MspI fragments were used as a size standard. Note that the smallest fragment from JF allele (23 bp) was not resolved on the gel used.
We next tested the allelic expression status of Impact in [JF × (B6 × JF) F1] backcross progenies. As shown in Fig. 5B (Bottom), some progenies expressed the paternally inherited B6 allele, which had been imprinted in their father. This demonstrates the reversibility of allele-specific suppression of Impact expression during transmission to the next generation, as expected from an epigenetic character of genomic imprinting.
Chromosomal Localization of Impact.
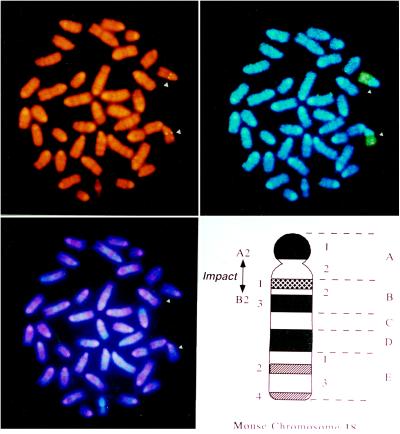
The chromosomal loci of imprinted genes are of particular interest, because of the so-called imprinted regions revealed by genetic experiments (16). The locus of Impact was determined as chromosome 18 A2-B2 by fluorescence in situ hybridization using its cDNA as a probe (Fig. 6). The Impact is the first imprinted gene mapped to this chromosome.
Figure 6.
Chromosomal localization of Impact revealed by fluorescence in situ hybridization. (Upper Left) Metaphase plate showing propidium iodide-stained chromosomes and hybridization signals. (Upper Right) G-banded chromosomes of the same cell. (Lower Left) The same cell rehybridized with a mouse chromosome 18-specific painting probe (Cambio). (Lower Right) Idiogram of mouse chromosome 18 illustrating the location of Impact at the region of 18A2-B2.
DISCUSSION
To date, two systematic screening methods have been developed for imprinted genes. The first one is RLGS-M (restriction landmark genomic scanning using methylation sensitive enzymes), which identifies restriction sites showing parent-of-origin-specific methylation by high resolution two-dimensional gel electrophoresis (29, 30). While RLGS-M can detect hundreds of polymorphic sites per gel to ensure a high throughput screening, this approach inevitably requires considerable effort for positional cloning of imprinted gene(s) around the identified methylation sites. Also, due to its principle, dissociation between methylation imprint and allelic expression, as found in human IGF2R locus (13, 14), may mislead the screening by RLGS-M.
The other method is cDNA subtraction between fertilized and parthenogenetic (or androgenetic) embryos (31). This method not only directly provides candidate cDNA clones but also has a unique advantage in that it does not depend on sequence polymorphisms at the stage of screening. It, however, requires rather special starting materials (parthenogenetic or androgenetic embryos) and is applicable only to genes expressed in such early embryonic stages; genes whose imprinting is established in later stages or only in particular tissues would escape the screening.
Here we developed an alternative screening method designated as AMD (Fig. 1). With two parental mouse strains and reciprocal F1 hybrids between them, AMD can be readily applied to any tissue at various developmental stages to obtain paternally expressed genes as candidate cDNA fragments. The addition of pooled samples from two different backcross progenies to the screening would identify maternally expressed genes as well (Fig. 1). While AMD screening depends on sequence polymorphisms, it can detect a much wider range of sequence variation than methods using restriction enzymes, because arbitrary primers can recognize any polymorphisms, including those not affecting restriction enzyme sites, and the number of arbitrary primers are virtually unlimited.
On the other hand, a considerable number of primer combinations have to be tested to statistically cover the complex transcript population in mammalian cells or tissues, since the number of polymorphisms detected is limited to 200–400 per gel (5–10 polymorphisms per lane × ≈40 lanes per gel), although it may be increased by the use of single-strand conformation polymorphism or other gel systems capable of detecting internal base substitutions. It should also be noted that the protocol for message display PCR should be of high reliability and reproducibility for successful AMD screening. To meet these requirements, we used the FDD system, a high-throughput fluorescence-based DD system established in our laboratory, which allows one to scan more than 10,000 cDNA species per day (17–19). More than 95% of the bands are reproducibly displayed by our FDD protocol, presumably due to the modified anchor primers with much higher priming efficiency and more standard PCR condition than those used in the original DD protocol (17–19). Expression patterns of cognate transcripts have been confirmed in every case of more than 50 experiments using the FDD protocol and our postdisplay cloning procedure (17–19, and unpublished results). Accordingly, the reproducibility of AMD patterns using the FDD protocol was of enough satisfaction. We occasionally encountered odd bands, which when found missing in particular F1 individuals caused apparent monoallelic expression patterns. These oddities were, however, reproducibly displayed in some particular animals but not in others. We thus attribute these odd bands to variable gene expression among individuals, presumably evoked by some unknown factors that we had failed to control. Since these individual differences were, in practice, more prominent and problematic than the fluctuation of FDD reaction, age- and sex-matched mice carefully bred under a well-controlled environment should be used for AMD. Also, the use of pooled animals was effective in minimizing the effects of such odd transcripts. The feasibility of the AMD approach was clearly demonstrated by the isolation of Impact as described above. While we have not yet applied AMD to the search of maternally expressed genes, it can be, in principle, achieved by including backcross pools in the screening (Fig. 1). We thus believe that AMD, as well as the previous two methods, will contribute to the field of imprinting research through the identification of more imprinted genes.
Apart from the search for imprinted genes, AMD would have other potential applications. Because some genes found in immune and central nervous systems are known to show nonimprinted monoallelic expression patterns (32), it may be possible to search such genes using modified AMD. Also, AMD analysis of each backcross progeny will reveal the strain distribution patterns for multiple transcripts simultaneously. It is thus, in principle, possible to genetically map expressed sequences to genome in a multiplexed mode by simply analyzing the high quality AMD patterns from carefully maintained individuals, and this strategy can be applied to any species where inter(sub)specific backcross experiments are plausible.
The imprinted gene Impact identified in this study seems to encode a protein of phylogenetically old origin, judging from the presence of a homologous protein in yeast as well as a domain highly conserved not only in yeast but also in various prokaryotes. Despite these structural features, no clues are currently available for assessing its function. In bacterial genomes, functionally related genes are often encoded on a single operon, and one may obtain a clue to the function of a novel gene if it is mapped to an operon containing a well-characterized gene. We examined the data and literature on genomic organization of bacterial genes showing similarity to Impact, but failed to find any convincing evidence for their involvement in operons (not shown). We thus cannot predict their functions from genomic or structural data. Gene inactivation experiments in mouse, as well as in yeast or other microbes, where various excellent molecular genetic techniques are available, will be necessary to clarify their biological and biochemical functions.
Impact is the first imprinted gene mapped to mouse chromosome 18. The presence of an imprinted gene(s) on this chromosome was suggested by a recent study using mice carrying a Robertsonian translocation chromosome, which revealed a deficiency of paternal chromosome 18 uniparental disomic embryos along with a higher than normal rate of developmental retardation at 8.5 days post coitum (33). Because some imprinted genes showed close physical clustering, it is conceivable that Impact provides a lead to the putative imprinted region on this chromosome containing Impact as well as other imprinted genes, some of which may be responsible for the developmental defects observed in the uniparental disomic embryos. Hence, the identification and characterization of genes adjacent to Impact would be worth further study.
Acknowledgments
We thank H. Sasaki and M. Zubair for helpful discussion and a generous gift of backcross mice. We also appreciate P. Slonimski, A. Goffeau, and F. Kunst for their discussion on the hypothetical proteins in yeast and B. subtilis. This work was partly supported by a Grant-in-Aid for Scientific Research on Priority Areas and Grants-in-Aid for Scientific Research from The Ministry of Education, Science, Sports and Culture, Japan, and a research grant from the Japan Society for the Promotion of Science (JSPS). Y.H. is a recipient of a Research Fellowship grant from JSPS for young scientists.
Footnotes
This paper was submitted directly (Track II) to the Proceedings Office.
Abbreviations: AMD, allelic message display; RFLP, restriction fragment length polymorphism; DD, differential display; FDD, fluorescent DD.
Data deposition: The sequence reported in this paper has been deposited in the GenBank database (accession no. D87973).
References
- 1.Solter D. Annu Rev Genet. 1988;22:127–146. doi: 10.1146/annurev.ge.22.120188.001015. [DOI] [PubMed] [Google Scholar]
- 2.Wang Z-Q, Fung M R, Barlow D P, Wagner E F. Nature (London) 1994;372:464–467. doi: 10.1038/372464a0. [DOI] [PubMed] [Google Scholar]
- 3.Leighton P A, Ingram R S, Eggenschwiler J, Efstratiadis A, Tilghman S M. Nature (London) 1995;375:34–39. doi: 10.1038/375034a0. [DOI] [PubMed] [Google Scholar]
- 4.Kalscheuer V M, Mariman E M, Schepens M T, Rehder H, Ropers H-H. Nat Genet. 1993;5:74–78. doi: 10.1038/ng0993-74. [DOI] [PubMed] [Google Scholar]
- 5.Pearsall R S, Shibata H, Brozowska A, Yoshino K, Okuda K, deJong P J, Plass C, Chapman V M, Hayashizaki Y, Held W A. Biochem Biophys Res Commun. 1996;222:171–177. doi: 10.1006/bbrc.1996.0716. [DOI] [PubMed] [Google Scholar]
- 6.Riesewijk A, Schepens M T, Mariman E M, Ropers H-H, Kalscheuer V M. Genomics. 1996;35:380–382. doi: 10.1006/geno.1996.0372. [DOI] [PubMed] [Google Scholar]
- 7.Xu Y, Goodyer C G, Deal C, Polychronakos C. Biochem Biophys Res Commun. 1993;197:747–754. doi: 10.1006/bbrc.1993.2542. [DOI] [PubMed] [Google Scholar]
- 8.Jinno Y, Yun K, Nishiwaki K, Kubota T, Ogawa O, Reeve A E, Niikawa N. Nat Genet. 1994;6:305–309. doi: 10.1038/ng0394-305. [DOI] [PubMed] [Google Scholar]
- 9.Li E, Beard C, Jaenisch R. Nature (London) 1993;366:362–365. doi: 10.1038/366362a0. [DOI] [PubMed] [Google Scholar]
- 10.Razin A, Ceder H. Cell. 1994;77:473–476. doi: 10.1016/0092-8674(94)90208-9. [DOI] [PubMed] [Google Scholar]
- 11.John R M, Surani M A. Curr Opin Cell Biol. 1996;8:348–353. doi: 10.1016/s0955-0674(96)80008-1. [DOI] [PubMed] [Google Scholar]
- 12.Nakao M, Sasaki H. J Biochem. 1996;120:467–473. doi: 10.1093/oxfordjournals.jbchem.a021434. [DOI] [PubMed] [Google Scholar]
- 13.Smrzka O W, Fae I, Stoger R, Kurzbauer R, Fischer G F, Henn T, Weith A, Barlow D P. Hum Mol Genet. 1995;4:1945–1952. doi: 10.1093/hmg/4.10.1945. [DOI] [PubMed] [Google Scholar]
- 14.Riesewijk A, Schepens M T, Welch T R, van den Berg-Loonen E M, Mariman E M, Ropers H-H, Kalscheuer V M. Genomics. 1996;31:158–166. doi: 10.1006/geno.1996.0027. [DOI] [PubMed] [Google Scholar]
- 15.Barlow D P. Science. 1995;270:1610–1613. doi: 10.1126/science.270.5242.1610. [DOI] [PubMed] [Google Scholar]
- 16.Beechey C V, Cattanach B M. Mouse Genome. 1996;94:96–99. [Google Scholar]
- 17.Ito T, Kito K, Adati N, Mitsui Y, Hagiwara H, Sakaki Y. FEBS Lett. 1994;351:231–236. doi: 10.1016/0014-5793(94)00867-1. [DOI] [PubMed] [Google Scholar]
- 18.Ito T, Sakaki Y. Methods Mol Genet. 1996;8:229–245. [Google Scholar]
- 19.Kito K, Ito T, Sakaki Y. Gene. 1997;184:73–81. doi: 10.1016/s0378-1119(96)00577-x. [DOI] [PubMed] [Google Scholar]
- 20.Frohman M A. Methods Enzymol. 1993;218:340–356. doi: 10.1016/0076-6879(93)18026-9. [DOI] [PubMed] [Google Scholar]
- 21.Suzuki T, Nishiyama K, Murayama S, Yamamoto A, Sato S, Kanazawa I, Sakaki Y. Biochem Biophys Res Commun. 1996;219:708–713. doi: 10.1006/bbrc.1996.0299. [DOI] [PubMed] [Google Scholar]
- 22.Matsuda Y, Harada Y N, Natsuume-Sakai S, Lee K, Shiomi T, Chapman V M. Cytogenet Cell Genet. 1992;61:282–285. doi: 10.1159/000133423. [DOI] [PubMed] [Google Scholar]
- 23.Hirai M, Kusuda J, Hashimoto K. Genomics. 1996;34:263–265. doi: 10.1006/geno.1996.0283. [DOI] [PubMed] [Google Scholar]
- 24.Liang P, Pardee A B. Science. 1992;257:967–971. doi: 10.1126/science.1354393. [DOI] [PubMed] [Google Scholar]
- 25.Takahashi N, Ko M S H. Genomics. 1993;16:161–168. doi: 10.1006/geno.1993.1153. [DOI] [PubMed] [Google Scholar]
- 26.Oliver S G, van der Aart Q J M, Agostoni-Carabone M L, Aigle M, Alberghina L, et al. Nature (London) 1992;357:38–46. doi: 10.1038/357038a0. [DOI] [PubMed] [Google Scholar]
- 27.Green P, Lipman D, Hillier L, Waterston R, States D, Claverie J-M. Science. 1993;259:1711–1716. doi: 10.1126/science.8456298. [DOI] [PubMed] [Google Scholar]
- 28.Koonin E V, Bork P, Sander C. EMBO J. 1994;13:493–503. doi: 10.1002/j.1460-2075.1994.tb06287.x. [DOI] [PMC free article] [PubMed] [Google Scholar]
- 29.Hatada I, Sugama T, Mukai T. Nucleic Acids Res. 1993;21:5577–5582. doi: 10.1093/nar/21.24.5577. [DOI] [PMC free article] [PubMed] [Google Scholar]
- 30.Hayashizaki Y, Shibata H, Hirotsune S, Sugino H, Okazaki Y, et al. Nat Genet. 1994;6:33–40. doi: 10.1038/ng0194-33. [DOI] [PubMed] [Google Scholar]
- 31.Kaneko-Ishino T, Kuroiwa Y, Miyoshi N, Kohda T, Suzuki R, Yokoyama M, Viville S, Barton S C, Ishino F, Surani M A. Nat Genet. 1995;11:52–59. doi: 10.1038/ng0995-52. [DOI] [PubMed] [Google Scholar]
- 32.Watanabe D, Barlow D P. Genes Cells. 1996;1:795–802. doi: 10.1046/j.1365-2443.1996.d01-276.x. [DOI] [PubMed] [Google Scholar]
- 33.Oakey R J, Matterson P G, Litwin S, Tilghman S M, Nussbaum R L. Genetics. 1995;141:667–674. doi: 10.1093/genetics/141.2.667. [DOI] [PMC free article] [PubMed] [Google Scholar]


