Abstract
Currently, there is a limited understanding of the factors that influence the localization and density of individual synapses in the central nervous system. Here we have studied the effects of activity on synapse formation between hippocampal dentate granule cells and CA3 pyramidal neurons in culture, taking advantage of FM1–43 as a fluorescent marker of synaptic boutons. We observed an early tendency for synapses to group together, quickly followed by the appearance of synaptic clusters on dendritic processes. These events were strongly influenced by N-methyl-d-aspartic acid receptor- and cyclic AMP-dependent signaling. The microstructure and localization of the synaptic clusters resembled that found in hippocampus, at mossy fiber synapses of stratum lucidum. Activity-dependent clustering of synapses represents a means for synaptic targeting that might contribute to synaptic organization in the brain.
The development of synaptic connectivity in the nervous system has been extensively investigated in excellent model systems, such as the visual system and the neuromuscular junction (1–3). This work has helped clarify the important roles of chemical cues (4) and neuronal activity (5–7) in shaping synaptic connectivity. The studies in thalamus and visual cortex have been invaluable in detailing how the pattern of axonal routing and branching might be regulated (5–8). On the other hand, research at the neuromuscular junction has provided information about single nerve terminals and the clearest understanding of the rules governing elimination of synaptic connections (9). Although each of these experimental preparations has its own advantages, it would clearly be desirable to be able to study the patterning of synaptic connectivity between central neurons at the level of individual synapses.
Fluorescent markers of synaptic vesicle recycling such as FM1–43 (10, 11) can be used to monitor the spatial organization of functional presynaptic terminals as well as their kinetic properties (12–15). Although so far this approach has not been usable in intact brain tissue, it has proven very effective in dissociated neuronal cell cultures. We have taken advantage of the FM1–43 approach to study factors that influence early synaptic organization in cultures of hippocampal neurons. We focused on cultures obtained from dentate gyrus (DG)–CA3 regions of neonatal rat hippocampus, where mossy fiber synapses connect dentate granule cells and CA3 pyramidal neurons. Dissociated DG-CA3 cultures preserve key electrophysiological properties of these connections (16–18), including non-associative, cAMP-dependent long-term plasticity (19, 20). Spatial organization of these in vitro connections, on the other hand, has not been investigated in detail. Mossy fiber synapses are of particular interest in terms of their anatomical organization because they show great convergence and are spatially restricted to the proximal dendrites of CA3 neurons, forming a distinct layer known as stratum lucidum (21–26). We asked whether certain aspects of these mossy fiber connections could be reconstituted in cell culture, thus enabling a detailed investigation of cellular events that affect preferential targeting of synapses to certain subcellular regions.
Materials and Methods
Cell Culture.
CA3-dentate gyrus regions were dissected from hippocampi of 1- to 2-day-old Sprague–Dawley rats. Neurons were dissociated by trypsin treatment (5 mg/ml for 10 min at 37°C), were triturated with a siliconized Pasteur pipette, and then were plated onto 12-mm coverslips coated with Matrigel. Typical plating density was one CA3-dentate gyrus per three coverslips. Two- or four-fold dilution of this initial plating density, short of compromising neuronal survival, resulted in a <30% decrease in number of detectable synaptic clusters, without significant decrease in their area at 10 days in vitro (d.i.v.) (data not shown). Culture media consisted of minimal essential media, 5 g/liter glucose, 0.1 g/liter transferrin, 0.25 g/liter insulin, 0.3 g/liter glutamine, 5–10% heat-inactivated FCS, 2% B-27 supplement, and 2–4 μM cytosine arabinoside. Cultures were maintained at 37°C in a humidified incubator gassed with 95% air and 5% CO2.
Pharmacological Treatments.
All pharmacological treatments were carried out with parallel drug-free vehicle controls on at least three culture batches for each condition (except KT 5720 treatment, which was partly redundant with Rp-cAMPS). In a given culture batch, 6–12 coverslips were subjected to pharmacological treatment. Before detailed analysis (typically one to two representative coverslips per batch), homogeneity of the effect over all coverslips in a batch was visually verified. None of the described treatments caused significant differences in density of cells (at 10 d.i.v., expressed as number of neurons/0.1 mm2: control, 42.7 ± 3.8; 2-amino-5-phophonopentanoic acid (l-AP5), 49.4 ± 4.1; tetrodotoxin (TTX), 45.5 ± 4.7; Rp-cAMPS, 41.9 ± 3.6). CA1-CA3 cultures had a density of 20.5 ± 1.3 cells per 0.1 mm2 at 17 d.i.v. Results of pharmacological interventions were examined at least 2 days later, because of the independent observation that gentle perturbation of culture medium once every 24 hours on the 7th and 8th days in vitro disrupted the formation of synaptic clusters on 9 d.i.v. The formation of synaptic clusters resumed after 10 d.i.v. The perturbation consisted of twice aspirating and releasing 500 μl of medium from a single well containing 1 ml of fluid, without diluting the culture medium with fresh solution. It is interesting to note that this result may imply the involvement of a standing gradient of a diffusible substance in formation of synaptic clusters.
Fluorescence Imaging.
Synaptic boutons were loaded with FM1–43 (10 μM) or FM4–64 (16 μM). Dye uptake was induced by exposure to a Tyrode’s solution containing 45 mM K+ and 2 mM Ca2+ for 90 s at room temperature, a strong stimulus for dye uptake. Boutons were visualized after 15 min of perfusion with dye-free Tyrode solution. For fluorescence imaging, we used a Nikon 40×, 1.3 numerical aperture oil immersion objective. FM 1–43 [and enhanced green fluorescent protein (GFP)] was excited at 480 ± 20 nm [505 DCLP (DiChroic Long Pass), 535 ± 25 BP (Band Pass)] whereas FM 4–64 was excited at 560 ± 27 nm (595 DCLP, 645 ± 37 BP), and images were acquired with a SIT camera (Dage–MTI, Michigan City, IN). Analysis of acquired image frames (640 × 480 pixels, 6,300 μm2, 18 pseudo-random frames per coverslip) was performed by using scion image PC software (Meyer Instruments, Houston, TX). Synaptic areas were calculated by normalization of area that was stained with FM1–43 in 18 regions with respect to total area analyzed (typically 18 × 6,300 μm2). Areas with no nonspecific FM1–43 staining were chosen for analysis; regions with nondestainable (presumably nonsynaptic) staining were discarded.
To visualize the Zn2+ content of synaptic boutons, cultures were incubated in a Tyrode solution with 1:1,000 dilution of TSQ (Molecular Probes) stock [1.5% solution (wt/vol) in EtOH] for 2–10 min, a protocol modified from the technique of Frederickson et al. (34). Staining was detected by a DAPI/Hoechst/AMCA filter set (D360 ± 20, 400DCLP, D460 ± 25; Chroma Technology, Brattleboro, VT).
Immunostaining and Transfections.
For immunocytochemistry, neurons were fixed with 4% formaldehyde/PBS and were permeabilized in 0.4% saponin. For some primary antibodies such as anti PSD-95, cultures were fixed in 100% methanol at −20°C for 10 min. Primary antibodies used in this study were anti-MAP2 monoclonal (1:400, Boehringer Mannheim), anti-PSD-95 monoclonal (1:200, Calbiochem), anti-tau-1 monoclonal (1:200, Boehringer Mannheim), anti-synapsin-I polyclonal (1:500, Calbiochem), and anti-synaptotagmin I polyclonal (1:200, Calbiochem). Secondary antibodies were Alexa 488-conjugated goat anti-mouse and Alexa 594-conjugated goat anti-rabbit (Molecular Probes). Synapsin I antibody gave best results in positively identifying synaptic clusters, although its consistent but unexplained failure to co-stain with tau-1 antibodies prompted us to use antibodies against synaptotagmin I, another synaptic marker for such co-staining experiments. Confocal microscopy was carried out by using an MDI 2010 multiprobe Confocal Laser-Scanning Microscope (Molecular Dynamics). Confocal photomicrographs were converted to pseudocolor images by using by photoshop 4.0 (Adobe Systems, Mountain View, CA). Calcium phosphate transfection of neurons with pIRES-enhanced GFP vector (CLONTECH) was carried out according to previously published protocols (27).
Electronmicroscopy.
The cells were fixed for 30 min in 2% glutaraldehyde buffered with 0.1 M sodium phosphate (pH 7.2) at 4°C. They were rinsed twice in buffer, then were incubated in 1% OsO4 for 30 min at room temperature. After rinsing with distilled water, specimens were stained en bloc with 2% aqueous uranyl acetate for 15 min, were dehydrated in ethanol, and were embedded in poly/bed812 for 24 hours. Fifty-nanometer sections were poststained with uranyl acetate and lead citrate and were viewed with a Philips Electronic Instruments (Mahwah, NJ) CM-12 transmission electron microscope.
Results
Organization of Synapses in Dissociated Hippocampal Cultures.
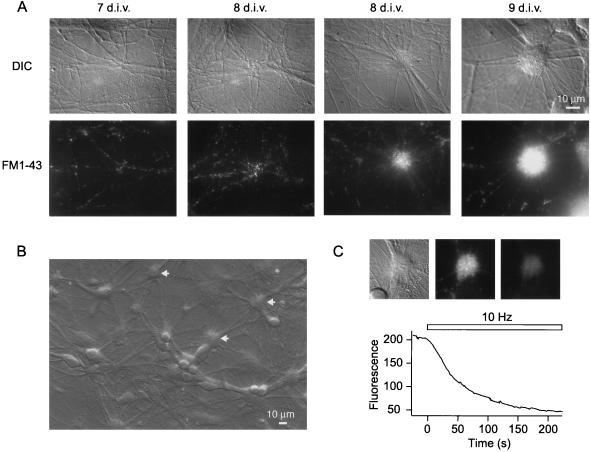
Fig. 1 illustrates the development of synaptic organization in DG-CA3 hippocampal cultures as visualized with the aid of FM1–43. The formation of functional synapses was first detected at ≈6 d.i.v. At 6 and 7 d.i.v., these early synapses could be seen evenly distributed along dendrites (Fig. 1A Far left). Starting at ≈8 d.i.v., certain regions in the dendritic field displayed an uneven distribution of synaptic boutons, seen as occasional groupings (Fig. 1A Middle left). In some cases, these synaptic aggregations were clearly discernible under differential interference contrast (DIC) optics with a corresponding tight packing of FM-43 spots (Fig. 1A Middle right; see also Fig. 5C). With either DIC or fluorescence optics, these tightly packed synaptic groupings appeared larger and more abundant from 9 d.i.v. onward (Fig. 1A Far right), suggesting a gradual increase in synaptic density at these locations. The synaptic clusters were readily distinguished from cell bodies. In several cases (Fig. 1B, and see Fig. 6), they were found apposed to the proximal dendrites of pyramidal cells, in accord with the localization of mossy-fiber synapses in vivo (28). The sequestered FM1–43 in these synaptic clusters could be released with action potential firing induced by 10-Hz field stimulation (Fig. 1B) (29). The background fluorescence levels remaining after multiple rounds of stimulation were comparable to those of distributed synaptic puncta (data not shown).
Figure 1.
Clustering of synaptic boutons in dentate gyrus and CA3 co-cultures. (A) Time course of development of synaptic clusters in hippocampal cultures. Top panels show representative synaptic/dendritic fields under DIC optics at 7, 8 (two examples), and 9 d.i.v., respectively. Bottom panels depict the corresponding FM1–43 fluorescence images. (B) Overall view of a DG-CA3 co-culture at 10 d.i.v. Arrows indicate the locations of representative synaptic clusters. (C) Synaptic clusters take up and release FM1–43 in an activity-dependent manner. Top panels show a synaptic cluster under DIC optics (Left), and under fluorescence microscopy, viewed before (Middle) and after (Right) destaining with action potential firing induced by 10-Hz field stimulation (1 ms, 30 mA). The graph depicts the time course of destaining for the synaptic cluster shown on the left, with absolute fluorescent intensity plotted in arbitrary units. The residual staining was releasable on further stimulation.
Figure 5.
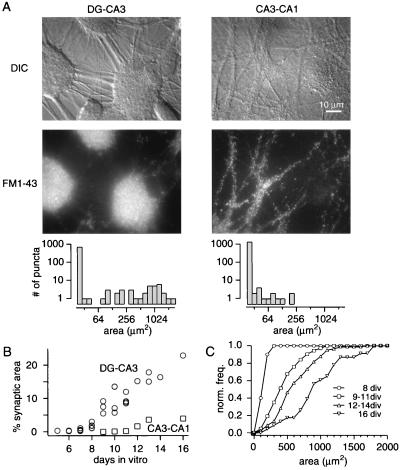
Synaptic organization of cultures obtained from distinct hippocampal regions. (A) The top panels show representative synaptic/dendritic fields under DIC optics from a dentate gyrus-CA3 culture (16 d.i.v.) and a CA1-CA3 culture (17 d.i.v.). The middle panels depict the corresponding FM1–43 fluorescence images. The bottom panels show the distributions of contiguous FM1–43 stained areas, obtained from 18 randomly selected frames (1 frame = 6,300 μm2) from the cultures illustrated above. A punctum refers to a contiguous FM1–43 stained area measured after automatic thresholding of image frames with respect to peak fluorescence intensity and background. Synaptic clusters typically correspond to areas <100 μm2. (B) Time course of increased FM1–43 stained area per coverslip in dentate gyrus-CA3 cultures (circles) and CA1-CA3 cultures (squares). Relative FM1–43 stained area per coverslip indicates the ratio of area stained with FM1–43 to total area, averaged over 18 randomly selected frames (6,300 μm2 each). For any given day, individual symbols indicate data from distinct batches of hippocampal cultures. Note the delay in appearance of FM1–43 staining in CA1-CA3 cultures (starting at 6–7 d.i.v.) relative to dentate gyrus-CA3 cultures. (C) Quantification of increase in the areas of synaptic clusters with age in culture. Synaptic clusters are barely detectable at 8 d.i.v., assume a characteristic morphology by 9 d.i.v., and then grow significantly from 11 d.i.v. onward (P < 0.01 for all pairs, Kolmogorov-Smirnov test). Normalized cumulative distributions were obtained by pooling area measurements from clusters at 8, 9–11, 12–14, and 16 d.i.v, respectively.
Figure 6.
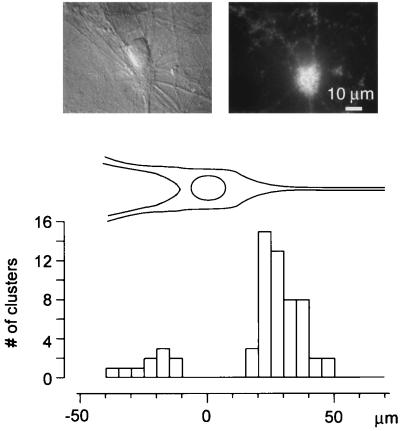
Synaptic clusters tend to form on proximal regions of apical dendrites of pyramidal cells. The histogram shows the spatial distribution of 61 clusters found to lie directly on pyramidal cells with morphologically distinct apical and basal dendrites. Of these, 51 were found on proximal dendrites, 10 on basal dendrites, and none on cell bodies. These data were derived from a larger data set, collected from >20 coverslips, containing 494 synaptic clusters in total. The top panels depict a typical pyramidal cell chosen for analysis. Clusters not atop an individual, obviously polarized pyramidal neuron were excluded from this analysis, although they were always associated with dendritic processes of unidentified origin.
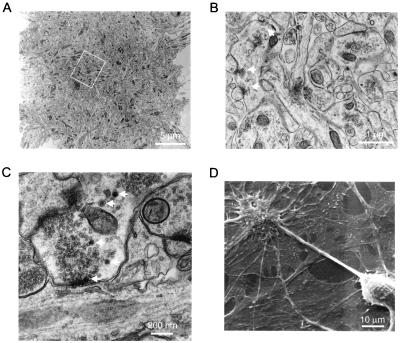
At the ultrastructural level, electron microscopy verified that the clusters contained a large number of tightly packed, anatomically distinct synaptic boutons (Fig. 2A), as expected from the uptake and release of FM1–43. In higher magnification views (Fig. 2 B and C), the synaptic clusters were found to include boutons as large as 4 μm in diameter, with multiple active zones, a distinguishing feature of mossy fiber boutons in situ. The large boutons also had a slightly higher incidence of small dense core vesicles, 5–6 per bouton compared with 1–2 in CA1-CA3 synapses (N. C. Harata and J. Buchanan, personal communication), supporting their resemblance to mossy-fiber boutons (Fig. 2C) (21–23). As expected for peptidergic dense core vesicles, granule cell somata and synaptic clusters displayed positive immunostaining with a dynorphin-specific antibody (data not shown). Synaptic clusters also could be distinguished as individual entities under scanning electronmicroscopy (Fig. 2D). Close examination of these images indicated the presence of glial substrates beneath the synaptic aggregates.
Figure 2.
Ultrastructural analysis of synaptic clusters supports the FM1–43 measurements. (A) A transmission electronmicrograph (3,000×) of a 50-nm section through a synaptic cluster at 13 d.i.v. (B) A higher magnification electronmicrograph (8,000×) from the same synaptic cluster shown in A (area within the white rectangle). Some of the synaptic boutons contain multiple active zones with groups of synaptic vesicles nearby (white arrows). (C) Ultrastructural organization (35,000×) of a mossy-fiber bouton in vitro. Shown is a 48-day-old culture. Note the increase in the sizes of vesicular clusters compared with B and the presence of dense core vesicles (arrows). (D) Scanning electronmicrograph of a synaptic cluster localized on the apical dendrite of a pyramidal cell. Note the presence of glial substrate beneath the neuronal structures.
Organization of Axons and Dendrites Within Synaptic Clusters.
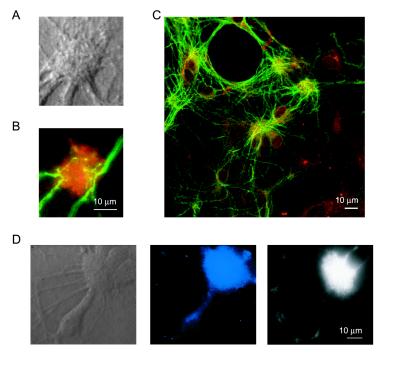
To obtain further structural details on the organization of axons and dendrites within synaptic clusters, we transfected our cultures with GFP to help visualize the morphology of single cells. With this approach we could identify axons as thin processes with constant diameters (<1 μm) throughout the long distances (≈1 mm) they traverse across the coverslip. In several cases, we observed GFP-labeled axons that originated from multiple granule cells converging onto single synaptic clusters that were identified by staining with FM4–64, a FM1–43 analog with longer wavelength emission spectra that is suitable for dual channel fluorescence imaging with GFP (11, 13) (Fig. 3 A and B). This observation was supported by immunocytochemical analysis using a monoclonal antibody against tau-1, a microtubule-associated protein restricted to axons in mature neurons (30, 31). Tau staining of DG-CA3 cultures showed the presence of several axons crossing through synaptic clusters identified by immunopositivity to synaptotagmin I, a presynaptic marker (Fig. 3C). The number of axonal fascicles entering a cluster ranged between 10 and 30 (16.2 ± 5.7; n = 15 clusters). These numbers indicate a lower bound on the extent of axonal convergence because the actual number of individual axons within fascicles is difficult to discern.
Figure 3.
Organization of axonal structures within synaptic clusters. (A and B) Two axons originating from two granule cells transfected with GFP converge onto a synaptic cluster. A shows the DIC photomicrograph of the synaptic cluster labeled with FM4–64 (red) in B. The scale bar applies to A and B. (C) Co-immunolabeling with antibodies against tau-1 (green) and synaptotagmin I (red) shows the extensive convergence of axons into synaptic clusters. Shown is a 12 d.i.v. DG-CA3 culture. (D) Fluorescent labeling of synaptic clusters for vesicular Zn2+, a hallmark of mossy-fiber boutons. Live cultures were co-stained with TSQ, an indicator for Zn2+ (Middle, blue labeling) and FM1–43 (Right).
In hippocampus, synaptic vesicles of mossy fiber boutons contain a significant amount of histochemically reactive zinc, which can be labeled with heavy metal staining methods such as Timm’s stain (32). This property of the mossy fiber pathway has been instrumental in experimental settings in which alterations in mossy fiber innervation patterns have been examined (22, 23, 33). To investigate the presence of zinc in our DG-CA3 cultures, we incubated them with TSQ, a vital fluorescent indicator for Zn2+, which fluoresces at 460 nm when bound to Zn2+ (34), and is therefore suitable for co-staining experiments in which FM1–43 is used to positively identify synaptic clusters. In these experiments, there was a one-to-one overlap between FM1–43-stained clusters and areas fluorescently labeled with TSQ, strongly supporting the view that synaptic clusters were composed of mossy fiber boutons originating from dentate granule cells (Fig. 3D). In parallel experiments, we could not detect any TSQ fluorescence in CA1-CA3 cultures (data not shown).
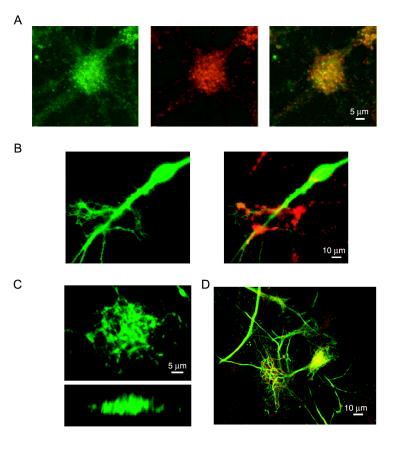
To test whether postsynaptic specializations accompany the clustering of presynaptic terminals, we immunostained DG-CA3 cultures with a monoclonal antibody against PSD-95, a major component of the postsynaptic density of excitatory glutamatergic synapses (35). With this approach, we observed a substantial co-localization of presynaptic terminals labeled with a polyclonal antibody against synapsin I and postsynaptic structures labeled with PSD-95 within the synaptic clusters (Fig. 4A).
Figure 4.
Organization of postsynaptic and dendritic structures within synaptic clusters. (A) Co-immunolabeling with antibodies against PSD-95 (Left, green) and synapsin I (Middle, red) reveals the postsynaptic counterpart to presynaptic clusters detected with FM1–43. Superimposition of both staining patterns depicts the spatial correlation between the two markers within a cluster (Left). (B) GFP-labeled apical dendrite of a pyramidal cell (Left, green) and the localized synaptic clusters labeled with FM4–64 (Right, red) that surmount the dendrite. Note the co-localization of FM4–64 staining with branches and spines originating from the parent dendrite. Scale bar applies to both panels. (C) Complex dendritic arborizations penetrate the synaptic clusters as indicated by monoclonal antibody staining for MAP-2, a dendritic marker. The upper panel shows top view of a three-dimensional reconstruction obtained from 20 confocal sections through the synaptic cluster (2 μm thick optical slices); the bottom panel shows a side view of the same dendritic structure. (D) Co-staining with antibodies against MAP-2 (green) and synaptotagmin I (red) shows correspondence between large dendritic arborizations and synaptic markers.
We used two approaches to visualize the morphology of dendrites that complement axonal and presynaptic groupings in clusters. First, in cultures transfected with GFP, we could detect the presence of spiny extrusions and thin branches originating from apical dendrites of single cells, beneath the FM4–64 stained synaptic bouton clusters (Fig. 4B). These dendritic branching patterns covered areas <100 μm2 in correlation with discrete FM1–43-stained presynaptic areas. Subsequently, we fixed and immunostained our cultures with a monoclonal antibody against microtubule-associated protein 2 (MAP-2), a classical dendritic marker (31), to examine the overall organization of dendritic arbors. The MAP-2 staining revealed extensive dendritic arborizations in cultures ≥9 d.i.v. (Fig. 4 C and D), whose size correlated well with the area of the synaptic clusters (Figs. 1A and 2A). This analysis suggested that, at early stages, presynaptic clusters can be accommodated by processes from a single dendrite, although larger synaptic clusters, especially those observed at later stages (>14 d.i.v.), may include branches from multiple parent dendrites.
Regional and Subcellular Specificity of Synaptic Clustering.
The ability to form large synaptic clusters was region-specific. Fig. 5A Left shows three representative clusters from a DG-CA3 culture at 16 d.i.v. Their contiguous FM1–43-stained areas were in the range of 600 μm2, typical of 30 clusters from the same coverslip (histogram). In contrast, CA1-CA3 cultures, obtained with particular attention to avoiding contamination from adjacent dentate gyrus, did not exhibit any clusters >250 μm2 (Fig. 5A Right). These findings suggest that synaptic clustering in DG-CA3 co-cultures was a cell-specific property. Another striking difference between regions was the earlier and more prolific formation of functional synapses in DG-CA3 cultures compared with CA1-CA3 cultures (13) (Fig. 5B). After detection of synapses in DG-CA3 cultures at 6 d.i.v., the overall area occupied by synapses grew steeply between 8 and 12 d.i.v., increasing up to 20% of total area with further time in culture. In contrast, the total synaptic area in CA1-CA3 cultures increased relatively late, after 11 d.i.v., and leveled off near 5%. Further analysis focused on developmental changes in the dimensions of individual synaptic clusters (Fig. 5C). The mean cluster area in DG-CA3 cultures showed a dramatic rise between 8 and 16 d.i.v., from <120 μm2 to >800 μm2. This increase could be best documented by grouping clusters with respect to their gradual developmental stages [8, 9–11, 12–14, and 16 d.i.v. (Fig. 5C)]. When we examined the normalized cumulative distributions of cluster sizes at these stages, we detected a progressive, statistically significant shift toward larger sizes (P < 0.01 in all comparisons, Kolmogorov-Smirnov test). The consistent increase of cluster size with time in culture suggests a mechanism by which new synaptic boutons form in close proximity to preexisting synaptic clusters, causing growth by accretion.
A characteristic feature of mossy fiber terminals in vivo is their localization to the proximal region of apical dendrites of CA3 neurons, which underlies the synaptic layer known as stratum lucidum. Synaptic clusters in DG-CA3 cultures showed a similar tendency, as indicated by a histogram of cellular localization (Fig. 6). Of 61 clusters found to lie on clearly identifiable pyramidal cells with morphologically distinct apical and basal dendrites, 51 were found on proximal dendrites and 10 on basal dendrites. Remarkably, no clusters could be detected on pyramidal cell bodies, in accord with in vivo observations.
Activity-Dependent Regulation of Synaptic Clustering.
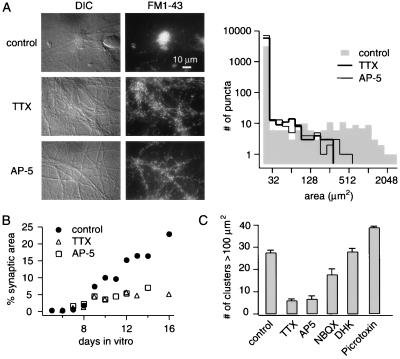
What is the role of neuronal activity in the formation of the synaptic clusters? In DG-CA3 cultures, significant levels of background activity, in the form of spontaneous action potential firing, presynaptic vesicular turnover, and postsynaptic potentials were observed by using voltage recordings and Ca2+-dependent FM1–43 destaining (data not shown). Treatment of DG-CA3 cultures with 1 μM TTX from 6 d.i.v. forward not only blocked action potential firing but also prevented the appearance of synaptic clusters at 9 d.i.v. (Fig. 7A). The addition of 50 μM l-AP5, a blocker of N-methyl-d-aspartic acid (NMDA) receptors, was also effective in preventing the formation of synaptic clusters (Fig. 7A). Neither TTX nor l-AP5 significantly altered the time course of synapse formation up to 9 d.i.v. (Fig. 7B) (quantified by the increase in the total area stained with FM1–43). With longer periods in culture, these interventions caused the proportion of synaptic area to level off at 5% rather than increase up to 20%, most likely because of interference with cluster formation (Fig. 7B). In contrast to TTX and l-AP5, exposure to 2,3-dihydroxy-6-nitro-7-sulfamoylbenzo[f]quinoxaline (NBQX) (10 μM), an antagonist of a-amino-3-hydroxy-5-methyl-4-isoxazolepropionic acid (AMPA)-type glutamate receptors, reduced the number of detectable synaptic clusters but did not abolish them completely (Fig. 7C). In an effort to increase the level of background activity, addition of γ-aminobutyric acid type A receptor blocker picrotoxin (50 μM) to the culture medium caused a significant increase in the number (Fig. 7C) and size of detectable synaptic clusters (at 10 d.i.v. picrotoxin: 638 ± 421 μm2 vs. control: 418 ± 258 μm2, P < 0.001, n = 3). Taken together, these results suggest that neuronal activity plays an instructive role in the formation and proliferation of synaptic clusters. Blocking glutamate transporters with dihydrokainic acid (300 μM) had no detectable effect (Fig. 7C).
Figure 7.
Blocking neuronal activity abolishes synaptic clustering. (A) Effect of blocking spontaneous action potential firing or NMDA receptors in DG-CA3 cultures. Representative DIC micrographs (Left) and corresponding FM1–43 fluorescent images (Right), taken at 10 d.i.v., after mock treatment (control), after treatment with TTX (1 μM), or exposure to l-AP5 (50 μM) (all interventions beginning at 6 d.i.v.). The right histogram shows the distribution of contiguous FM1–43 stained areas at 10 d.i.v. Note log10 vs. log2 scale. For each condition, data were pooled from three representative coverslips (18 frames each), each from three distinct cultures. (B) Treatment of DG-CA3 cultures with TTX or AP5 did not affect the time course of synapse formation up to 8 d.i.v. but was associated with the absence of an increase in overall synaptic area ≥9 d.i.v. Control measurements (filled circles) were calculated as means of values shown in Fig. 5B. (C) Summary of effects on formation of synaptic clusters of pharmacological treatments that alter neuronal activity. The vertical scale represents the number per coverslip of contiguous FM1–43 stained areas <100 μm2. Control, 27.5 ± 1.1 (n = 9); TTX, 6.6 ± 0.8 (n = 3); l-AP5, 6.0 ± 1.5 (n = 3); 2,3-dihydroxy-6-nitro-7-sulfamoylbenzo[f]quinoxaline, 17.6 ± 2.6 (n = 3); dihydrokainic acid, 28.0 ± 1.5 (n = 3); picrotoxin, 39.0 ± 0.5 (n = 3).
Early Tendency for an Activity-Dependent Increase in Synaptic Proximity.
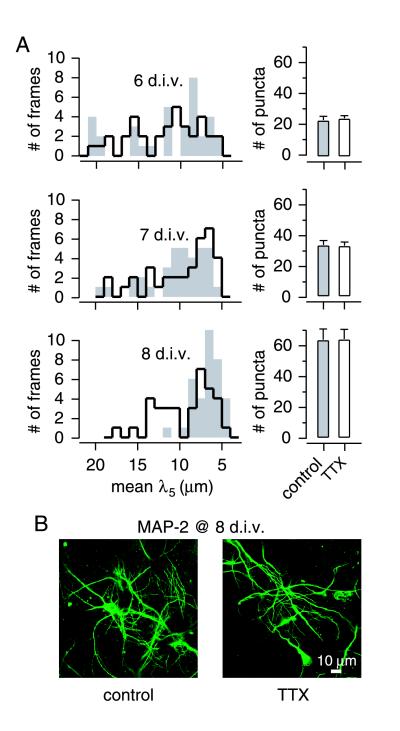
Up to 8 d.i.v., before the clear appearance of clusters, background electrical activity did not cause a significant increase in synaptic area (Fig. 7B). The developmental events over this early period were of great interest but were more challenging to document than the increase in size and abundance of already-formed clusters seen later. To quantify the tendency of synapses to group together, we mapped the positions of all FM1–43 stained puncta, determined the mean distance between each punctum and a handful of its closest neighbors (λ5 for the five closest puncta), and averaged λ5 across a large frame (〈λ5〉). Fig. 8A compares distributions of 〈λ5〉 values from TTX-treated and mock-treated cultures. There were no significant differences between TTX-treated (solid line) and control cultures (gray bars) on 6 and 7 d.i.v. (P > 0.5, Kolmogorov-Smirnov test). On 8 d.i.v., however, the histogram of 〈λ5〉 values in control frames narrowed to a distribution between 5 to 10 μm whereas the 〈λ5〉 distribution for TTX-treated cultures remained broad and skewed, ranging from 5 to 17 μm (P < 0.01) (Fig. 8A). Results similar to those derived from λ5 analysis were obtained with an alternative approach in which the number of neighboring puncta within a fixed radius of each punctum was counted (data not shown).
Figure 8.
Quantification of the spatial distribution of synapses at early stages of development. (A) Distributions of 〈λ5〉 values with mock treatment (open histogram) and TTX-treated conditions (shaded histogram). Treatments were begun at 4 d.i.v. The parameter λ5 was defined as the mean distance of the five closest synaptic boutons neighboring a given bouton. 〈λ5〉, the mean of λ5 values for all boutons in a given frame, provided a measure of overall synaptic proximity in that frame. Each panel shows histograms including 35 frames under each condition; data were pooled from two DG-CA3 cultures. The distributions of 〈λ5〉 values with and without TTX were not significantly different at 6 and 7 d.i.v. At 8 d.i.v., this distribution peaked between 5 and 10 μm in control cultures whereas it was skewed toward 17 μm in the presence of TTX (P < 0.01, Kolmogorov-Smirnov test). The fields analyzed at 8 d.i.v. did not include any morphologically distinct clusters, although they can be occasionally observed at this stage. (Right) Density of puncta per frame. Values for control and TTX-treated conditions were not significantly different at 6, 7, or 8 d.i.v. (B) Immunostaining of dendritic fields at 8 d.i.v. by a monoclonal antibody against MAP-2. Large dendritic arborizations seen at later stages were not detectable at this stage.
These observations are consistent with the idea that synapses tend to group together under conditions in which electrical activity is permitted (thereby decreasing 〈λ5〉) but not if it is blocked. Some other explanations for the effect of TTX could be excluded. The effect of blocking spike activity on the distribution of synaptic boutons was not complicated by a change in the abundance of synapses because TTX- and mock-treated neurons displayed comparable numbers of dye-stained spots on any given day up to 8 d.i.v. (Fig. 8A Right). Although we cannot exclude the presence of subtle alterations in postsynaptic structures to accommodate this early synaptic grouping, we did not observe significant changes in the organization of dendritic arbors at these stages (Fig. 8B). Large dendritic branching patterns we have seen in control cultures at later stages of development (>9 d.i.v.) (Fig. 4) were not present at 8 d.i.v.
cAMP-Dependent Regulation of Synaptic Clustering.
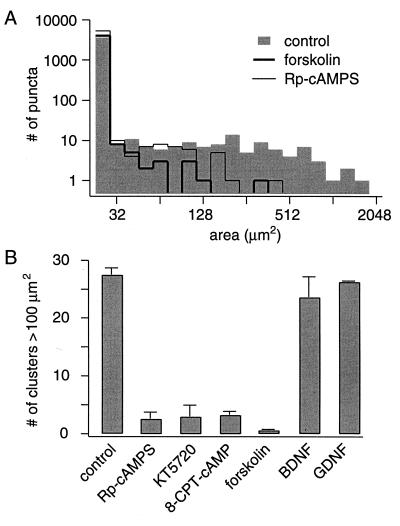
Cyclic-AMP-dependent signaling can cause long-lasting increases in synaptic efficacy at hippocampal synapses (36–38), strongly affects neuronal responses to neurotrophins (39), and is an important modulator of the effects of molecules such as brain-derived neurotrophic factor, acetylcholine, and netrin-1 on axonal guidance (40, 41). We performed experiments to determine whether cAMP-dependent signaling influenced the formation of synaptic clusters. Blocking the activity of cAMP-dependent protein kinase from 6 d.i.v. onwards with the specific inhibitors Rp-cAMPS or KT5720 resulted in a substantial reduction in the number of synaptic clusters at 9 and 10 d.i.v. (Fig. 9 A and B). To find out whether this signaling is instructive or merely permissive (42), we also tested the effect of elevating cAMP-levels by addition of forskolin (10 μM) or treatment with a nonhydrolyzable membrane-permeable analog of cAMP (100 μM 8-chlorophenylthio-cAMP). Interestingly, these maneuvers were also effective in preventing cluster formation (Fig. 9 A and B). None of the treatments significantly altered neuronal survival (see Materials and Methods) or the time course of synapse formation. These observations support the involvement of local cAMP-dependent signaling in events leading up to synaptic aggregation. We suggest that blocking the cAMP cascade may disrupt targeting signals or turn them into repulsive interactions (40, 41), but strong elevation of cAMP levels might result in a loss of spatial specificity. The neurotrophins brain-derived neurotrophic factor and Glia-derived neurotrophic factor are leading examples of trophic factors that alter patterns of synaptic organization in other systems (43–46). Brain-derived neurotrophic factor and Glia-derived neurotrophic factor also were tested on cluster formation in the DG-CA3 culture system but did not produce any detectable effect (Fig. 9B).
Figure 9.
Cyclic AMP-dependent regulation of synaptic clustering in DG-CA3 cultures. (A) Histograms showing the distributions of contiguous FM1–43 stained areas at 10 d.i.v., after treatments beginning at 6 d.i.v. with forskolin (10 μM), Rp-cAMPS (20 μM), or vehicle control (note log10 vs. log2 scale). The data were pooled from three coverslips, each taken from a distinct culture batch (18 frames each). (B) Effects of neurotrophic factors and various treatments that alter cAMP-dependent signaling on formation of synaptic clusters in DG-CA3 cultures. The number per coverslip of contiguous FM1–43 stained areas <100 μm2 is shown. Control, 27.5 ± 1.1 (n = 9); forskolin, 0.6 ± 0.2 (n = 5); Rp-cAMPS, 2.6 ± 1.2 (n = 3); KT5720, 3.0 ± 2.0 (n = 2); 8-chlorophenylthio (CPT)-cAMP, 3.3 ± 0.6 (n = 3); brain-derived neurotrophic factor, 23.6 ± 3.6 (n = 3); Glia-devised neurotrophic factor (GDNF), 26.3 ± 2.4 (n = 3).
Discussion
Parallels to Synaptic Organization of Hippocampus in Situ.
The synaptic clusters in our co-cultures of dissociated dentate granule neurons and CA3 pyramidal cells showed several parallels with mossy fiber synapses in vivo (33) or in organotypic slice cultures (25, 26, 47). For example, at the ultrastructural level, the clusters displayed a neuropil-like morphology, with presynaptic terminals up to 4 μm across, containing multiple active zones with nearby synaptic vesicles, reminiscent of mossy fiber terminals in stratum lucidum (21, 22). Axons from multiple granule cells were found to converge onto a single target pyramidal neuron, a pattern of innervation typical of the CA3 region. The presynaptic terminals within the clusters could be consistently labeled with a fluorescent probe for Zn2+, a well known marker of mossy fiber boutons (22, 32, 34). The clusters also contained complex postsynaptic structures that resembled the branched spines on proximal dendrites of CA3 neurons, the principal targets of mossy fiber synapses (48).
Perspectives gained from DG-CA3 cocultures may be viewed as complementary to those obtained in less reduced systems. Experiments with hippocampal preparations that have undergone reinnervation after either transplantation or lesion have shown a remarkable preservation of spatially restricted innervation patterns (28). For example, in cultured slices, lesioning mossy fiber tracts is followed by reestablishment of mossy fiber synaptic connections with significant specificity (25, 26, 47). Similarly, mossy fiber projections growing out of embryonic dentate gyri transplanted into adult hosts can innervate CA1 pyramidal cells in a stereotypically spatially restricted pattern (33). This ability of mossy fiber boutons to establish de novo connections with high spatial specificity in a foreign environment suggests the existence of intrinsic mechanisms for mossy fiber synaptic organization that originate in large part from the dentate granule cells themselves. Our experiments in DG-CA3 cultures carry this line of approach to an even more reductionist level: Aspects of mossy fiber innervation could still be observed starting with populations of individually dissociated hippocampal neurons. Among the synaptic clusters that fell close to clearly identifiable pyramidal neurons, the vast majority were preferentially located on the proximal region of apical dendrites rather than cell bodies, a pattern characteristic of mossy fiber innervation in intact hippocampus. The convergence of multiple presynaptic axons onto a single neuron as target led to round synaptic clusters, but the logical extrapolation to a target geometry consisting of a well aligned row of CA3 pyramidal cells would be a stripe of synaptic terminals, similar to the stratum lucidum in situ (28). Likewise, the clusters that sometimes appeared on basal dendrites of cultured pyramidal neurons may correspond to infrapyramidal connections that are occasionally seen in situ when the CA3 region is reinnervated after a lesion (24–26).
The Role of Activity in Synapse Formation and Targeting in DG-CA3 Cultures.
The reduced system offered considerable advantages for studies of underlying mechanisms of high-order synaptic arrangements: the ability to use FM1–43 to pinpoint the locations of functional synapses (not presently feasible in slice preparations) and ease of testing whether synaptic localization depended on electrical activity or second messenger cascades. We found that the emergence of large and elaborate synaptic clusters was preceded by a more subtle but highly significant narrowing of the distance between individual boutons and their neighbors. Inhibiting electrical activity with TTX strongly interfered with this synaptic grouping, even at an early stage (8 d.i.v.), before any activity-dependent changes could be detected in the abundance of presynaptic terminals or the configuration of postsynaptic structures. Like TTX, l-AP5 also prevented the development of the large synaptic clusters, indicating the importance of signaling via postsynaptic NMDA receptors. These observations suggest that functional neurotransmission at certain synapses can favor further synapse formation or stabilization within their close vicinity, leading first to increased proximity of individual synaptic terminals and later to full-blown cluster formation. A working hypothesis is that these events involve known signaling mechanisms on both sides of the synapse. For example, presynaptic activity can modify dendritic morphology through increases in dendritic branching and spine formation as well as formation of filopodia-like dendritic extrusions (49–52). In turn, the dendritic extrusions might induce the formation of new presynaptic structures from the same axon or different axons (13, 53, 54), leading to spatial clustering of synapses overall (D. Baranes, personal communication). This scenario leaves ample opportunity for instructional regulation by cAMP signaling as indicated by our experiments with forskolin and protein kinase A inhibitors. Cyclic AMP has already been implicated in presynaptic expression of long-lasting synaptic potentiation at mossy fiber synapses but may also influence axon guidance and dendritic signaling mechanisms in the postsynaptic target cells (40, 41).
Activity-dependent synaptic clustering was seen prominently in DG-CA3 hippocampal cultures but not in CA3-CA1 cultures, suggesting a regional specificity that may aid future identification of the activity-dependent signal(s). An activity-dependent mechanism that brings synaptic terminals closer together would greatly enhance the potential for intersynaptic communication, in line with recent suggestions that synapses represent more than isolated conduits of communication that have been traditionally proposed (56, 57). At mossy fiber synapses, a well documented mechanism for such signaling is through extrasynaptic spillover of glutamate (55, 58).
Comparison to Experiments in Other Preparations.
The neuronal cultures offered a somewhat different perspective than classical preparations for studying neural development that have already yielded many valuable insights (1–3). Experiments in brain, e.g., in the visual system, usually focus on axonal extension and dendritic arborization rather than synaptic patterning per se. Our dissociated neuronal cultures are more like the neuromuscular junction preparation in providing experimental access to the synaptic terminals themselves (59). A dominant theme in both visual system and neuromuscular junction studies is the principle of competitive synapse elimination: Synapses that are more active survive whereas those that are less active are punished (60, 61). Thus, activity-dependent synaptic competition sculpts the final pattern of synaptic connections from a preexisting diffuse distribution (5–7). This principle seems dominant at the motor endplate, where focal block of postsynaptic receptors with α-bungarotoxin causes a local loss of innervation, whereas global blockade of postsynaptic receptors leaves synaptic innervation unchanged (60). In contrast, in DG-CA3 cultures, global blockade of NMDA receptors disrupted the clustering process (Fig. 7). Our results do not exclude a role for competitive synapse elimination, but they raise the possibility of another scenario for synaptic targeting in which proximity of terminals is positively reinforced. It remains to be seen whether such a process might contribute to activity-dependent target selection during formation of synaptic connections within the brain (62–65).
Acknowledgments
We are grateful to Ms. Nafisa Ghori for her excellent assistance in electronmicroscopy and Dr. Erika S. Piedras-Renteria for her help in enhanced GFP transfections. We would like to thank Drs. B. A. Barres, R. H. Scheller, S. J Smith, and E. Ullian for critically reading an earlier version of the manuscript as well as Drs. E. S. Piedras-Renteria, N.C. Harata, G. S. Pitt, and J. L. Pyle for helpful discussions and suggestions throughout this study. This work was supported by grants from the National Institute of Mental Health, the Mathers Charitable Foundation, the McKnight Endowment Fund for Neuroscience (to R.W.T.), and fellowships from the American Heart Association Western States Affiliate (to E.T.K.) and the Boehringer Ingelheim Fonds (to J.K.).
Abbreviations
- DG
dentate gyrus
- AP5
2-amino-5-phophonopentanoic acid
- NMDA
N-methyl-d-aspartic acid
- MAP-2
microtubule-associated protein-2
- DIC
differential interference contrast
- d.i.v.
days in vitro
- TTX
tetrodotoxin
- GFP
green fluorescent protein
Footnotes
This contribution is part of the special series of Inaugural Articles by members of the National Academy of Sciences elected on April 29, 1997.
References
- 1.Wiesel T N. Nature (London) 1982;299:583–591. doi: 10.1038/299583a0. [DOI] [PubMed] [Google Scholar]
- 2.Goodman C S, Shatz C J. Cell. 1993;72,Suppl.:77–98. doi: 10.1016/s0092-8674(05)80030-3. [DOI] [PubMed] [Google Scholar]
- 3.Hall Z W, Sanes J R. Cell. 1993;72,Suppl.:99–121. doi: 10.1016/s0092-8674(05)80031-5. [DOI] [PubMed] [Google Scholar]
- 4.Tessier-Lavigne M, Goodman C S. Science. 1996;274:1123–1133. doi: 10.1126/science.274.5290.1123. [DOI] [PubMed] [Google Scholar]
- 5.Constantine-Paton M, Cline H T, Debski E. Annu Rev Neurosci. 1990;13:129–154. doi: 10.1146/annurev.ne.13.030190.001021. [DOI] [PubMed] [Google Scholar]
- 6.Chapman B, Stryker M P. Curr Opin Neurobiol. 1992;2:498–501. doi: 10.1016/0959-4388(92)90186-o. [DOI] [PubMed] [Google Scholar]
- 7.Katz L C, Shatz C J. Science. 1996;274:1133–1138. doi: 10.1126/science.274.5290.1133. [DOI] [PubMed] [Google Scholar]
- 8.Shatz C J, Stryker M P. Science. 1988;242:87–89. doi: 10.1126/science.3175636. [DOI] [PubMed] [Google Scholar]
- 9.Lichtman J W, Balice-Gordon R J. J Neurobiol. 1990;21:99–106. doi: 10.1002/neu.480210107. [DOI] [PubMed] [Google Scholar]
- 10.Betz W J, Bewick G S. Science. 1992;255:200–203. doi: 10.1126/science.1553547. [DOI] [PubMed] [Google Scholar]
- 11.Betz W J, Mao F, Smith C B. Curr Opin Neurobiol. 1996;6:365–371. doi: 10.1016/s0959-4388(96)80121-8. [DOI] [PubMed] [Google Scholar]
- 12.Ryan T A, Reuter H, Wendland B, Schweizer F E, Tsien R W, Smith S J. Neuron. 1993;11:713–724. doi: 10.1016/0896-6273(93)90081-2. [DOI] [PubMed] [Google Scholar]
- 13.Ziv N E, Smith S J. Neuron. 1996;17:91–102. doi: 10.1016/s0896-6273(00)80283-4. [DOI] [PubMed] [Google Scholar]
- 14.Murthy V N, Sejnowski T J, Stevens C F. Neuron. 1997;18:599–612. doi: 10.1016/s0896-6273(00)80301-3. [DOI] [PubMed] [Google Scholar]
- 15.Klingauf J, Kavalali E T, Tsien R W. Nature (London) 1998;394:581–585. doi: 10.1038/29079. [DOI] [PubMed] [Google Scholar]
- 16.Baranes D, López-García J C, Chen M, Bailey C H, Kandel E R. Proc Natl Acad Sci USA. 1996;93:4706–4711. doi: 10.1073/pnas.93.10.4706. [DOI] [PMC free article] [PubMed] [Google Scholar]
- 17.López-García J C, Arancio O, Kandel E R, Baranes D. Proc Natl Acad Sci USA. 1996;93:4712–4717. doi: 10.1073/pnas.93.10.4712. [DOI] [PMC free article] [PubMed] [Google Scholar]
- 18.Tong G, Malenka R C, Nicoll R A. Neuron. 1996;16:1147–1157. doi: 10.1016/s0896-6273(00)80141-5. [DOI] [PubMed] [Google Scholar]
- 19.Johnston D, Williams S, Jaffe D, Gray R. Annu Rev Physiol. 1992;54:489–505. doi: 10.1146/annurev.ph.54.030192.002421. [DOI] [PubMed] [Google Scholar]
- 20.Weisskopf M G, Castillo P E, Zalutsky R A, Nicoll R A. Science. 1994;265:1878–1882. doi: 10.1126/science.7916482. [DOI] [PubMed] [Google Scholar]
- 21.Amaral D G. Anat Embryol. 1979;155:241–251. doi: 10.1007/BF00317638. [DOI] [PubMed] [Google Scholar]
- 22.Amaral D G, Dent J A. J Comp Neurol. 1981;195:51–86. doi: 10.1002/cne.901950106. [DOI] [PubMed] [Google Scholar]
- 23.Zimmer J, Gähwiler B H. J Comp Neurol. 1984;228:432–446. doi: 10.1002/cne.902280310. [DOI] [PubMed] [Google Scholar]
- 24.Laurberg S, Zimmer J. J Comp Neurol. 1980;190:627–650. doi: 10.1002/cne.901900403. [DOI] [PubMed] [Google Scholar]
- 25.Zimmer J, Gähwiler B H. J Comp Neurol. 1987;264:1–13. doi: 10.1002/cne.902640102. [DOI] [PubMed] [Google Scholar]
- 26.Dailey M E, Buchanan J, Bergles D E, Smith S J. J Neurosci. 1994;14:1060–1078. doi: 10.1523/JNEUROSCI.14-03-01060.1994. [DOI] [PMC free article] [PubMed] [Google Scholar]
- 27.Deisseroth K, Heist E K, Tsien R W. Nature (London) 1998;392:198–202. doi: 10.1038/32448. [DOI] [PubMed] [Google Scholar]
- 28.Claiborne B J, Amaral D G, Cowan W M. J Comp Neurol. 1986;246:435–458. doi: 10.1002/cne.902460403. [DOI] [PubMed] [Google Scholar]
- 29.Ryan T A, Smith S J. Neuron. 1995;14:983–989. doi: 10.1016/0896-6273(95)90336-4. [DOI] [PubMed] [Google Scholar]
- 30.Binder L I, Frankfurter A, Rebhun L I. J Cell Biol. 1985;101:1371–1378. doi: 10.1083/jcb.101.4.1371. [DOI] [PMC free article] [PubMed] [Google Scholar]
- 31.Kosik K S, Finch E A. J Neurosci. 1987;7:3142–3153. doi: 10.1523/JNEUROSCI.07-10-03142.1987. [DOI] [PMC free article] [PubMed] [Google Scholar]
- 32.Danscher G, Fjerdingstad E J, Fjerdingstad E, Fredens K. Brain Res. 1976;112:442–446. doi: 10.1016/0006-8993(76)90302-4. [DOI] [PubMed] [Google Scholar]
- 33.Raisman G, Ebner F F. Neuroscience. 1983;9:783–801. doi: 10.1016/0306-4522(83)90267-1. [DOI] [PubMed] [Google Scholar]
- 34.Frederickson C J, Kasarskis E J, Ringo D, Frederickson R E. J Neurosci Methods. 1987;20:91–103. doi: 10.1016/0165-0270(87)90042-2. [DOI] [PubMed] [Google Scholar]
- 35.Kennedy M B. Trends Neurosci. 1997;20:264–268. doi: 10.1016/s0166-2236(96)01033-8. [DOI] [PubMed] [Google Scholar]
- 36.Weisskopf M G, Zalutsky R A, Nicoll R A. Nature (London) 1993;362:423–427. doi: 10.1038/362423a0. [DOI] [PubMed] [Google Scholar]
- 37.Frey U, Huang Y Y, Kandel E R. Science. 1993;260:1661–1664. doi: 10.1126/science.8389057. [DOI] [PubMed] [Google Scholar]
- 38.Huang Y Y, Kandel E R, Varshavsky L, Brandon E P, Qi M, Idzerda R L, McKnight G S, Bourtchouladze R. Cell. 1995;83:1211–1222. doi: 10.1016/0092-8674(95)90146-9. [DOI] [PubMed] [Google Scholar]
- 39.Meyer-Franke A, Kaplan M R, Pfrieger F W, Barres B A. Neuron. 1995;15:805–819. doi: 10.1016/0896-6273(95)90172-8. [DOI] [PubMed] [Google Scholar]
- 40.Song H J, Ming G L, Poo M M. Nature (London) 1997;388:275–279. doi: 10.1038/40864. [DOI] [PubMed] [Google Scholar]
- 41.Ming G L, Song H J, Berninger B, Holt C E, Tessier-Lavigne M, Poo M M. Neuron. 1997;19:1225–1235. doi: 10.1016/s0896-6273(00)80414-6. [DOI] [PubMed] [Google Scholar]
- 42.Iyengar R. Science. 1996;271:461–463. doi: 10.1126/science.271.5248.461. [DOI] [PubMed] [Google Scholar]
- 43.Purves D, Snider W D, Voyvodic J T. Nature (London) 1988;336:123–128. doi: 10.1038/336123a0. [DOI] [PubMed] [Google Scholar]
- 44.Cabelli R J, Hohn A, Shatz C J. Science. 1995;267:1662–1666. doi: 10.1126/science.7886458. [DOI] [PubMed] [Google Scholar]
- 45.McAllister A K, Katz L C, Lo D C. Neuron. 1996;17:1057–1064. doi: 10.1016/s0896-6273(00)80239-1. [DOI] [PubMed] [Google Scholar]
- 46.Nguyen Q T, Parsadanian A S, Snider W D, Lichtman J W. Science. 1998;279:1725–1729. doi: 10.1126/science.279.5357.1725. [DOI] [PubMed] [Google Scholar]
- 47.Nguyen L B, Ricciardi T N, Malouf A T. Brain Res Dev Brain Res. 1996;95:184–193. doi: 10.1016/0165-3806(96)00090-9. [DOI] [PubMed] [Google Scholar]
- 48.Chicurel M E, Harris K M. J Comp Neurol. 1992;325:169–182. doi: 10.1002/cne.903250204. [DOI] [PubMed] [Google Scholar]
- 49.Hosokawa T, Rusakov D A, Bliss T V, Fine A. J Neurosci. 1995;15:5560–5573. doi: 10.1523/JNEUROSCI.15-08-05560.1995. [DOI] [PMC free article] [PubMed] [Google Scholar]
- 50.Kossel A H, Williams C V, Schweizer M, Kater S B. J Neurosci. 1997;17:6314–6324. doi: 10.1523/JNEUROSCI.17-16-06314.1997. [DOI] [PMC free article] [PubMed] [Google Scholar]
- 51.McKinney R A, Capogna M, Dürr R, Gähwiler B H, Thompson S M. Nat Neurosci. 1999;2:44–49. doi: 10.1038/4548. [DOI] [PubMed] [Google Scholar]
- 52.Maletic-Savatic M, Malinow R, Svoboda K. Science. 1999;283:1923–1927. doi: 10.1126/science.283.5409.1923. [DOI] [PubMed] [Google Scholar]
- 53.Dailey M E, Smith S J. J Neurosci. 1996;16:2983–2994. doi: 10.1523/JNEUROSCI.16-09-02983.1996. [DOI] [PMC free article] [PubMed] [Google Scholar]
- 54.Fiala J C, Feinberg M, Popov V, Harris K M. J Neurosci. 1998;18:8900–8911. doi: 10.1523/JNEUROSCI.18-21-08900.1998. [DOI] [PMC free article] [PubMed] [Google Scholar]
- 55.Min M Y, Rusakov D A, Kullmann D M. Neuron. 1998;21:561–570. doi: 10.1016/s0896-6273(00)80566-8. [DOI] [PubMed] [Google Scholar]
- 56.Engert F, Bonhoeffer T. Nature (London) 1997;388:279–284. doi: 10.1038/40870. [DOI] [PubMed] [Google Scholar]
- 57.Murthy V N. Curr Biol. 1997;7:R512–R515. doi: 10.1016/s0960-9822(06)00251-x. [DOI] [PubMed] [Google Scholar]
- 58.Scanziani M, Salin P A, Vogt K E, Malenka R C, Nicoll R A. Nature (London) 1997;385:630–634. doi: 10.1038/385630a0. [DOI] [PubMed] [Google Scholar]
- 59.Lichtman J W, Magrassi L, Purves D. J Neurosci. 1987;7:1215–1222. doi: 10.1523/JNEUROSCI.07-04-01215.1987. [DOI] [PMC free article] [PubMed] [Google Scholar]
- 60.Balice-Gordon R J, Lichtman J W. Nature (London) 1994;372:519–524. doi: 10.1038/372519a0. [DOI] [PubMed] [Google Scholar]
- 61.Colman H, Nabekura J, Lichtman J W. Science. 1997;275:356–361. doi: 10.1126/science.275.5298.356. [DOI] [PubMed] [Google Scholar]
- 62.Callaway E M, Katz L C. J Neurosci. 1990;10:1134–1153. doi: 10.1523/JNEUROSCI.10-04-01134.1990. [DOI] [PMC free article] [PubMed] [Google Scholar]
- 63.Callaway E M, Katz L C. Proc Natl Acad Sci USA. 1991;88:745–749. doi: 10.1073/pnas.88.3.745. [DOI] [PMC free article] [PubMed] [Google Scholar]
- 64.Dantzker J L, Callaway E M. J Neurosci. 1998;18:4145–4154. doi: 10.1523/JNEUROSCI.18-11-04145.1998. [DOI] [PMC free article] [PubMed] [Google Scholar]
- 65.Catalano S M, Shatz C J. Science. 1998;281:559–562. doi: 10.1126/science.281.5376.559. [DOI] [PubMed] [Google Scholar]


