

Abstract
Genetically encoded FRET-glucose nanosensors have proven to be useful for imaging glucose flux in HepG2 cells. However, the dynamic range of the original sensor was limited and thus it did not appear optimal for high throughput screening of siRNA populations for identifying proteins involved in regulation of sugar flux. Here we describe a hybrid approach that combines linker-shortening with fluorophore-insertion to decrease the degrees of freedom for fluorophore positioning leading to improved nanosensor dynamics. We were able to develop a novel highly sensitive FRET nanosensor that shows a 10-fold higher ratio change and dynamic range (0.05–11 mM) in vivo, permitting analyses in the physiologically relevant range. As a proof of concept that this sensor can be used to screen for proteins playing a role in sugar flux and its control, we used siRNA inhibition of GLUT family members and show that GLUT1 is the major glucose transporter in HepG2 cells and that GLUT9 contributes also, however to a lower extent. GFP fusions suggest that GLUT1 and 9 are preferentially localized to the plasma membrane and thus can account for the transport activity. The improved sensitivity of the novel glucose nanosensor increases the reliability of in vivo glucose flux analyses, and provides a new means for the screening of siRNA collections as well as drugs using high-content screens.
Keywords: GLUT, transporter, liver, blood, homeostasis
Introduction
Glucose levels are maintained within tight limits to ascertain sufficient energy supply to the brain and other peripheral organs and to prevent accumulation to toxic concentrations. Homeostasis is achieved by the hormones insulin and glucagon, affecting glucose uptake, release and metabolism in glucose-responsive tissues. The response of mammalian cells to fluctuations in glucose levels is of major relevance, since alterations are important for pathological conditions, i.e. obesity or type-2 diabetes. It is well established that yeast and other organisms use a complex set of signaling networks to control sugar flux, e.g. to acclimate uptake to availability and needs of the cell, however little is still known about the mechanisms that control glucose flux in glucose-responsive tissues in human cells [1]. Similar as in yeast, the human genome encodes more than 10 glucose uniporters (GLUTs) for uptake and release and several hexokinases for metabolism. Given that sugars serve as signaling molecules in many organisms, it is conceivable that besides the insulin/glucagon system it also influences other mechanisms to control sugar flux. The recent availability of large siRNA collections in combination with imaging based screening systems have enabled genome-wide screens for signaling components [2]. Similar screens could be performed if suitable high throughput detection systems would be available for glucose.
To monitor the glucose flux in living cells, a FRET glucose-imaging platform has recently been developed consisting of a set of sensors with different affinity for glucose. These glucose nanosensors exploit resonance energy transfer between a coupled pair of cyan and yellow fluorescent proteins (eYFP, eCFP) to detect conformational changes induced by sugar-binding [3] [4]. The glucose-binding domain was derived from chemotactic receptors of bacteria, namely the glucose/galactose binding protein of E. coli (MglB). A decrease in energy transfer was observed upon glucose binding for the first generation of FRET sensors [5]. While this sensor was used successfully to monitor glucose flux in the cytosol, nucleus and ER of COS-7 or HepG2 cells, both the range of FLIPglu-600μ (Fig. 1) as well as the signal-to-noise ratio (SNR) appear too limited and would thus reduce the discovery rate in high throughput screens for signaling components via siRNA [5].
Figure 1.
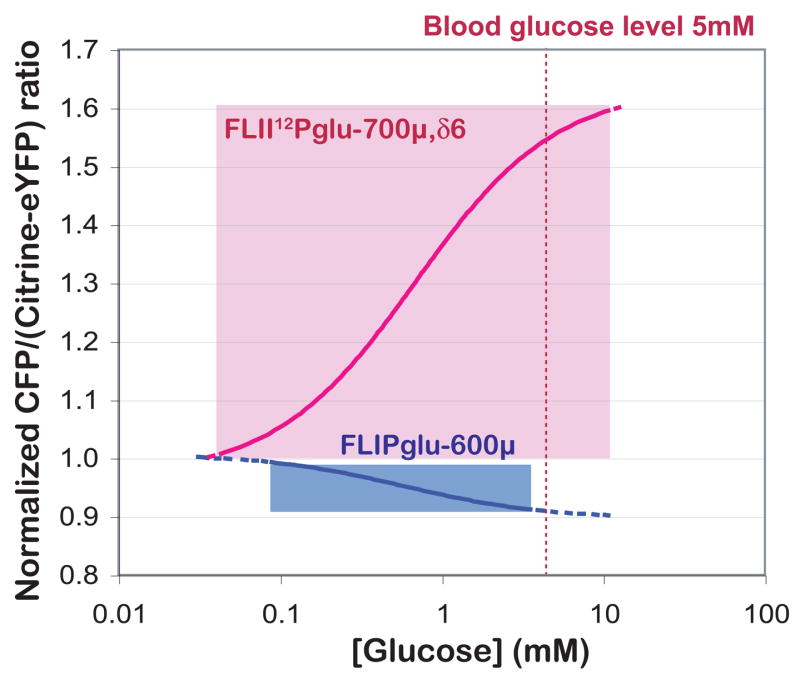
In vivo detection range of FLIP nanosensors. The detection range of FLII12Pglu-700μδ 6 (pink) and FLIPglu-600μ (blue) was determined using in vivo FRET measurements (shown in Fig. 3). The eCFP/(Ctrine-eYFP) emission ratio was normalized to the starting ratio. Baseline noise was ~0.1. The reliable concentration ranges of FLII12Pglu-700μδ6 and FLIPglu-600μ were 0.074 to 6.1 mM and 0.05 to 9.6 mM, respectively. The in vivo glucose concentration was calculated using the equation [gluc]cyt = Kd x (r - 1)/(Rmax - r). Rmax is the maximum ratio change; r is the ratio. The Kd was assumed to be identical as under in vitro conditions.
As a first step to make the sensors more robust, the Ph and chloride-sensitive eYFP was replaced by citrine [6]. Glucose sensors with improved SNR and a larger dynamic range had been developed by two approaches, namely linker deletions and by insertion of the fluorophore into the backbone of MglB with the rationale of decreasing the degrees of freedom of rotation of the fluorophores [7]. The artificial linker and less well-structured domains at the termini of MglB and eCFP and MglB and Citrine-eYFP variants (together comprising the “composite linker”) presumably allow flexible rotation of Citrine-eYFP and thus affect the probability of obtaining a productive resonance energy transfer [7]. Deletion of these domains lead to FLIPglu-600μ 13 which showed a over four times higher ratio change compared to the original sensor. The insertional sensor FLII12Pglu-600μ showed a >10 times higher ratio change over the original FLIPglu-600μ as determined in vitro. Here, the two strategies were combined to improve in vivo SNR and thus the detection range.
The improved FRET-sensors, which cover the physiological blood glucose range, were used to determine the contribution of GLUT glucose uniporters to glucose uptake in HepG2 cells using qPCR, GFP fusions as well as a GLUT siRNA collection in a small imaging-based screen. The results demonstrate the feasibility of high throughput screens using the novel FRET sensors and shows that GLUT1 and GLUT9 are the major contributors to glucose uptake in HepG2 cells.
Materials and Methods
Plasmid constructs
For in vitro protein assays, all FLII12Pglu-600μ series nanosensors were cloned in pRSET-B (Invitrogen). For mammalian cell imaging assays, FLII12Pglu-600μ FLII12Pglu-10aa, FLII12Pglu-15aa, FLII12D183A, FLII12Pglu-δ4 and FLII12Pglu-δ6 were transferred into pcDNA3.1(-) (Invitrogen) using BamHI and HindIII. To analyze the localization of GLUT1 and GLUT9, GLUT1-eGFP and GLUT9-eGFP were cloned into pENTR-TOPO (Invitrogen) using GLUT1-forward primer (CACCGGAGCCCAGCAGCAAGAAGCTG) and GLUT1-reverse primer (CACTTGGGAATCAGCCCCCAGGGGAT), GLUT9-forward primer (CACCTCACTGAGACCCATGGCAAGGAAACAAAA) and GLUT9-reverse primer (AGGCCTTCCATTTATCTTACCATCAGTG). An EcoRV site was inserted in 3’ of eGFP of pCMS-eGFP (Clontech) and mCherry [8] was cloned in BamHI and EcoRV in the modified pCMS-eGFP thereby removing eGFP (pCMS-mCherry). A Gateway cassette (restricted with KpnI, blunt-end treated with the Klenow polymerase fragment and subsequently restricted with SpeI) was inserted in the multiple cloning site of pCMS-mCherry (restricted with NotI, blunt-end treated with the Klenow polymerase fragment with dNTPs and subsequently restricted with NheI) resulting in pCMSmCherry-GATEWAY. The GLUT-eGFP fusions were subcloned into pCMSmCherry-GATEWAY using the Gateway BP reaction (Invitrogen).
Linker deletions for FLIPglu internally fused nanosensors
The linker and less well-structured domains between the termini of MglB and Citrine-eYFP (together comprising the 17 amino acid “composite linker”) were systematically deleted from the internally fused glucose nanosensor FLII12Pglu-600μ [7] using Kunkel mutagenesis [9]. 17 primers were used designed to delete increasing number of amino acid residues starting from the c-terminus of Mgl-B from FLII12Pglu-600μ creating FLII12Pglu-1aa through FLII12Pglu-17aa and to delete 4 and 6 amino acid residues Gly-Ala-Gly-Thr-Gly-Gly (ggcgccggtaccggtgga) of the plasmid derived linker between the MglB and Citrine-eYFP keeping the MglB and Citrine-eYFP intact (FLII12Pglu-δ4 and FLII12Pglu-δ6) (Fig. 2).
Figure 2.

FLII12Pglu series nanosensor with enhanced in vitro signal change. (A) FLII12Pglu construct consisting of N-terminal His-tag, N-terminal 12 amino acids of MglB (pink), eCFP (cyan), 13-304 amino acid of MglB (pink), a C-terminal composite linker, and Citrine-eYFP (yellow). (B) Top graph: Effect of number of amino acid deletion on Δratio change in 20 mM MOPS buffer. The Δratio of each nanosensor was determined by titration with glucose (0 – 100mM). Closed circles show deletion constructs, open circle shows synthetic linker deletion constructs, the open triangle shows the original nanosensor FLII12Pglu-600μ. Bottom graph: Effect of the number of amino acids deleted on Δratio change in Hanks’ balanced buffer (pH 7.4). (C) Correlation of Δratio change between in Hanks’ balanced buffer and artificial cytosol. Data were fitted by linear regression.
In vitro analysis of nanosensors
Constructs were transferred to E. coli BL21(DE3) Gold (Stratagene, USA) using electroporation, protein was extracted and purified as previously described [5]. Emission spectra and ligand titration curves were obtained using a monochromator microplate reader (Safire, Tecan, Austria; excitation 433/12nm; emission of eCFP: 528/12 nm; Citrine-eYFP: 485/12). Titrations were carried out in 20 mM MOPS pH 7. To compare the FLII12Pglu-600μ series, Citrine-eYFP emission intensity values for each protein was kept at ~20,000 RFU (emission gain 80). The nanosensors were also analyzed in Hanks’ balanced buffer (137 mM NaCl, 5.4 mM KCl, 0.3 mM Na2HPO4, 0.4 mM KH2PO4, 4.2 mM NaHCO3, 1.3 mM CaCl2, 0.5 mM MgCl2, 0.6 mM MgSO4, pH 7.4) or artificial mammalian cytosol (135 mM K-gluconate, 4 mM KCl, 12 mM NaHCO3, 0.8 mM MgCl2, 0.2 mM CaCl2; pH 7.2). The Kd of each nanosensor was determined by fitting to a single site binding isotherm: S = (r - rapo)/(rsat - rapo) = [gluc] / (Kd + [gluc]), where S is saturated-binding portion; [gluc], glucose concentration; r, ratio; rapo, ratio in the absence of glucose; and rsat, ratio at saturation with ligand. Normalized ratio changes were calculated from the function: rnorm = r / rapo. Measurements were performed with at least three independent protein extracts. eCFP emission is characterized by two peaks at 485 and 502 nm; the ratio was defined here as the fluorescence intensity at 528 nm divided by the intensity at 485 nm.
Cell culture and transfection
HepG2 cells were grown in DMEM with 10 % fetal calf serum and 50 U/ml penicillin and 50 μg/ml streptomycin (Invitrogen). Cells were cultured at 37°C and 5 % CO2. For siRNA analysis, stable cell lines expressing the nanosensor were generated using Lipofectamine2000TM (Invitrogen) transfection followed by selection on 400μg/ml geneticin for two weeks. For perfusion-imaging analysis, the transient FRET-sensor-transformed cells were cultured on round cover glasses (2.5 mm diameter) in 6-well plates. On the second day after transformation, the the cover glasses with the cells were mounted in a perfusion-chamber (Vacu-CellTM perfusion chambers, Mini Configuration, Thin Window Model VC-MPC-TW (C&L Instruments, Inc). For ImageXpress analysis, the stable FRET-sensor-transformed cells were grown on 96 well plates, siRNA from the ATP carbohydrate transporter siRNA library (Ambion) was transfected using siPORTTM NeoFXTM (Ambion) at final siRNA concentrations of 30 nM at cell density of 8000 cells/well. The siRNA concentration and cell density for the transfection was optimized with the help of the KDalert GAPDH Assay Kit (Ambion), allowing measurement of GAPDH enzymatic activity in siRNA treated cell lysates at excitation wavelength 560 nm and emission wavelength 590 nm in the fluorimeter. Cy3-negative control oligonucleotides (Ambion) were co-transformed to identify transfected cells.
FRET image analysis
Imaging was performed on an inverted fluorescence microscope (Leica DMIRE2; http://www.leica.com) with a Quant EM digital camera (Photometrics; http://www.photomet.com) and 40x/NA1.25–0.75-oil immersion lens (IMM HCxPL Apo CS). Dual emission intensity ratios were simultaneously recorded using a DualView unit with a Dual CFP/YFP-ET filter set (ET470/24m, ET535/30mChroma) and Metafluor 6.1r1 software (Universal Imaging). Excitation (filter ET430/24x Chroma) was provided by a Lambda DG4 light source (Sutter Instruments; http://www.sutter.com; 100 % lamp output). A high end imaging system as described here is not necessary for recording of the FRET data described here, e.g. the galvanometric mirror of the DG4 was not used for excitation, and Sensys or Coolsnap HQ cameras had previously been used to obtain high quality data with less sensitive nanosensors. Simpler systems (as described in Fehr et al., [5] [10] ) with more basic instrumentation such mercury lamps typically used for and less sensitive cameras are sufficient for the most applications. Images were acquired within the linear detection range of the camera at intervals of 5–10 s. Depending on expression level of different nanosensors, exposure time was typically 1000 ms with an EM gain of 3x at 10MHz. Perfusion was performed with Hanks’ balanced buffer at 1.0 ml/min in a vacuum chamber (Vacu-Cell VC-MPC-TW, C&L Instruments; http://www.fluorescence.com/) with a total volume of 50 μM using the ValveBank II perfusion system (AutoMate Scientific; www.autom8.com). The baselines throughout the experiment were corrected using a 3rd order polynomial fit of the ratios measured in the absence of glucose. Each experiment was measured in more than triplicate and a representative result is shown.
In vivo apparent flux K0.5
The in vivo apparent flux K0.5 of each nanosensor was determined by fitting to the Michaelis-Menten equation; r = [gluc] x Rmax / (K0.5 + [gluc]); [gluc] is the extracellular glucose concentration; r is the initial ratio change rate after glucose loading (Δratio/sec). To determine the initial flux rate in vivo, the initial accumulation rate was calculated from the time-dependent ratio plots during 2–10 sec after glucose loading.
siRNA screen on the ImageXpress
To analyze the effect of siRNA on glucose concentration change in HepG2 cells, ratio imaging was performed using an ImageXpress5000A (Molecular Devices). The eCFP, Citrine and Cy3 images were acquired by filter switching with ex-filter D436-20x / em-filter HQ480-40m / dichroic filter Q455D CLP, ex-filter D436-20x/ em-filter HQ535-30m / dichroic filter Q455D CLP, and ex-filter HQ560-50x / em-filter HQ645-75m / dichroic filter Q595LP, respectively with an exposure time of 100 ms at 15 sec intervals. Glucose (50 μL) was added at 1 and 2.5 min, to be desired final concentration (starting buffer volume was 100 μL). Cellular image analysis was performed using MetaXpress. Statistical significance was analyzed using the t-test for independent samples.
Confocal microscopy
HepG2 cells were transiently expressed with FLII12Pglu700μ-δ6, GLUT1-eGFP, GLUT9-eGFP, were imaged 24–48 hr after transfection by using a Nipkow spinning disk confocal microscope. Incident argon (488 nm) and krypton (458-nm) ion laser (Coherent, Inc.) beams were coupled to a modified Yokogawa spinning disk confocal scan head (Yokogawa Electric, Japan, and Solamere Technology) via an acoustical optical tunable filter (NEOS). The confocal head was mounted on an inverted microscope (DM IRE2; Leica, Germany) equipped with a 63x glycerol immersion objective (numerical aperture 1.3, HCX PL APO, 21°C; Leica, Germany) and a motorized Z-stage. Fluorescence images (band pass filters of 525/50 nm for yellow fluorescent protein Citrine-eYFP and 620/60 nm for mCherry) were acquired with a cooled on-chip multiplication gain Cascade 512B digital camera (Roper Scientific). Instrumentation was driven using Metamorph version 6.1r5 software (Universal Imaging Corp.).
RT-qPCR
Quantitative PCR (qPCR) to measure abundance of expression of GLUTs and β-actin was performed with cDNA of HepG2 and human liver. Total RNA was extracted from HepG2 cells using the RNAeasy kit (Qiagen). Human liver total RNA was purchased (Clontech). Reverse-transcriptase (RT) reactions were performed using the Protoscript kit (New England Biolabs) according to the manufacturer’s protocols. Real-time PCR was performed with a DNA Engine Opticon 2 system (MJ Research, Waltham, Mass.). qPCR involved a preliminary denaturation (10 min at 94°C), followed by 40 cycles of amplification and quantification (10 s at 94°C, 15 s at 55 to 58°C, and 15 s at 72°C, with a single fluorescence measurement), and an incubation of 10 min at 72°C, followed by a melting-curve program (65 to 95°C, with a heating rate of 0.2°C and continuous fluorescence measurements) using DyNAmo HS SYBR green qPCR kit (New England Biolabs). Primers were designed to be around 150–300bp for annealing to exon sequences with the lowest possible degree of homology to distinguish between the different GLUTs and β-actin.
Results
Development of dynamic FRET glucose sensors for in vivo analyses
To develop nanosensors better suited to measure glucose levels in the physiological range, the sensitivity and SNR were improved by systematic linker-shortening for the high sensitivity intramolecular FRET nanosensor FLII12Pglu-600μ [7]. The constructs were named FLII12Pglu-1aa through FLII12Pglu-17aa, with the number indicating the number of amino acids that were deleted by site-directed mutagenesis. Two additional constructs were generated in which MglB and Citrine-eYFP were kept intact and four or six amino acids of the synthetic linker were deleted yielding FLII12Pglu-δ4 and FLII12Pglu-δ6, respectively (Fig. 2A). Surprisingly, contrary to observations made when deleting sequences from the original terminally fused FLIPglu sensor [7], most of the FLII12Pglu deletion nanosensors showed a decreased Δratio compared to the original FLII12Pglu-600μ when titrated with glucose in vitro in 20 mM MOPS buffer. Only FLII12Pglu-δ4 and FLII12Pglu-δ6 showed ratio changes similar to FLII12Pglu-600μ (Fig. 2B top). No correlation was found between linker length and Δratio, suggesting that linker composition is more relevant than length, and that the relative position of the fluorophores may be important for FRET efficiency. Addition of glucose to purified protein resulted in a decrease in eCFP emission and an increase in Citrine-eYFP emission, suggesting that the binding of glucose to MglB results in a conformational change of FLII12Pglu-700μδ6. Spectra in the absence or in the presence of glucose show an isosbestic point at 520 nm (data not shown). The Hill coefficient for glucose is 1.0. The binding constant (Kd) for glucose was determined to be 660 ± 160 μM with a maximum normalized ratio change of 0.5 (Fig. 3B and Table I).
Figure 3.

In vivo and in vitro assay of FLII12Pglu series nanosensors. (A) Time dependent ratio change of HepG2 cells expressing the FLII12Pglu series nanosensors perfused with increasing external glucose concentrations. Boxes indicate the loading time of external glucose concentrations (mM) during continuous perfusion with Hanks’ balanced buffer. HepG2 cells expressing FLII12Pglu series nanosensors were perfused with gradually increasing concentration of external glucose (0.1 to 25 mM). After each glucose loading (2 min), glucose was withdrawn by perfusion with Hanks’ balanced buffer. FRET images were acquired every 10 sec (600 ms exposure time) and the cytosolic glucose change was analyzed (FLII12Pglu600μ magenta, FLII12Pglu-10aa red, FLII12Pglu-15aa green, FLII12D183A cyan, FLII12Pglu-δ4 yellow, FLII12Pglu-δ6 blue). (B) In vitro glucose binding titration curves of FLII12Pglu series nanosensors. Labeling as in (A). Data was fitted to a single site binding isotherm: S = (r - rapo)/(rsat - rapo) = [gluc] / (Kd + [gluc]), where S is saturated-binding portion; [gluc], glucose concentration; r, ratio; rapo, ratio in the absence of glucose; and rsat, ratio at saturation with glucose. (C) In vivo glucose apparent flux titration curve of FLII12Pglu series nanosensors. To determine the in vivo apparent Kd, the initial phase was plotted by using ratio change in 30 sec after glucose loading (Fig. 3A).
Table 1.
Comparison between in vitro Kd and in vivo apparent Kd
| In vitro Kd (μM) | In vivo apparent Kd (μM) [in vivo Δ normalized max ratio] | |
|---|---|---|
| FLII12Pglu-600μ | 583 ± 8.0 | 1060 ± 453 [0.166] |
| FLII 12Pglu-10aa | 1480 ± 82 | 405 ± 150 [0.338] |
| FLII 12Pglu-15aa | 2650 ± 260 | 1540 ± 1910 [0.072] |
| FLII 12Pglu-δ4 | 600 ± 64 | 1155 [0.093] |
| FLII 12Pglu-,δ6 | 660 ± 160 | 601± 44 [0.736] |
In vitro glucose binding Kd was determined to a single site binding isotherm; S = (r - rapo) / (rsat - rapo) = [gluc] / (Kd + [gluc]), where S is saturated-binding portion; [gluc], glucose concentration; r, ratio; rapo, ratio in the absence of glucose; and rsat, ratio at saturation with glucose.
In vivo glucose initial flux rate of FLII12Pglu series nanosensors. To compare the nanosensor’s function in vivo, the initial accumulation was plotted by using ratio change in 30 sec after glucose loading (Fig. 3A). The in vivo apparent Kd of each nanosensor was determined by r = [gluc] / (Kd + [gluc]).
The FRET sensors exploit protein conformation as a proxy for ligand concentrations; thus it is expected that other factors, which affect conformation or the fluorophores can affect the response. To identify the most robust nanosensor in this collection for in vivo applications, the effect of Hanks’ balanced buffer (pH 7.4) was assessed on the in vitro Δratio of each nanosensor (Fig. 2B bottom). Most of the deletion constructs showed a 20–70% decrease in Δratio in Hanks’ balanced buffer, while FLII12Pglu-δ4, FLII12Pglu-δ6, FLII12Pglu-10aa, FLII12Pglu-12aa and FLII12Pglu-15aa, showed a higher Δratio compared to FLII12Pglu-600μ. In addition, the effect of an artificial mammalian cytosolic solution (135 mM K-gluconate, 4 mM KCl, 12 mM NaHCO3, 0.8 mM MgCl2, 0.2 mM CaCl2; pH 7.2) on the nanosensor response was tested (Fig. 2C). Interestingly, both FLII12Pglu-δ4 and FLII12Pglu-δ6 were largely unaffected in 20 mM MOPS buffer (pH7.0) or Hanks’ balanced buffer (pH7.4), and there was a good correlation of Δratio between Hanks’ balanced buffer and artificial cytosol (Fig. 2B). FLII12Pglu-10aa was unaffected by Hanks’ balanced buffer and slightly affected in mammalian cytosol (10% decrease compared to FLII12Pglu-600μ). In contrast, FLII12Pglu-16aa showed a decrease of about 30% compared to FLII12Pglu-600μ in Hanks’ balanced buffer and mammalian cytosol, and in addition reversed the ratio in response to ions in Hanks’ balanced buffer. Of all nanosensors, FLII12Pglu-15aa was least affected by buffer composition and even showed an improved Δratio in Hanks’ balanced buffer and mammalian cytosol over that in 20 mM MOPS buffer (Fig. 2B). FLII12Pglu-δ6 has a >10 times higher ratio change over the original FLIPglu-600μ and is comparable to the FLII12Pglu-600μ and showed apparently the best robustness in all conditions (Fig. 2B). Therefore, we tested several intramolecular FRET nanosensor in addition to FLII12Pglu-δ6 in vivo using HepG2 cells.
Correlation of in vitro glucose binding affinity, Kd, and in vivo apparent glucose flux, K0.5
The five most promising nanosensors from the in vitro analysis were selected to determine whether the in vivo response was also improved over the original FLIPglu series, which showed in vivo ratio changes of 0.1–0.2. To determine the in vivo apparent glucose flux K0.5 of FLII12Pglu-600μ FLII12Pglu-10aa, FLII12Pglu-15aa, FLII12Pglu-δ6, FLII12Pglu-δ4, HepG2 cells expressing those FLII12Pglu series nanosensors were perfused with increasing concentrations of external glucose using a step protocol (Fig. 3A). The nanosensor response showed a biphasic behaviour. The in vivo apparent glucose flux K0.5 was determined from the slope of the first phase after each glucose-loading step (Fig. 3C, Table 1). FLII12Pglu-δ6 showed the highest dynamic ratio change in vivo, which corresponded to the in vitro glucose binding titration assay in artificial cytosolic buffer (Fig. 2C). Surprisingly, the in vivo ratio changes differed significantly for the different deletion variants. FLII12Pglu-D183A, which has a dramatically reduced binding affinity for glucose due to a D183A mutation, was used as an in vivo control. The absence of a response to 25 mM glucose demonstrated that the observed FRET changes are glucose specific (Fig. 3B). FLII12Pglu-700μδ6 showed apparent K0.5 = 600 μM in vivo and a Δratio (normalized) of 0.74 which is more than 3 times larger compared to the first generation glucose nanosensor FLIPglu-600μ [5]. Base-line noise was almost 0.1 as a normalized ratio by dividing with the initial ratio. The reliable detectable concentration range of FLII12Pglu-700μδ6 was improved from 0.074 – 6.1 mM to 0.05 – 9.6 mM compared to the range of FLIPglu-600μ because of increased the signal-to-noise ratio (Fig. 1).
To determine cytosolic glucose concentration dynamics, FLII12Pglu-700μδ6 was targeted to express in cytosol (Fig. 4A). FLII12Pglu-700μδ6 was expressed in cytosolic space excluding other organelles. HepG2 cells expressing FLII12Pglu-700μδ6 were perfused with gradually increasing concentration of external glucose (Fig. 4B). It was analyzed that FLII12Pglu-700μδ6 showed nanosensor saturation over 10 mM. It was shown that Michaelis-Menten fitting of cytosolic accumulation rate versus extracellular glucose concentration (K0.5 = 1.54 ± 0.30 mM, and Vmax was 3.91 ± 0.22 Δratio/min in Fig. 4C), which is comparable to GLUT1 affinity to D-glucose on plasma membrane [11].
Figure 4.
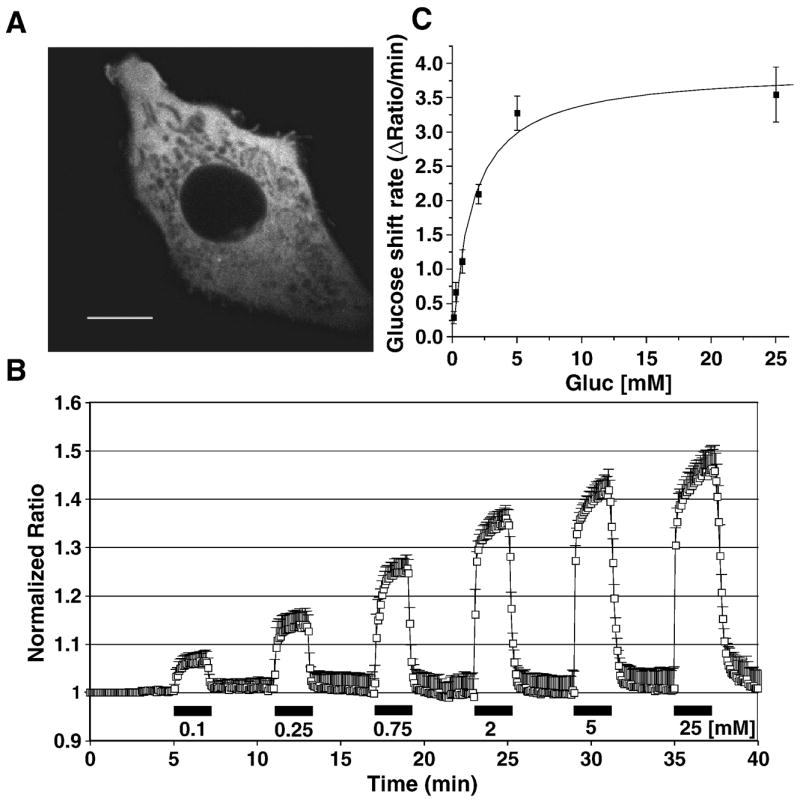
(A) Localization of the cytosolic FLII12Pglu-700μδ6 in HepG2 cells. Confocal images of the nanosensor FLII12Pglu-700μδ6 by eCFP excitation in the stably expressing cell line. Bar: 10 μm (83 pixels). (B) Ratio change of HepG2 cell expressing FLII12Pglu-700μδ6 in HepG2 cells perfused with increasing external glucose concentrations. Gray bars at the bottom of the trace indicate the duration and external glucose concentrations (mM) during perfusion with Hanks’ balanced buffer (mean ± SD, n = 5) (C) Michaelis-Menten kinetics of glucose flux measured by FLII12Pglu-700μδ6 in HepG2 cells.
Quantitative expression analysis of GLUTs in HepG2 and human liver cells
We have reported that most of GLUT members are expressed in HepG2 cells [12]. It is known that GLUT1 is highly expressed in HepG2 cells [13], while cancer liver cells loses GLUT2 levels even in the primary cultured cells [14]. To compare glucose transporter gene expression levels in the HepG2 and liver cells, the transcripts for GLUT1-13 were quantified by qPCR (Table 2). In human liver, GLUT2 has the highest expression level among GLUT members and GLUT8-10 are also expressed (GLUT2 ≫ GLUT10 > GLUT9 > GLUT8), while GLUT2 expression was reduced and GLUT1 and GLUT3 expressions were increased in HepG2 cells (GLUT1 ≫ GLUT3 > GLUT2 > GLUT9 > GLUT10).
Table 2.
Quantitative GLUT transcripts copy per beta-actin in HepG2 and human liver using RT-PCR
| HepG2 | Human Liver | |
|---|---|---|
| GLUT1 | 107 | 0.836 |
| GLUT2 | 3.98 | 54.6 |
| GLUT3,14 | 8.96 | 0.395 |
| GLUT4 | 0.959 | 1.55 |
| GLUT5 | ND. | ND. |
| GLUT6 | 0.597 | 0.968 |
| GLUT7 | ND. | ND. |
| GLUT8 | 0.437 | 2.21 |
| GLUT9 | 1.75 | 5.52 |
| GLUT10 | 1.64 | 12.9 |
| GLUT11 | 0.353 | 0.439 |
| GLUT12 | 0.058 | 0.576 |
| GLUT13 | 0.382 | 1.01 |
ND. : Data was not detected.
Each reaction was the average of two different RT reaction samples.
Effect of siRNA on glucose concentration steady state levels
To screen the silencing effect with siRNA for GLUT members and G6P-transporter, G6PT, on glucose concentration, we detected the glucose steady-state level alteration in HepG2 cells expressing FLII12Pglu-700μδ6 and siRNA (Fig. 5). Cy3-labeled negative control oligonucleotide was simultaneously transformed with siRNA to use as index to detect transformed cells, 3 different pictures (eCFPex/eCFPem, eCFPex/eYFPem, Cy3) were taken, and imaging was done in the cells in which the Cy3-red was detected (Fig. 5A). Glucose level was gradually increased with the stepwise glucose loading (Fig. 5B). There was significant reduction by GLUT1 and GLUT9 silencing in cytosolic glucose steady-state level in the presence of 0.5 mM and 20 mM glucose (Fig. 5C).
Figure 5. siRNA inhibition of GLUT-mediated glucose transport.
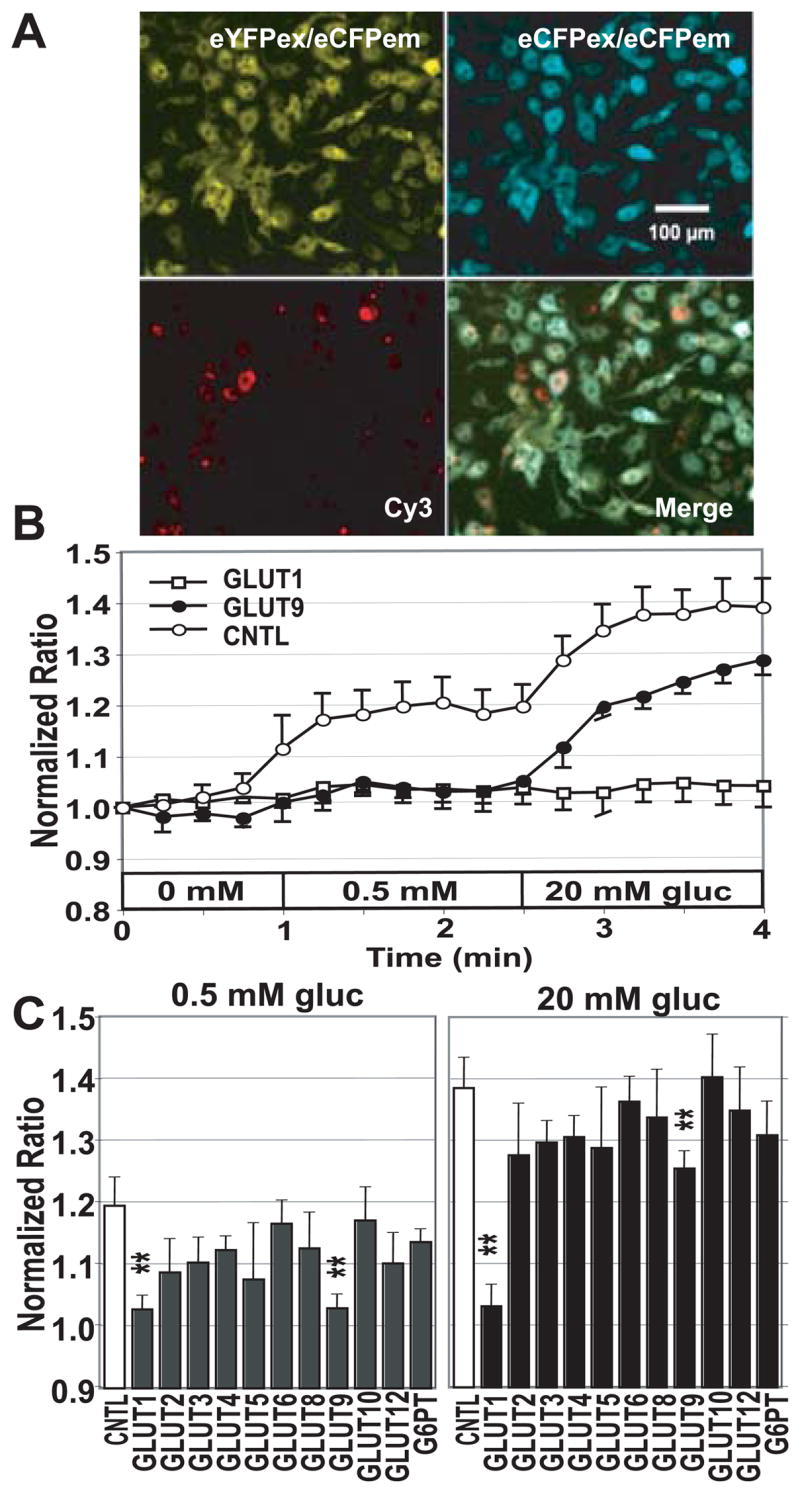
(A) Images of the cytosolic FLII12Pglu-700μδ6 in HepG2 cells. eCFPex/eCFPem, eCFPex/eYFPem, images of the nanosensor FLII12Pglu700μ-δ6 by eCFP excitation in the stably expressing cell line, and Cy3-labeled control oligonucleotide. Stably transfected HepG2 cells expressing FLII12Pglu700μ-™6 were cotransfected with siRNA and Cy3-labeled control oligonucleotides to identify transfected cells. Bar: 100 μm (50 pixels). (B) Effect of siRNA silencing on the FRET response after addition of 0.5 mM and 20 mM glucose using the ImageXpress. Representative time courses for siRNA treated cells are shown for GLUT1 and GLUT9 siRNAs. (C) Steady-state glucose levels were compared at different time points (0.5 min, 0 mM; 2 min, 0.5 mM; 3 min, 20 mM). Statistical analysis used Students t-test (n = 4 - 18, * P < 0.05, ** P < 0.01).
Subcellular localization of GLUT1-eGFP fusion proteins
To detect the subcellular localization, GLUT-eGFP fusions were used (Fig. 6). GLUT1-eGFP and GLUT9-eGFP were mainly localized in the plasma membrane in HepG2 cells. GLUT1-eGFP was also detected inside of the cells in addition to the plasma membrane. The N-terminal fused eGFP fusions couldn’t detect any fluorescence in HepG2 cells.
Figure 6.
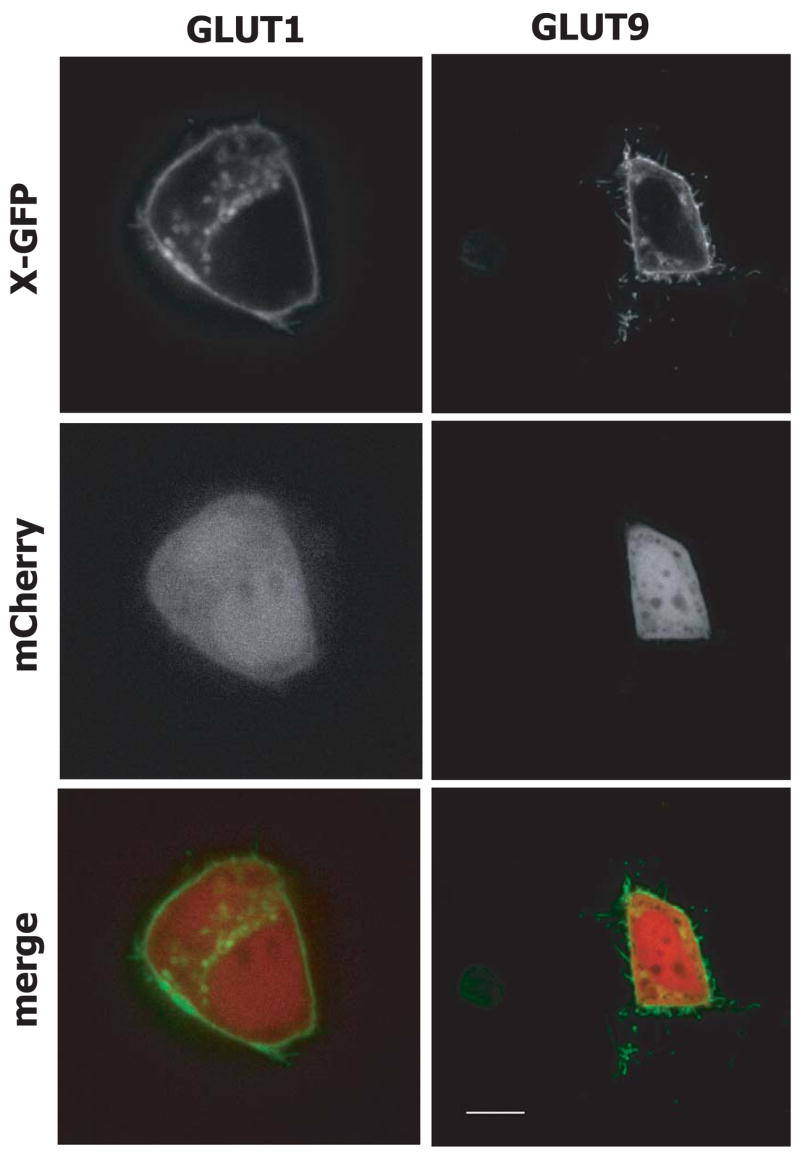
Localization of GLUT1-eGFP and GLUT9-eGFP fusion protein and cytosolic localized mCherry in HepG2 cells using spinning disk confocal microscopy. Bar: 10 μm (83 pixels).
Discussion
To be able to measure the effect of siRNA inhibition of GLUT glucose uniporters on glucose flux, a more robust and sensitive nanosensor was developed by combining the fluorophore-insertion strategy with a systematic linker-deletion strategy using the intramolecular glucose nanosensor FLII12Pglu-600μ as a base [7] (Fig. 2). The nanosensor FLII12Pglu-700μδ6 provided the highest in vivo ratio change, expanding the sensitivity as well as the detection range significantly (Fig. 1). This sensor was used to analyze the contribution of GLUT uniporters on glucose flux in HepG2 cells by siRNA inhibition. Consistent with the finding that GLUT1 is the most highly expressed glucose transporter gene, inhibition of GLUT1 lead to a strong reduction in glucose accumulation. Among the other GLUTs, only GLUT9 inhibition showed a partial effect on glucose flux. GFP-fusions indicated that both transporters localize primarily to the plasma membrane. These results suggest that the high sensitivity FLIP sensor is suitable for high throughput screening of siRNA collections for components involved in glucose signaling.
Sensor optimization
The original FLIP sensors provide a suitable system for analyzing analyte levels in cellular compartments in real time [5, 10, 15]. Analysis of the expected change in distance between the fluorophores and the observed ratio change suggested that factors other than distance contribute to the FRET change [3, 7]. Manipulations that reduced the degrees of rotational freedom of the fluorophores by tighter fusion of the binding proteins with the fluorophores or restriction of the rotational freedom by insertion of one fluorophore into surface-exposed loops of the binding protein had large effects on the observed FRET change [7]. Here, both strategies were combined using the intramolecular glucose nanosensor FLII12Pglu-600μ which is composed of the mature glucose/galactose-binding protein MglB from Escherichia coli into which eCFP had been inserted at position 12, and which is linearly fused via its C-terminus to the N-terminus of Citrine-eYFP using a 6-amino acid linker [7]. Fluorescent proteins comprise terminal regions, i.e. an N-terminal helix and a C-terminal coil, that are not required for folding or fluorescence [16]. Similarly, five amino acids may be deleted from the C-terminal region of MglB without affecting binding [7]. These “composite linker domains” together add up to 17 amino acids that may be deleted from FLII12Pglu-600μ. Systematic deletions gave an unexpected result; in contrast to the linearly fused FLIPglu-600μ in which deletions of few amino acids did not lead to an effect on the ratio change, already a single amino acid deletion from FLII12Pglu-600μ showed a significant decrease in the ratio change. Not the length of the linker, but the composition of the linker is apparently key to the ratio change. Thus the deletion analysis here is only a small sample of the possible variations of the composite linker (2017 combination). The finding that both fluorophores can be present on the same lobe of the recognition element, as is the case for some of the intramolecular FRET sensors [7] as well as for the phosphate and glutamate FRET sensors [17] [18], together with the finding that most unmodified sensors show a similar ratio although the distance change between the fluorophores as estimated from crystal structures is most compatible with a role of the dipole orientation for the signal.
To identify the nanosensor that is best suited for in vivo measurements, the series of FLIP deletion mutants was analyzed both under a variety of buffers as well as in vivo. The sensors showed widely different responses to various buffers and in vivo, suggesting that alterations in the surface properties of the binding protein or the fluorophores affects the ratio change. While these data do not provide new insights that may help devising a rational way to design FRET sensors, the empirical approach lead to the identification of FLII12Pglu-δ6, a highly robust sensor with a large in vivo ratio change, which is not only much more sensitive than the previous nanosensor FLIPglu-600μ but also has a much higher sensitivity and covers a much wider dynamic range.
Contribution of GLUTs to glucose flux
FRET metabolite sensors can be used to measure in vivo flux within a cellular compartment in real time. Factors that affect flux, i.e. uptake, release, synthesis, degradation and compartmentation of the analyte will be detectable as a change in either the rate of accumulation, the rate of elimination as well as the cytosolic steady-state level at a given external supply. HepG2 cells are derived from liver cells, and have been used as models for liver cell behavior. The cytosolic nanosensor FLII12Pglu-700μδ6 showed an in vivo saturation at above 10 mM external glucose supply.
The cytosolic glucose accumulation rate showed Michaelis-Menten kinetics with a half-maximal saturation K0.5 = 1.5 mM of extracellular glucose. This value corresponds well with the affinity of GLUT1 [11], the GLUT member most highly expressed in HepG2 cells at the RNA level (Table 2). Quantification of GLUT transcripts in HepG2 cells and human liver using RT-qPCR (Table 2) showed that GLUT1 and GLUT3 expression was induced in HepG2 cells, consistent with the observed upregulation of GLUT1 in malignant cells and associated with hypoxia-induced upregulation of GLUT1 and/or GLUT3 [19–21]. GLUT2 expression was reduced compared to normal liver, but was still higher than most of other GLUT members (except GLUT1). GLUT9 is expressed exclusively in gluconeogenic tissues such as kidney and liver, while expression is low in the small intestine [22] and a GLUT9-splice variant is upregulated in diabetes [23]. Interestingly, its pancreatic expression is regulated by glucose [24]. The physiological functions of GLUT9 as well as its transport properties are unknown.
RNA levels do not necessarily reflect the activity of an enzyme. We therefore analyzed the contribution of individual GLUTs to glucose flux using a set of siRNAs to inhibit glucose uptake. Among the twelve GLUT siRNAs tested for effects on glucose flux with the help of FLII12Pglu-700μδ6 using a high throughput-imaging platform, only GLUT1 and GLUT9 had a significant effect on glucose-induced FRET changes. Consistent with the high overexpression of GLUT1, GLUT1 siRNAs had a strong inhibitory effect on glucose-induced FRET increases. Interestingly, GLUT9 showed a partial effect on glucose flux. Consistent with the effect of siRNA inhibition, both GLUT1- and GLUT9-GFP fusions were found to localize mainly to the plasma membrane. These results demonstrate that GLUT9, although only lowly expressed can contribute to glucose flux. Moreover, the results are a proof-of-concept that siRNA screens can be performed using the new generation of FRET sensors to identify proteins that affect sugar flux.
Conclusion
Hepatic glucose concentration measurements are important in the context of pathological conditions such as diabetes. The improved sensitivity and dynamic range of the glucose nanosensor FLII12Pglu-700μδ6 provide a reliable means for analyzing glucose level analysis in vivo, e.g. in cell cultures, but probably also in intact organisms such as C. elegans, Drosophila, or zebra fish. The next step will be to test the effect of kinases and phosphatases, e.g. the serum and glucocorticoid-inducible SGK, which has been suggested to affect GLUT1 activity, on the overall sugar flux [25]. The new generation of FRET sensors is expected to help unravel open questions regarding sugar homeostasis and its regulation and provide a new means for the development of drugs using high-content screens.
Acknowledgments
We would like to thank Jason Wu and David Solow-Cordero (High-Throughput Bioscience Center (HTBC), Department of Chemical & Systems Biology, Stanford University School of Medicine) for their invaluable help in carrying out the siRNA screen. This work was made possible by grants to WBF from NIH (Roadmap Initiative “Metabolomics technology development” R33DK070272).
Abbrev
- FLIP
fluorescent indicator protein
- FLIIP
fluorescent intramolecular indicator protein
- FRET
fluorescence resonance energy transfer
- gluc
glucose
- CYT
cytosol
Footnotes
Publisher's Disclaimer: This is a PDF file of an unedited manuscript that has been accepted for publication. As a service to our customers we are providing this early version of the manuscript. The manuscript will undergo copyediting, typesetting, and review of the resulting proof before it is published in its final citable form. Please note that during the production process errors may be discovered which could affect the content, and all legal disclaimers that apply to the journal pertain.
References
- 1.Sanz P. Yeast as a model system to study glucose-mediated signalling and response. Front Biosci. 2007;12:2358–2371. doi: 10.2741/2238. [DOI] [PubMed] [Google Scholar]
- 2.Galvez T, Teruel MN, Heo WD, Jones JT, Kim ML, Liou J, Myers JW, Meyer T. siRNA screen of the human signaling proteome identifies the PtdIns(3,4,5)P3-mTOR signaling pathway as a primary regulator of transferrin uptake. Genome Biology. 2007;19:R142. doi: 10.1186/gb-2007-8-7-r142. [DOI] [PMC free article] [PubMed] [Google Scholar]
- 3.Deuschle K, Fehr M, Hilpert M, Lager I, Lalonde S, Looger LL, Okumoto S, Persson J, Schmidt A, Frommer WB. Genetically encoded sensors for metabolites. Cytometry Part A. 2005;64A:3–9. doi: 10.1002/cyto.a.20119. [DOI] [PMC free article] [PubMed] [Google Scholar]
- 4.Medintz IL. Recent progress in developing FRET-based intracellular sensors for the detection of small molecule nutrients and ligands. Trends Biotechnol. 2006;24:539–542. doi: 10.1016/j.tibtech.2006.10.008. [DOI] [PubMed] [Google Scholar]
- 5.Fehr M, Frommer WB, Lalonde S. Visualization of maltose uptake in living yeast cells by fluorescent nanosensors. Proceedings of the National Academy of Sciences of the United States of America. 2002;99:9846–9851. doi: 10.1073/pnas.142089199. [DOI] [PMC free article] [PubMed] [Google Scholar]
- 6.Griesbeck O, Baird GS, Campbell RE, Zacharias DA, Tsien RY. Reducing the environmental sensitivity of yellow fluorescent protein - Mechanism and applications. J Biol Chem. 2001;276:29188–29194. doi: 10.1074/jbc.M102815200. [DOI] [PubMed] [Google Scholar]
- 7.Deuschle K, Okumoto S, Fehr M, Looger LL, Kozhukh L, Frommer WB. Construction and optimization of a family of genetically encoded metabolite sensors by semirational protein engineering. Protein Science. 2005;14:2304–2314. doi: 10.1110/ps.051508105. [DOI] [PMC free article] [PubMed] [Google Scholar]
- 8.Shaner NC, Campbell RE, Steinbach PA, Giepmans BNG, Palmer AE, Tsien RY. Improved monomeric red, orange and yellow fluorescent proteins derived from Discosoma sp red fluorescent protein. Nat Biotechnol. 2004;22:1567–1572. doi: 10.1038/nbt1037. [DOI] [PubMed] [Google Scholar]
- 9.Kunkel TA, Roberts JD, Zakour RA. Rapid and Efficient Site-Specific Mutagenesis without Phenotypic Selection. Methods in Enzymology. 1987;154:367–382. doi: 10.1016/0076-6879(87)54085-x. [DOI] [PubMed] [Google Scholar]
- 10.Fehr M, Lalonde S, Lager I, Wolff MW, Frommer WB. In vivo imaging of the dynamics of glucose uptake in the cytosol of COS-7 cells by fluorescent nanosensors. J Biol Chem. 2003;278:19127–19133. doi: 10.1074/jbc.M301333200. [DOI] [PubMed] [Google Scholar]
- 11.Lodish H, Berk A, Zipursky LS, Matsudaira P, Baltimore D, Darnell J. Molecular Cell Biology. 4. Media Connected; New York: 2000. [Google Scholar]
- 12.Fehr M, Takanaga H, Ehrhardt DW, Frommer WB. Evidence for high-cavacity bidirectional glucose transport across the endoplasmic reticulum membrane by genetically encoded fluorescence resonance energy transfer nanosensors. Molecular and Cellular Biology. 2005;25:11102–11112. doi: 10.1128/MCB.25.24.11102-11112.2005. [DOI] [PMC free article] [PubMed] [Google Scholar]
- 13.Fukumoto H, Seino S, Imura H, Seino Y, Bell GI. Characterization and Expression of Human Hepg2 Erythrocyte Glucose-Transporter Gene. Diabetes. 1988;37:657–661. doi: 10.2337/diab.37.5.657. [DOI] [PubMed] [Google Scholar]
- 14.Kim JW, Ahn YH. CCAAT enhancer binding protein regulates the promoter activity of the rat GLUT2 glucose transporter gene in liver cells. Biochemical Journal. 1998;336:83–90. doi: 10.1042/bj3360083. [DOI] [PMC free article] [PubMed] [Google Scholar]
- 15.Fehr M, Lalonde S, Ehrhardt DW, Frommer WB. Live Imaging of glucose homeostasis in nuclei of COS-7 cells. Journal of Fluorescence. 2004;14:603–609. doi: 10.1023/b:jofl.0000039347.94943.99. [DOI] [PubMed] [Google Scholar]
- 16.Li XQ, Zhang GH, Ngo N, Zhao XN, Kain SR, Huang CC. Deletions of the Aequorea victoria green fluorescent protein define the minimal domain required for fluorescence. J Biol Chem. 1997;272:28545–28549. doi: 10.1074/jbc.272.45.28545. [DOI] [PubMed] [Google Scholar]
- 17.Okumoto S, Looger LL, Micheva KD, Reimer RJ, Smith SJ, Frommer WB. Detection of glutamate release from neurons by genetically encoded surface-displayed FRET nanosensors. Proceedings of the National Academy of Sciences of the United States of America. 2005;102:8740–8745. doi: 10.1073/pnas.0503274102. [DOI] [PMC free article] [PubMed] [Google Scholar]
- 18.Gu H, Lalonde S, Okumoto S, Looger LL, Scharff-Poulsen AM, Grossman AR, Kossmann J, Jakobsen I, Frommer WB. A novel analytical method for in vivo phosphate tracking (vol 580, pg 5885, 2006) FEBS Lett. 2007;581:579–579. doi: 10.1016/j.febslet.2006.09.048. [DOI] [PMC free article] [PubMed] [Google Scholar]
- 19.Yamamoto T, Seino Y, Fukumoto H, Koh G, Yano H, Inagaki N, Yamada Y, Inoue K, Manabe T, Imura H. Over-Expression of Facilitative Glucose Transporter Genes in Human Cancer. Biochemical and Biophysical Research Communications. 1990;170:223–230. doi: 10.1016/0006-291x(90)91263-r. [DOI] [PubMed] [Google Scholar]
- 20.Macheda ML, Rogers S, Best JD. Molecular and cellular regulation of glucose transporter (GLUT) proteins in cancer. Journal of Cellular Physiology. 2005;202:654–662. doi: 10.1002/jcp.20166. [DOI] [PubMed] [Google Scholar]
- 21.Postic C, Leturque A, Printz RL, Maulard P, Loizeau M, Granner DK, Girard J. Development and Regulation of Glucose-Transporter and Hexokinase Expression in Rat. American Journal of Physiology. 1994;266:E548–E559. doi: 10.1152/ajpendo.1994.266.4.E548. [DOI] [PubMed] [Google Scholar]
- 22.Phay JE, Hussain HB, Moley JF. Cloning and expression analysis of a novel member of the facilitative glucose transporter family, SLC2A9 (GLUT9) Genomics. 2000;66:217–220. doi: 10.1006/geno.2000.6195. [DOI] [PubMed] [Google Scholar]
- 23.Keembiyehetty C, Augustin R, Carayannopoulos MO, Steer S, Manolescu A, Cheeseman CI, Moley KH. Mouse glucose transporter 9 splice variants are expressed in adult liver and kidney and are up-regulated in diabetes. Molecular Endocrinology. 2006;20:686–697. doi: 10.1210/me.2005-0010. [DOI] [PubMed] [Google Scholar]
- 24.Evans SA, Corbett JA, Moley KH. Expression of GLUT9 in pancreatic beta cells-regulation by glucose. Diabetes. 2007;56:A28–A28. [Google Scholar]
- 25.Lang F, Henke G, Embark HM, Waldegger W, Palmada M, Bohmer C, Vallon V. Regulation of channels by the serum and glucocorticoid-inducible kinase-implications for transport, excitability and cell proliferation. Cell Physiol Biochem. 2003;13:41–50. doi: 10.1159/000070248. [DOI] [PubMed] [Google Scholar]