Abstract
There is increasing evidence that temporal factors are important in allowing cells to gain additional information from external factors, such as hormones and cytokines. We sought to discover how cell responses to glucocorticoids develop over time, and how the response kinetics vary according to ligand structure and concentration, and hence have developed a continuous gene transcription measurement system, based on an interleukin-6 (IL-6) luciferase reporter gene. We measured the time to maximal response, maximal response and integrated response, and have compared these results with a conventional, end point glucocorticoid bioassay. We studied natural glucocorticoids (corticosterone and cortisol), synthetic glucocorticoids (dexamethasone) and glucocorticoid precursors with weak, or absent bioactivity. We found a close correlation between half maximal effective concentration (EC50) for maximal response, and for integrated response, but with consistently higher EC50 for the latter. There was no relation between the concentration of ligand and the time to maximal response. A comparison between conventional end point assays and real-time measurement showed similar effects for dexamethasone and hydrocortisone, with a less effective inhibition of IL-6 seen with corticosterone. We profiled the activity of precursor steroids, and found pregnenolone, progesterone, 21-hydroxyprogesterone and 17-hydroxyprogesterone all to be ineffective in the real-time assay, but in contrast, progesterone and 21-hydroxyprogesterone showed an IL-6 inhibitory activity in the end point assay. Taken together, our data show how ligand concentration can alter the amplitude of glucocorticoid response, and also that a comparison between real-time and end point assays reveals an unexpected diversity of the function of glucocorticoid precursor steroids, with implications for human disorders associated with their overproduction.
Introduction
Glucocorticoid hormones exert a wide diversity of effects in target tissues. Their activity has been typically explored using a limited number of timed end points, both in vivo and in vitro, and using such approaches a variety of synthetic analogues have been developed for use in inflammatory conditions (Hillier 2007). Some agents, such as dexamethasone, show increased selectivity of action towards glucocorticoid pathways as opposed to mineralocorticoid (Hillier 2007).
It has recently become clear that even minor changes to the structure of a ligand can result in a distinct and unpredictable pattern of activity (Wang et al. 2006). However, the effects of a steroid can also be altered by varying its effective biological half-life, as for dexamethasone (Samtani & Jusko 2005, 2007). In vivo, the pharmacokinetics of steroids has been exploited to introduce topical activity, by, for example, making steroid structures susceptible to metabolism (e.g. budesonide; Ryrfeldt et al. 1982, Brunner et al. 2006, Singh et al. 2007).
It is now possible to track target gene promoter activity continuously, in real-time, without affecting cell viability. This approach allows, for the first time, temporal deconvolution of the effects of steroid, permitting robust measurement of the time to onset of effect, maximal effect, integrated effect and resolution phase. The luciferase reporter used in these studies is unstable, and hence luciferase activity is dependent on new gene transcription, a significant advantage over more stable reporter gene products, such as fluorescent proteins (Takasuka et al. 1998).
We have been able to establish a robust and sensitive assay of glucocorticoid action using the repression of interleukin-6 (IL-6) promoter activity. IL-6 is a physiologically relevant endogenous glucocorticoid receptor (GR) target gene and is important in both the innate immune response and the elaboration of the systemic response to inflammation (De Bosscher et al. 2005). We were able to show that three well-characterised glucocorticoid molecules all had the expected ability to repress IL-6 transcription, and that three closely related steroids did not. Furthermore, we were able to distinguish between the concentration–maximal response, the concentration-integrated response and the concentration-independent time to maximal response for each steroid. The expected rank order of steroid potency was not observed using this assay, as hydrocortisone was found to be significantly more active than either corticosterone or dexamethasone. This study emphasises the need to consider each specific effect of the steroid independently.
Materials and Methods
Plasmid construction
The promoter region of human IL-6 was amplified from human genomic DNA using the HiFi PCR kit (Roche) following the manufacturer's instructions. The primers were designed to amplify from within the transcriptional start site to the upstream promoter region yielding a 3000 bp fragment (IL-6). The primers for 3000 bp IL-6 product are as follows:
FWD primer (IL-6F1): 5′CAGATCCAGCAGCACAGGAAG3′
REV primer (IL-6R1): 5′GATAGAGCTTCTCTTTCGTTCC3′
Upon successful purification, the DNA was adenylated with the addition of an A overhang to the 3′-end, allowing for the subsequent ligation into the pCR2.1-TOPO subcloning vector (Invitrogen). Inserts ligated in the correct orientation in the TOPO TA vector were then cut out using restriction enzymes EcoRV and KpnI. This would allow the insert to be subsequently ligated in the destination vector, PGL4-basic (Promega), in the correct orientation due to the presence of the same restriction enzyme sites.
The PGL4-basic vector was digested using EcoRV and KpnI. Both the PCR fragments and the newly cut vector were then gel-extracted as before, and then each fragment was ligated into the PGL4-basic vector using T4 ligase (Roche). TOP 10 cells were transformed with the new constructs, and grown as a single colony expansion. The constructs were then isolated and purified using a MiniPrep Kit (Qiagen). The constructs were externally sequenced throughout the promoter fragment region (LARK Technologies, Thakeley, Essex, UK).
Cell culture and stable transfection
Rat-1 cells, a rat fibroblast cell line known to express glucocorticoid receptor, and to be glucocorticoid responsive, were cultured at 37 °C (5% CO2) in high-glucose Dulbecco's modified Eagle's medium; (DMEM; catalogue no. 11965-092, Gibco) supplemented with 10% FBS (Gibco), and a mixture of penicillin–streptomycin–glutamine (PSG from Gibco no. 10378-016).
Stable transfection of Rat-1 cells was performed using Fugene6 according to standard protocols. The transfected cells were selected in 200 ug/ml hygromycin for 2 weeks after which resistant clones were frozen at −80 °C until required for further experiments. No phenotypic changes or growth rate alterations were induced by the DNA construct.
End point luciferase assay
Approximately 1×10⁶ cells were seeded in a 35 mm dish 4 days before the experiment and allowed to grow to confluence. The medium was changed and drug treatments given. Treatments included dexamethasone (D1756; Sigma) with a final concentration range from 0·1 to 1000 nM, 5 ng/ml tumour necrosis factor α (TNFα; Calbio, Nottingham, UK), 1000 nM progesterone (Sigma–Aldrich), 1000 nM pregnenolone acetate (Sigma–Aldrich), 1000 nM of 21-hydroxyprogesterone-21-acetate (Sigma–Aldrich), 1000 nM corticosterone (Sigma–Aldrich), 1000 nM hydrocortisone and 1000 nM of 17-hydroxyprogesterone (Sigma–Aldrich).
After 24 h, luciferase assays were performed according to the manufacturer's instructions (Promega). Briefly, the medium was aspirated from the wells and 200 μl lysis buffer was added. To 100 μl lysate was added 50 μl beetle luciferin substrate (0·1 mM total luciferin) and the bioluminescence was measured using the Mithras LB940 automated analyser (Berthold Technologies East Grinstead, UK).
Real-time luciferase assay
Approximately 1×10⁶ cells were seeded in a 35 mm dish 4 days before the experiment and allowed to grow to confluence. The medium was then replaced with the real-time assay medium (serum-free DMEM without phenol red, catalogue no. 13000-021, Gibco) supplemented with bicarbonate (350 mg/l), 10% FBS and 10 mM HEPES (pH 7·2), antibiotics (25 units/ml penicillin, 25 μg/ml streptomycin) and 0·1 mM luciferin (Promega). The 35 mm Petri dishes are sealed with coverslips and silicon grease. The cells were assayed using a custom-made apparatus based on that developed by Takahashi et al. with luminescence measured using Hamamatsu photon counting modules (Yoo et al. 2004).
After 48 h, the cells were removed from the photomultiplier tube and treated with the compounds directly in the growth medium. The dishes were immediately resealed and replaced into the photomultiplier tubes. Treatments included dexamethasone (D1756; Sigma) with final concentration range from 0·1 to 1000 nM, 5 ng/ml TNFα (Calbio), 1000 nM progesterone, 1000 nM pregnenolone acetate, 1000 nM of 21-hydroxyprogesterone-21-acetate, 1000 nM corticosterone, 1000 nM hydrocortisone and 1000 nM of 17-hydroxyprogesterone.
Photomultiplier tube data analysis
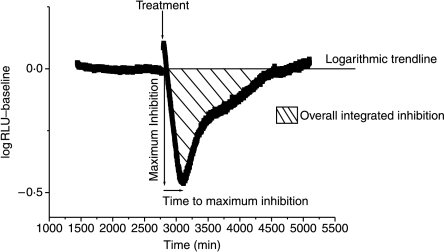
Data were analysed to determine the effects of the various drug treatments. A logarithmic trend line was fitted using the data obtained for 48 h before the commencement of treatment. This procedure removed any baseline non-stationarities from the data analysis. This trend line was then subtracted from the log values of the treatment period. The effect of compound treatment was calculated using deviation from the trend line (Fig. 1). The total level of induction/inhibition was calculated as the total sum of deviation from the trend line.
Figure 1.
Summary of data analysis using photomultiplier tubes. IL-6-luc gene expression is monitored in real time using photomultiplier tubes. A logarithmic baseline is fitted using relative light units (RLU) emitted from the IL-6-luc plasmid when not under the effect of drug treatment. This accounts for luciferase signal decay. The trend line is then subtracted from the log values of treatment period to identify drug-induced changes to IL-6-luc production. This analysis technique allows maximum inhibition, overall integrated inhibition and the time to maximum inhibition to be identified. The treatment was done using 100 nM dexamethasone.
Statistical analysis
Comparisons between groups were by ANOVA followed by Bonferroni's t-test.
Results
Kinetic deconvolution of glucocorticoid response
In analysing the effects of glucocorticoids ex vivo, a single end point is analysed at a limited number of time points. However, the integrated glucocorticoid effect is determined by both the amplitude of response and its duration. In order to track the glucocorticoid response in real time, a continuous, non-destructive cell-based assay was developed (Fig. 1). The cells remain viable in this environment for up to 10 days (data not shown), and the complete time course of glucocorticoid response can be followed, allowing an accurate measurement of the time to onset, duration, amplitude and integrated response (area under the curve) to be determined (Fig. 1).
TNFα effects on IL-6-luc in real-time
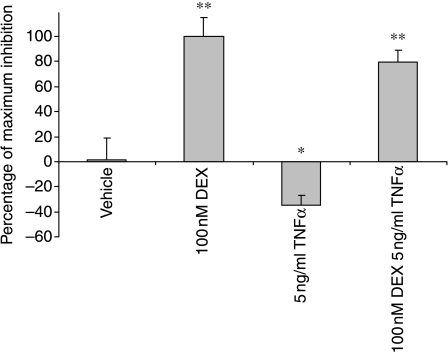
TNFα is a major physiological regulator of the IL-6 gene expression. To determine whether TNFα was also capable of appropriately regulating the IL-6-luc reporter cell, the effects of TNFα alone and those of dexamethasone were measured. TNFα did induce IL-6-luc activity (as shown by a negative inhibition on the graph), and this excursion was reversed by co-incubation with dexamethasone (Fig. 2).
Figure 2.
Effect of TNFα and dexamethasone on IL-6-luc expression. The cells were monitored for basal luciferase expression levels for 48 h, removed from photomultiplier tubes, and treated with 5 ng/ml TNFα and 100 nM dexamethasone, alone and in combination. The cells were then returned to PMTS and effects of the compounds on IL-6 promoter activity were monitored for 48 h. The overall integrated response (area under the fitted trend line) was calculated for the 48 h time period following treatment. Data from three independent experiments are presented as mean±s.d. *P<0·05 and **P<0·01 by comparison with vehicle treatment.
Dose–response of IL-6 response to glucocorticoid
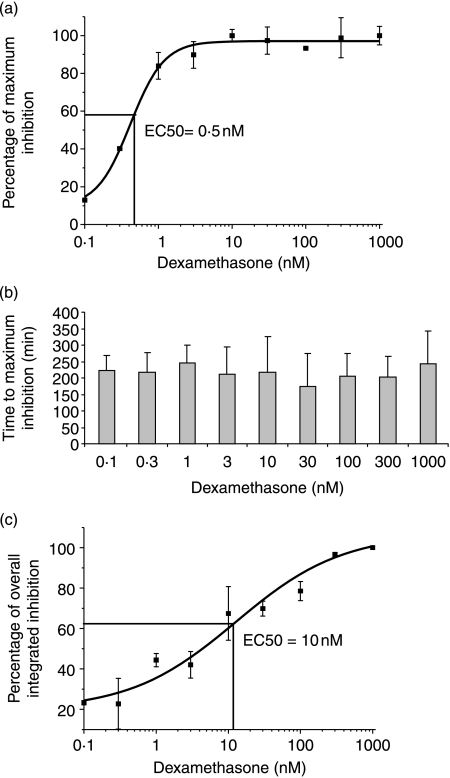
The concentration–maximal inhibition relationship for IL-6 inhibition was determined using the continuous measurement system (Fig. 3a), which allowed the calculation of EC50 (0·5 nM), compatible with the Kd value for GR binding to dexamethasone of ∼5 nM.
Figure 3.
(a) Dose–response of IL-6-luc rat-1 stables to dexamethasone treatment. The cells were monitored for basal luciferase expression levels for 48 h, removed from photomultiplier tubes and treated with various concentrations of dexamethasone or DMSO control. The cells were then returned to PMTS and effects of the drug on IL-6 promoter activity were monitored for 48 h. Maximum inhibition from the data trend line was used to calculate maximum effect. EC50 was calculated from the fitted curve. Data from three independent experiments are presented as mean±s.d. (b) Time to maximum inhibition. The time from dexamethasone treatment before maximum inhibition (maximum deviation from trend line) of IL-6-luc was measured. Data from three independent experiments are presented as mean±s.d. (c) The overall integrated inhibition of IL-6-luc after dexamethasone treatment. The overall integrated inhibition was calculated using the area under the curve approach from the fitted trend line over a period of 48 h after treatment with various concentrations of dexamethasone. Data from three independent experiments are presented as mean±s.d.
Time delay to maximal inhibition
An analysis of the IL-6-luc readout allowed the calculation of the time to maximal response. The effect of the varying concentrations of dexamethasone on this time-delay was determined and was found to be nearly identical irrespective of whether the concentration of dexamethasone was greater, or lesser than that of EC50 for response, in all cases being ∼200 min (Fig. 3b).
Concentration–overall inhibition response of IL-6 inhibition
In contrast to the lack of effect that different concentrations of dexamethasone had on time to maximal response, there was a clear concentration–overall inhibition response relationship as there was for the concentration–maximal response relationship. However, the EC50 for overall response (10 nM) was consistently higher than that for maximal response (0·5 nM; Fig. 3c).
Steroid specificity of IL-6 response
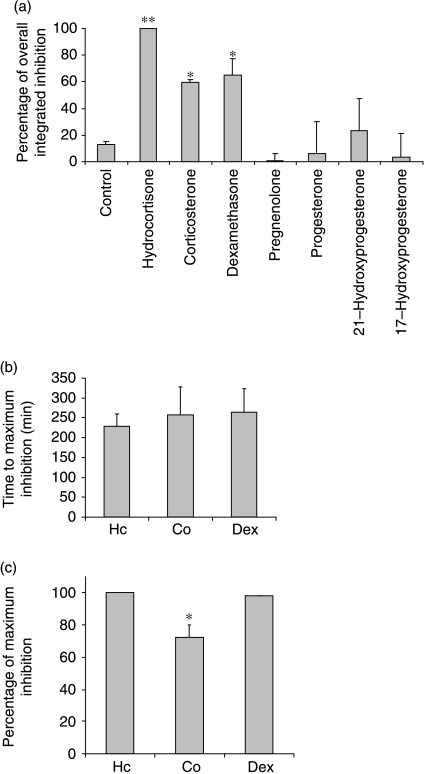
To confirm that the IL-6 response was specific to those steroids with proven agonist activity at the glucocorticoid receptor, a panel of steroids, including glucocorticoid precursors, was analysed. As expected, the three known agonists, hydrocortisone, corticosterone and dexamethasone, were all active in the assay, but hydrocortisone showed a significantly greater overall integrated inhibition than either dexamethasone or corticosterone (Fig. 4a). In contrast, 21-hydroxyprogesterone had a weak effect that failed to reach significance, and pregnenolone appeared to stimulate IL-6 promoter activity, as determined by an inverse excursion of the measurements from the logarithmic trend line (Fig. 4a). The time delay to maximal inhibition did not differ between the three agonists (Fig. 4b), but the maximal inhibition seen with corticosterone was less than that seen with either hydrocortisone or dexamethasone (Fig. 4c). The maximal response for the weak ligands (Fig. 4a) did not differ from that seen with vehicle, and therefore was not plotted (Fig. 4c).
Figure 4.
(a) The overall integrated inhibition of IL-6-luc by steroids. The cells were monitored for basal luciferase expression levels for 24 h, removed from photomultiplier tubes and treated with hydrocortisone, corticosterone, dexamethasone, pregnenolone, progesterone, 21-hydroxyprogesterone or 17-hydroxyprogesterone (1000 nM). A DMSO control was also included. The cells were then returned to PMTS and effects of the compounds on IL-6 promoter activity were monitored for 48 h. The overall integrated inhibition from fitted baseline was calculated for the 48 h time period following treatment. Results are displayed as percentage of maximum inhibition (hydrocortisone). Data from three independent experiments are presented as mean±s.d. *P<0·05 and **P<0·01 by comparison with vehicle treatment. (b) The time to maximum inhibition of IL-6-luc by steroids. The time to maximum inhibition of IL-6-luc after 1000 nM steroid treatment. Data from three independent experiments are presented as mean±s.d. Hc, hydrocortisone; Co, corticosterone; Dex, dexamethasone. (c) The maximum inhibition of IL-6-luc by glucocorticoid precursors. The level of maximum inhibition (largest deviation from baseline) was calculated as a percentage of the maximum inhibition induced by hydrocortisone. Data from three independent experiments are presented as mean±s.d. Hc, hydrocortisone; Co, corticosterone; Dex, dexamethasone. *P<0·05 compared with hydrocortisone.
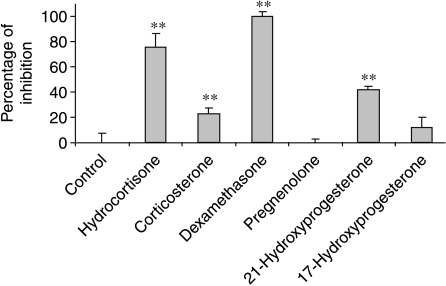
The activity of the steroids was also compared using an end point assay, with cells harvested at 24 h (Fig. 5). The maximal inhibition was seen with dexamethasone, therefore set as 100%. The conventional GR agonists, hydrocortisone and corticosterone, were both effective, although corticosterone was markedly less active. Pregnenolone and 17-hydroxy progesterone lacked a significant effect, but 21-hydroxyprogesterone significantly inhibited the IL-6-luc expression (Fig. 5).
Figure 5.
End point assay of inhibition of IL-6-luc after glucocorticoid precursor treatment. The cells were treated with hydrocortisone, corticosterone, dexamethasone, pregnenolone, 21-hydroxyprogesterone or 17-hydroxyprogesterone. A DMSO control was also included. After 24 h, the cells were harvested and an end point luciferase assay was performed. Inhibition was plotted as a percentage of the maximum inhibition induced by dexamethasone. Data from three independent experiments are presented as mean±s.d. **P<0·01 by comparison with vehicle treatment.
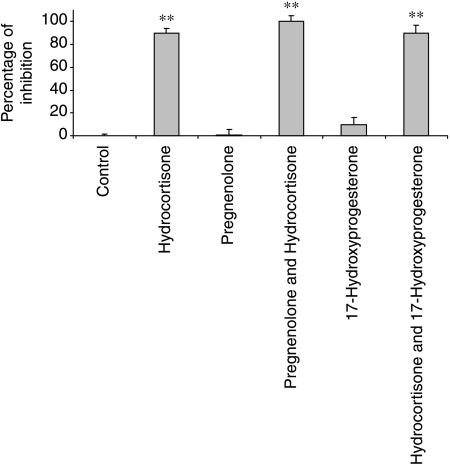
To determine whether pregnenolone or 17-hydroxyprogesterone had the glucocorticoid receptor antagonist activity, their effects on the hydrocortisone response were measured. There was no antagonist effect observed (Fig. 6).
Figure 6.
An investigation of the antagonistic effects of glucocorticoid precursors. The cells were treated with hydrocortisone, pregnenolone, progesterone or 17-hydroxyprogesterone, alone and in combination. A DMSO control was also included. After 24 h, the cells were harvested and an end point luciferase assay was performed. The level of maximum inhibition (largest deviation from baseline) was calculated as a percentage of the maximum inhibition. Data from three independent experiments are presented as mean±s.d. **P<0·01 by comparison with vehicle treatment.
Discussion
A major physiological role for glucocorticoids is limiting the extent of inflammatory reaction (McMaster & Ray 2007). This activity is mediated by the activated glucocorticoid receptor translocating to the nucleus, and interacting with other transcription factors and transcriptional modulators (Chen et al. 2001, Stevens et al. 2003, Garside et al. 2004, O'Malley 2005, McMaster & Ray 2007). In vivo target cells are subject to multiple input stimuli, with varying durations of action. In order to dissect out specific pathways, a reductionist approach using cell culture has been successfully employed; however, the selection of single end points in cross-sectional analysis may give an incomplete picture of the full, natural response to stimulation. For this reason, we developed a genetically engineered IL-6 reporter cell line suitable for a continuous, non-destructive monitoring of promoter activity. Previous attempts to generate a cell-based bioassay for glucocorticoids have relied on transactivation by the GR (Vermeer et al. 2003), even though this mode of GR action is not required for the most important physiological actions of glucocorticoids (Reichardt et al. 1998).
The reporter cells are robust and capable of survival in recording media for up to 10 days without detectable effects on cell viability. Over this period of time, the cells are sealed and the promoter activity monitored continuously as a result of exogenous luciferin present in the culture medium. This further enhances the responsiveness of the system by further shortening the half-life of the expressed luciferase (Takasuka et al. 1998). A preliminary analysis of the promoter response to glucocorticoid suggested a number of robust characteristics to the curve which could be measured, including the time to maximal inhibition, maximal inhibition and the overall integrated inhibition (area under the curve). We set out to measure these parameters in response to varying glucocorticoid concentration and also in response to different steroid structures.
The maximal inhibition–concentration response was the most sensitive to glucocorticoid, with the lowest measurable EC50. In contrast, the time to maximal inhibition showed a flat concentration–response curve, with no detectable effect of ligand dose. Interestingly, the EC50 for the overall inhibition–concentration response, that is the area under the dose–response curve, was consistently higher than that seen for maximal effect. An examination of the curves shows that the time to maximal effect is unaltered by concentration, but, importantly, the overall duration of response increased with higher ligand concentration, and hence resulted in an increased area under the curve.
In vivo glucocorticoids act to oppose the effects of TNFα, and indeed using the reporter cell system dexamethasone abolished the TNF response of the IL-6 promoter. This response pattern is typical of that seen using conventional end point, reporter gene assays, and provides additional reassurance that our real-time reporter gene approach authentically reports the underlying biological effect (De Bosscher et al. 2005).
Different molecular structures act on nuclear receptors to generate clearly distinct conformations of the receptor (Kauppi et al. 2003, Stevens et al. 2003, Garside et al. 2004). Therefore, we sought the effects of a panel of closely related steroid structures, some known to have agonist activity and others previously ascribed as being inactive. We were able to show that the three active glucocorticoids indeed had activity on our reporter cell line, although the characteristics of response were interesting. As predicted from the earlier dexamethasone concentration–response study, there was no effect of steroid structure on the time to maximal response. However, the overall inhibition was significantly greater with hydrocortisone than with either corticosterone or dexamethasone. This was unexpected as dexamethasone is conventionally viewed as having a greater potency due to its high binding affinity, and also to show a prolonged duration of action in vivo due to its greater stability (McCafferty et al. 1981, Rose et al. 1981, Toutain et al. 1984). This second mode of enhanced activity is unlikely to be relevant in the reporter cell line, which is not of a steroid metabolising cell type. Cell-based bioassays of glucocorticoids have also suggested that dexamethasone is more potent than hydrocortisone (Stevens et al. 2003, Vermeer et al. 2003). However, most analyses have focused on a transactivation-based bioassay, and it is now clear that different target templates show variable, and in many cases, unpredictable differential responsiveness to different glucocorticoid ligand structures (Stevens et al. 2003, Wang et al. 2006). Therefore, the differential potency of hydrocortisone may reflect a specific response to the final, ligand-directed structure of the hydrocortisone-bound GR, perhaps further modified by its interaction with the DNA-bound NFkB on the IL-6 promoter (Kauppi et al. 2003, Wang et al. 2006, So et al. 2007). In contrast, hydrocortisone and dexamethasone showed a similar maximal effect, both greater than that seen with corticosterone. This reflects the different shape of the response curve seen with the different ligands, and further emphasises the importance of timing in determining the measured response. Indeed, there is evidence from other transcription factors of major short-time frame variation of transcriptional regulation (Hoffmann et al. 2002).
The only precursor steroid to regulate the expression of the IL-6 reporter gene was 21-hydroxyprogesterone. This effect did not reach significance in the continuous reporter assay, but did in the end point assay. The ability of this steroid to activate the GR has not been reported before. Out of the glucocorticoid precursor steroids examined, none showed antagonist activity in this assay.
Resolving the temporal response of target cells to glucocorticoid has revealed a number of unexpected findings. There is a distinct difference in the EC50 for maximal effect (amplitude of response), compared with the higher EC50 seen for the overall, integrated response (area under the curve). There was no concentration effect for the time to maximal excursion from the trend line. Resolving the steroid response over time allows a comparison between different molecular species for these different parameters in a rapid and robust manner. This approach is expected to be useful for the correlation against the observed effects in vivo, on different target tissues and target genes.
In summary, we have developed and validated a new approach to measure steroid response in vivo. This allows an accurate, sensitive and robust profiling of steroid activity in real time. This approach has revealed an unexpected complexity in the relationship between steroid structure and concentration on the different measurable parameters of response.
Acknowledgements
This study was funded by the Arthritis Research Campaign, UK. The authors declare that there is no conflict of interest that would prejudice the impartiality of this scientific work.
References
- De Bosscher K, Vanden Berghe W, Beck IM, Van Molle W, Hennuyer N, Hapgood J, Libert C, Staels B, Louw A, Haegeman G. A fully dissociated compound of plant origin for inflammatory gene repression. PNAS. 2005;102:15827–15832. doi: 10.1073/pnas.0505554102. [DOI] [PMC free article] [PubMed] [Google Scholar]
- Brunner M, Ziegler S, Di Stefano AF, Dehghanyar P, Kletter K, Tschurlovits M, Villa R, Bozzella R, Celasco G, Moro L, et al. Gastrointestinal transit, release and plasma pharmacokinetics of a new oral budesonide formulation. British Journal of Clinical Pharmacology. 2006;61:31–38. doi: 10.1111/j.1365-2125.2005.02517.x. [DOI] [PMC free article] [PubMed] [Google Scholar]
- Chen H, Tini M, Evans RM. HATs on and beyond chromatin. Current Opinion in Cell Biology. 2001;13:218–224. doi: 10.1016/s0955-0674(00)00200-3. [DOI] [PubMed] [Google Scholar]
- Garside H, Stevens A, Farrow S, Normand C, Houle B, Berry A, Maschera B, Ray D. Glucocorticoid ligands specify different interactions with NF-κB by allosteric effects on the glucocorticoid receptor DNA binding domain. Journal of Biological Chemistry. 2004;279:50050–50059. doi: 10.1074/jbc.M407309200. [DOI] [PubMed] [Google Scholar]
- Hillier SG. Diamonds are forever: the cortisone legacy. Journal of Endocrinology. 2007;195:1–6. doi: 10.1677/JOE-07-0309. [DOI] [PubMed] [Google Scholar]
- Hoffmann A, Levchenko A, Scott ML, Baltimore D. The IκB-NF-κB signaling module: temporal control and selective gene activation. Science. 2002;298:1241–1245. doi: 10.1126/science.1071914. [DOI] [PubMed] [Google Scholar]
- Kauppi B, Jakob C, Farnegardh M, Yang J, Ahola H, Alarcon M, Calles K, Engstrom O, Harlan J, Muchmore S, et al. The three-dimensional structures of antagonistic and agonistic forms of the glucocorticoid receptor ligand-binding domain: RU-486 induces a transconformation that leads to active antagonism. Journal of Biological Chemistry. 2003;278:22748–22754. doi: 10.1074/jbc.M212711200. [DOI] [PubMed] [Google Scholar]
- McCafferty J, Brophy TR, Yelland JD, Cham BE, Bochner F, Eadie MJ. Intraoperative pharmacokinetics of dexamethasone. British Journal of Clinical Pharmacology. 1981;12:434–436. doi: 10.1111/j.1365-2125.1981.tb01243.x. [DOI] [PMC free article] [PubMed] [Google Scholar]
- McMaster A, Ray DW. Modelling the glucocorticoid receptor and producing therapeutic agents with anti-inflammatory effects but reduced side-effects. Experimental Physiology. 2007;92:299–309. doi: 10.1113/expphysiol.2006.036194. [DOI] [PubMed] [Google Scholar]
- O'Malley BW. A life-long search for the molecular pathways of steroid hormone action. Molecular Endocrinology. 2005;19:1402–1411. doi: 10.1210/me.2004-0480. [DOI] [PubMed] [Google Scholar]
- Reichardt HM, Kaestner KH, Tuckermann J, Kretz O, Wessely O, Bock R, Gass P, Schmid W, Herrlich P, Angel P, et al. DNA binding of the glucocorticoid receptor is not essential for survival. Cell. 1998;93:531–541. doi: 10.1016/s0092-8674(00)81183-6. [DOI] [PubMed] [Google Scholar]
- Rose JQ, Yurchak AM, Meikle AW, Jusko WJ. Effect of smoking on prednisone, prednisolone, and dexamethasone pharmacokinetics. Journal of Pharmacokinetics and Biopharmaceutics. 1981;9:1–14. doi: 10.1007/BF01059339. [DOI] [PubMed] [Google Scholar]
- Ryrfeldt A, Andersson P, Edsbacker S, Tonnesson M, Davies D, Pauwels R. Pharmacokinetics and metabolism of budesonide, a selective glucocorticoid. European Journal of Respiratory Diseases. 1982;122:86–95. [PubMed] [Google Scholar]
- Samtani MN, Jusko WJ. Comparison of dexamethasone pharmacokinetics in female rats after intravenous and intramuscular administration. Biopharmaceutics and Drug Disposition. 2005;26:85–91. doi: 10.1002/bdd.435. [DOI] [PMC free article] [PubMed] [Google Scholar]
- Samtani MN, Jusko WJ. Quantification of dexamethasone and corticosterone in rat biofluids and fetal tissue using highly sensitive analytical methods: assay validation and application to a pharmacokinetic study. Biomedical Chromatography. 2007;21:585–597. doi: 10.1002/bmc.788. [DOI] [PMC free article] [PubMed] [Google Scholar]
- Singh D, Tutuncu A, Lohr I, Carlholm M, Polanowski T. Budesonide administered using chlorofluorocarbon and hydrofluoroalkane pressurized metered-dose inhalers: pharmacokinetics, pharmacodynamics and clinical equivalence. International Journal of Clinical Pharmacology and Therapeutics. 2007;45:485–495. doi: 10.5414/cpp45485. [DOI] [PubMed] [Google Scholar]
- So AY, Chaivorapol C, Bolton EC, Li H, Yamamoto KR. Determinants of cell- and gene-specific transcriptional regulation by the glucocorticoid receptor. PLoS Genetics. 2007;3:e94. doi: 10.1371/journal.pgen.0030094. [DOI] [PMC free article] [PubMed] [Google Scholar]
- Stevens A, Garside H, Berry A, Waters C, White A, Ray D. Dissociation of steroid receptor coactivator 1 and nuclear receptor corepressor recruitment to the human glucocorticoid receptor by modification of the ligand-receptor interface: the role of tyrosine 735. Molecular Endocrinology. 2003;17:845–859. doi: 10.1210/me.2002-0320. [DOI] [PubMed] [Google Scholar]
- Takasuka N, White MR, Wood CD, Robertson WR, Davis JR. Dynamic changes in prolactin promoter activation in individual living lactotrophic cells. Endocrinology. 1998;139:1361–1368. doi: 10.1210/endo.139.3.5826. [DOI] [PubMed] [Google Scholar]
- Toutain PL, Brandon RA, de Pomyers H, Alvinerie M, Baggot JD. Dexamethasone and prednisolone in the horse: pharmacokinetics and action on the adrenal gland. American Journal of Veterinary Research. 1984;45:1750–1756. [PubMed] [Google Scholar]
- Vermeer H, Hendriks-Stegeman BI, van den Brink CE, van der Saag PT, van der BB, Buul-Offers SC, Jansen M. A novel specific bioassay for the determination of glucocorticoid bioavailability in human serum. Clinical Endocrinology. 2003;59:49–55. doi: 10.1046/j.1365-2265.2003.01793.x. [DOI] [PubMed] [Google Scholar]
- Wang JC, Shah N, Pantoja C, Meijsing SH, Ho JD, Scanlan TS, Yamamoto KR. Novel arylpyrazole compounds selectively modulate glucocorticoid receptor regulatory activity. Genes and Development. 2006;20:689–699. doi: 10.1101/gad.1400506. [DOI] [PMC free article] [PubMed] [Google Scholar]
- Yoo SH, Yamazaki S, Lowrey PL, Shimomura K, Ko CH, Buhr ED, Siepka SM, Hong HK, Oh WJ, Yoo OJ, et al. PERIOD2::LUCIFERASE real-time reporting of circadian dynamics reveals persistent circadian oscillations in mouse peripheral tissues. PNAS. 2004;101:5339–5346. doi: 10.1073/pnas.0308709101. [DOI] [PMC free article] [PubMed] [Google Scholar]


