

Abstract
Quantitative changes in cytochrome P450 (CYP) proteins involved in drug metabolism as a consequence of drug treatment are important parameters in predicting the fates and pharmacological consequences of xenobiotics and drugs. In this study we undertake comparative P450 proteomics using liver from control and 1,4 bis 2-(3,5-dichloropyridyloxybenzene) (TCPOBOP)-dosed mice. The method involved separation of microsomal proteins by SDS-PAGE, trypsin digestion and post-digest 18O/16O-labeling, followed by nano-liquid chromatography coupled to tandem mass spectrometry (LC-MS/MS) for peptide identification, and LC-MS for relative quantification. Seventeen P450 proteins were identified from mouse liver, of which sixteen yielded data sufficient for relative quantification. All the P450s detected were unambiguously identified except the highly homologous CYP2A4/2A5. With the exception of CYP2A12, 2D10 and 2F2, the levels of all the P450s quantified were affected by treatment with TCPOBOP (3 mg/kg). CYP1A2, 2A4/5, 2B10, 2B20, 2C29, 2C37, 2C38, 3A11 and 39A1 were up-regulated, and CYP2C40, 2E1, 3A41 and 27A1 down-regulated. The response of CYP2B20 to stimulation has not previously been distinguished from that of CYP2B10 because of the poor discrimination between these two proteins (they share 87% sequence identity). Differential response to chemical stimulation by closely related members of the CYP2C subfamily was also observed.
Introduction
The cytochromes P450 (P450s or CYPs) are a superfamily of mixed-function oxidases, members of which are present in virtually all living organisms. P450s are characterized into families and sub-families by their sequence similarities. Currently, there are over 360 families and more than 3100 sequenced and named enzymes; these numbers are continuing to increase. In human there are 57 putatively functional P450 genes, while in mouse there are 102 such genes (http://drnelson.utmem.edu/CytochromeP450.html). P450s are thought to have evolved, in part, as a protective adaptive response against the toxic effects of environmental chemicals1. They are the most important drug metabolizing enzymes in mammals, and, in humans are responsible for the phase I metabolism of 70-80% of all clinically used drugs2. In addition to their detoxification role, P450s can also be responsible for the conversion of chemical toxins and procarcinogens to their toxic or carcinogenic forms3. The ability of P450s to activate chemical toxins has been exploited in cancer chemotherapy, where several anticancer drugs, including cyclophosphamide, ifosphamide, dacarbazine and AQ4N are known to be metabolically activated by P450 isoforms to their respective cytotoxic species4. A method that would enable not only the non-selective identification of the P450 enzymes present in diseased tissue, but also the quantification of expression levels relative to that of surrounding normal tissue, would provide invaluable information regarding the metabolic fate of the selected drugs and hence the outcome of therapy.
Traditional approaches to the analysis of P450 enzymes rely on immunoblotting, activity assays, and the detection of P450 mRNA. These techniques have significant limitations: not only do they require pre-selection of the P450 enzymes to be investigated, so that if an unknown or unexpected P450 were present in a sample it would be overlooked, but they are unable to provide reliable quantitative information. Immunoblotting, whilst being very sensitive, relies on the availability of enzyme-specific antibodies; this specificity can be confounded by the high degree of sequence homology between members of the same subfamily. After pre-selection of the P450s to be investigated, each enzyme must be identified in turn. Since different P450 enzymes exhibit a broad, and often overlapping substrate specificity, activity assays that are designed to interrogate the activity of a P450 enzyme may not be totally enzyme-specific; in addition, multiple analysis techniques are invariably required, since different assays must be developed for different target substrates. Measurement at the expression level is fraught with uncertainty since the presence and abundance of a particular type of mRNA does not necessarily infer the presence and abundance of the corresponding protein5-7.
Over the last 10 years, mass spectrometry (MS)-based proteomics has become an indispensable tool for the analysis of proteins in biological samples. Quantification in MS-based proteomics is most effectively achieved by the use of stable isotope dilution, which makes use of the fact that two analytes differing only in stable isotope composition will be chemically almost identical, yet can be differentiated in a mass spectrometer due to their mass differences. Several analytical approaches exist for quantification using stable isotopes; broadly, these approaches fall into four categories. Stable isotopes can be incorporated (i) metabolically, as in the SILAC approach8, or (ii) chemically, as in the iTRAQ9 and ICAT10 methods. (iii) Isotopically labeled synthetic peptides/proteins that are specific to the protein(s) of interest can be spiked into samples prior to or in combination with enzymatic digestion (AQUA/QCAT11;12), or (iv) stable isotopes can be incorporated enzymatically using trypsin, Glu-C or Lys-N13-15. While methods (i), (ii) and (iv) provide relative quantitative data, this can be put on an absolute scale for defined proteins by the additional incorporation of (iii).
Previously, we have demonstrated the use of sodium dodecyl sulfate polyacrylamide gel electrophoresis (SDS-PAGE) in combination with reversed phase liquid chromatography coupled to electrospray tandem mass spectrometry (LC-ES-MS/MS) for the identification of multiple P450 proteins16;17. One of the main advantages of this approach is the molecular mass-based separation provided by SDS-PAGE, which allows proteins only from the molecular mass region of the P450s to be selected for analysis. The objective of the current study was to combine this qualitative approach with stable isotope labeling in order to develop a method that would allow the relative quantification of P450s in healthy and cancerous tissue. Metabolic labeling approaches are not feasible for the analysis of human samples. Amino-acid specific labeling methods, such as ICAT, are restricted to the analysis of amino acid-specific peptides. Such a procedure would inherently limit differentiation between P450 enzymes with high sequence similarity. The iTRAQ approach (when performed on the peptide level) is not compatible with the use of gel electrophoresis because the peptide-reactive group utilized in the tagging chemistry also reacts with other amine-containing moieties (for example, acrylamide, Tris buffer, ammonium bicarbonate). AQUA and QCAT, whilst providing absolute quantification, restrict analysis to one protein per peptide; in addition, they suffer from the same limitation as Western blotting: in that it is necessary to pre-select the proteins to be analyzed.
Differential labeling with 18O has been applied to the quantitative analysis of proteins digested with trypsin in solution14;18 and has recently been shown to be compatible with gel-digested proteins19. The technique has several advantages over other isotopic labeling techniques. All tryptic peptides can be labeled, and all peptides increase by the same mass. Because peptides are enzymatically labeled, side reactions that are inherent to chemical labeling experiments are avoided. In this study we used immobilized trypsin and 18O-labelled water for post-digest labeling of tryptic peptides after extraction from SDS-PAGE gels. Using this method, two atoms of 18O are incorporated into the C-terminus of tryptic peptides. The use of immobilized trypsin, which can subsequently be removed from the sample, allows for higher trypsin concentrations without overwhelming samples with intact soluble trypsin and its autolysis products; the high concentration of trypsin compensates for the slower 18O incorporation rates for some peptides. Initially, validation experiments were performed using recombinant P450s and human liver microsomes applied to SDS-PAGE gels in known amounts. The efficiency of the labeling reaction was assessed using recombinant CYP3A4 applied to SDS-PAGE gels. Comparative P450 proteomics were then performed using an animal model, in which human tumors are grown on immune-deficient mice20. The compound 1,4 bis 2-(3,5-dichloropyridyloxybenzene) (TCPOBOP) has been shown to induce profound expression of human P450s in the animal model20. Although we saw no evidence of this in the current study, in future work we will exploit 18O labeling to asses the induction of P450s in these mice in response to a panel of other P450 inducing agents. Relative quantification was performed using liver from control and TCPOBOP-dosed mice. Two labeling experiments were performed; in the first (forward labeling) experiment the treated sample was labeled with 18O, and in the second (reverse labeling) experiment the untreated sample was labeled with 18O. This approach should ensure that no bias is introduced into the results from peptides that may be resistant to trypsin-catalysed 18O exchange. Finally, the proteomic results for two CYP proteins, one found to be up-regulated by TCPOBOP and the other down-regulated, were confirmed by Western blot analysis.
Materials and Methods
Materials
Human recombinant P450 enzymes CYP2E1 and CYP3A4 were purchased from PanVera (Invitrogen, Paisley, UK). Immobilized trypsin, immobilized trypsin buffer (containing 50 mM Tris-HCl, pH 8, 50 mM CaCl2) and 18O water (≥ 97% 18O content) were from the Prolytica™ 18O labeling kit manufactured by Stratagene (La Jolla, CA, USA); extra 18O water (95% 18O content) was purchased from Sigma Chemical Company (Poole, Dorset, UK). Anti-CYP1A2 and anti-CYP2E1 primary antibodies were from Abcam (Cambridge, UK).
Animal work
Nu-Nu mice were maintained and all experiments undertaken in accordance with criteria outlined in a license granted under the Animals (Scientific Procedures) Act 1986, and approved by the ethics committee of the University of Bradford. Xenograft tumor (DLD-1 human colon adenocarcinoma) were transplanted subcutaneously in the flanks of 6-8 week old female Nu-Nu mice and allowed to develop for 3-4 weeks. TCPOBOP was administered intraperitoneally in 10% DMSO/arachis oil at 3 mg/kg, with the mice sacrificed 4 days later. Control mice were administered 10% DMSO/arachis oil only. Livers were taken from TCPOBOP-treated and control mice. As hepatic microsomal P450 content is at the nmol/mg-protein level, it is not necessary to pool liver samples. Further, as mice were bred to be genetically identical, no benefit is to be gained by analyzing microsomal proteins from a population of mice of the same genotype.
Preparation of microsomes
Human liver microsomes used for validation of the technique were prepared previously16. Mouse liver microsomes were prepared using differential centrifugation as follows: tissue from control and TCPOBOP-treated mice were washed with cold isotonic saline (0.9% sodium chloride, 4 °C) to remove blood. Connective tissue was excised. Liver was homogenized using an Ultra Turax T25 (Janke and Kunkel, IKA Labortecnik, Staufen, Germany) in buffer containing 50 mM Tris-HCl (pH 7.2, 4 °C), 0.25 M sucrose, 1 mM ethylene diamine tetraacetic acid (EDTA), 100 mM sodium chloride, 0.1 M dithiothreitol (DTT) and one Complete protease inhibitor tablet (Roche Diagnostics, Welwyn Garden City, UK) per 50 ml buffer. An initial centrifugation at 2400 g for 10 min was used to sediment the cell debris, nuclei, and unbroken cells. The supernatant was centrifuged at 12,000 g for 20 min at 4 °C. Supernatant from this step was centrifuged at 180,000 g for 60 min at 4 °C. The resultant microsomal pellet was suspended in buffer containing 0.1 M Tris-HCl (pH 7.4), 15% glycerol, 1 mM EDTA and one Complete protease inhibitor tablet per 50 ml buffer, and then centrifuged again at 180,000 g for 1 h. The final pellet was suspended in buffer containing 0.1 M Tris-HCl (pH 7.4), 15% glycerol, 1 mM EDTA and one Complete protease inhibitor tablet per 50 ml, and stored at −80 °C.
SDS-PAGE
SDS-PAGE was performed as per manufacturer's instructions using the NuPAGE® electrophoresis system from Invitrogen. Samples were diluted with NuPAGE® sample buffer, NuPAGE® reducing agent and water and heated at 70 °C for 10 minutes. They were then diluted to contain 20 mM iodoacetamide and incubated at room temperature in the dark for 30 min. Samples (25 μg protein, determined by Bradford Assay21, for the mouse liver microsomes; other amounts as described in the Results section) were resolved on NuPAGE® 4-12% Bis-Tris (Bis (2-hydroxyethyl) imino-tris (hydroxymethyl) methane-HCl) pre-cast 1.0 mm 10-well gels using NuPAGE® MOPS (3-(N-morpholino) propane sulfonic acid) SDS running buffer. Samples to be compared were run in lanes adjacent to each other. Gels were stained with SimplyBlue™ SafeStain (Invitrogen) and de-stained with water.
Western blot analysis
Western blotting was undertaken according to the method described previously by Hawkins et al22 using anti-CYP1A2 (ab22717, mouse monoclonal antibody [d15 (16VII F10F12)] to CYP1A2) and anti-CYP2E1 (ab28146, rabbit polyclonal antibody to CYP2E1) primary antibodies (Abcam, Cambridge, UK) at a final dilution of 1:5000.
In-gel tryptic digestion and peptide extraction
Gel bands were excised from SDS-PAGE gels with a razor blade. For mouse microsomal samples, the molecular weight region between approximately 45 and 62 kDa was divided into 7 – 8 pairs of bands (in a separate study performed on these mouse liver microsomal samples, P450s were exclusively identified in the molecular weight range 45 – 62 kDa, data not shown). Bands were washed in water and completely destained using 50 mM ammonium bicarbonate in 50% acetonitrile. Bands were cut into approximately 1 mm3 pieces and dried initially with acetonitrile and then in a SpeedVac for 30 min. Digestion was carried out using sequencing grade modified trypsin (40 ng/μl) (Promega, Southampton, UK) in 50 mM ammonium bicarbonate. Sufficient trypsin solution was added to swell the gel pieces, which were kept on ice for 30 min and then covered with 50 mM ammonium bicarbonate and incubated at 37 °C overnight. Peptides were extracted from the gel pieces, with ultrasonication, using sequential washings with a solution of 70% acetonitrile, alternated with acetonitrile drying steps. Extracted peptides were dried to 5 – 10 μl in a SpeedVac and stored at −80 °C for post-digest labeling.
Post-digest 18O labeling
Immobilized trypsin (Stratagene) (2 μl per sample) was washed several times with 10x volume of trypsin buffer. The trypsin was centrifuged between washes at 6000 g, and finally re-suspended in 10 μl trypsin buffer per sample. Immobilized trypsin (10 μl per sample) was added to the extracted peptides and the mixture dried completely in a SpeedVac. Peptides and immobilised trypsin were re-dissolved in 8 μl 16O water or 18O water and 2 μl acetonitrile, and shaken for 4 hours at room temperature. The reaction was quenched by the addition of 1 μl formic acid. Samples were centrifuged at 14,000 g to allow removal of the immobilized trypsin, dried to approximately 5 μl in a SpeedVac, and stored at −80 °C. Immediately prior to analysis, samples were diluted with 0.1% formic acid in water or 18O water and pairs for comparison were combined. Samples were filtered, using filter paper and gel-loading pipette tips, and analyzed by LC-ES-MS/MS and LC-ES-MS.
LC-ES-MS/MS and LC-ES-MS
LC was performed using a Micromass CapLC system with autosampler (Waters, Manchester, UK), which employs a ten port zero dead-volume valve to enable fast sample loading onto a pre-column (1 mm × 300 μm PepMap™ C18 guard column, 5 μm, 100 Å, Dionex, Camberley, Surrey, UK) at a flow rate of 15 μl/min, delivered isocratically with solvent C (0.1% formic acid in water) by auxiliary pump C. Sample was washed on the guard column for 3 min with solvent C before the ten port valve was switched to allow transfer of the sample onto the analytical column (Waters Symmetry® C18, 3.5 μm, 75 μm × 150 mm NanoEase™ column), which was equilibrated with 96% solvent A (0.1% formic acid in 5% acetonitrile), 4% solvent B (0.1% formic acid in 95% acetonitrile) at a flow rate of approximately 200 nl/min. Three min after sample loading the proportion of solvent B was increased linearly to 35% over 37 min, then to 90% over 5 min; maintained at 90% solvent B for 7 min (wash phase) then re-equilibrated at 96% solvent A, 4% solvent B for 11 min. The column effluent was continuously directed into a Micromass Q-Tof Global™ mass spectrometer (Waters), which was operated in the positive-ion ES mode, and either in MS-only mode for relative quantification over the m/z range 450-1800, 1.0 s scan time, 0.1 s interscan time; or with repeat injections in the data dependent analysis (DDA) mode for peptide identification. DDA employs an initial “survey scan” which identifies the four most abundant multiply charged ions (tryptic peptides usually appear as 2+ and/or 3+ ions), which are then fragmented by MS/MS which provides sequence information, before another “survey scan” is performed and the cycle is repeated throughout the chromatographic run. DDA analysis was performed using a 1 s MS survey scan (m/z range 450-1800) followed by 1 s MS/MS scans (0.1 s interscan time) on up to four different precursor ions (intensity threshold 10 counts per second). In DDA mode, MS/MS spectrum acquisition (in the m/z range 50-1800) was allowed for up to a total of 4.4 sec on each precursor ion, or stopped when the signal intensity fell below three counts per second, and a new MS to MS/MS cycle was started. Precursors were excluded from any further MS/MS fragmentation for 45 s to minimize repeated identification of the same peptide; singly charged ions were also excluded as precursors for MS/MS. Each sample was analyzed twice by LC-ES-MS/MS for peptide identification, and twice by LC-ES-MS for peptide quantification. In the DDA mode the Q-Tof can spend up to 17.6 s performing MS/MS scans for every 1.1 s spent performing MS survey scans, therefore relatively little MS data is collected per LC peak. It was therefore necessary to analyze each sample in a separate MS-only analysis to allow peptide quantification. Peptides were identified from their MS/MS spectra in DDA files (see next section), and then the corresponding peaks in the MS-only files were located on the basis of mass, charge, and retention times. Mass chromatograms were constructed and the spectra averaged at half peak height (unless interfering peaks were present, in which case spectra were averaged from the part of the peak where interferences were absent). Spectra were smoothed (Savitsky Golay, 2 × 4 channels) and centroided (80% centroid top), and centroid intensities were recorded. For each peptide reported, quantification was performed on at least two replicates and the average replicate value was taken and used for statistical analysis (four replicates when forward and reverse labeling experiments are considered).
Protein identification
Peak list (.pkl) files were created from data acquired in the DDA mode using Micromass MassLynx software version 4.0 (Waters). The parameters for creating .pkl files were as follows: all MS/MS files were selected; spectra were smoothed (Savitsky Golay, 2 × 3 channels) and centroided (80% centroid top, minimum peak width at half height 4 channels), and text output generated. Peptide and protein identifications were performed using the Mascot search engine public server (Matrix Science, http://www.matrixscience.com)23. Database searching was restricted to tryptic peptides of mammalian proteins, using the most current Swiss-Prot database. C-terminal double 18O, methionine oxidation and carbamidomethyl cysteine were selected as variable modifications; one missed cleavage was allowed. Precursor and MS/MS tolerances were < 0.5 Da, monoisotopic mass. The level of confidence for peptide identifications was based on the Mascot assignment of ‘identity’ and ‘homology’; for peptide identifications with scores corresponding to ‘homology’, data were checked manually. Protein identifications were based on the detection of unique peptides. Where protein identifications were based on one peptide only, data were always checked manually and only accepted when criteria outlined by the MCP document on protein identification were met (e.g. see Knapp at http://www.mcponline.org/misc/PariReport_PP.shtml).
Results and Discussion
The strategy employed for quantification of differential P450 expression from SDS-PAGE gels using 18O labeling is summarized in Figure 1. Before applying the technique to unknown samples it was necessary to analyze control samples in order to validate the procedure. Differentially labeled samples are combined immediately before LC-ES-MS analysis, but sample loss could potentially occur at several steps prior to this, including band-cutting, peptide extraction, drying, and during removal of immobilized trypsin after the labeling reaction. The efficiency of the labeling reaction had to be determined because any residual unlabelled (16O) or singly labeled (16O18O) peptide from the 18O-labelled sample will lead to quantification errors when mixed with the unlabelled sample. As a further control, when applying the technique to liver microsomes from TCPOBOP-treated and control mice two labeling experiments were performed: in the first (forward labeling) experiment the treated sample was labeled with 18O, and in the second (reverse labeling) experiment the untreated sample was labeled with 18O. This approach should ensure that no bias is introduced into the results from peptides that may be resistant to trypsin-catalysed 18O exchange.
Figure 1.

The 18O labeling strategy. Sample pairs for comparison are separated by SDS-PAGE and bands selected for analysis. After in-gel digestion with trypsin, a post-digest is performed in either 18O-labeled water or normal isotopic water. Sample pairs are then combined and analyzed by nano-LC-ES-MS/MS for peptide identification, and nano-LC-ES-MS for relative quantification.
The efficiency of the 18O labeling reaction
Recombinant human CYP3A4 was used to evaluate the efficiency of the 18O labeling reaction. For every SDS-PAGE run, one lane was loaded with 5 pmol of recombinant CYP3A4. The CYP3A4 protein band was subjected to in-gel tryptic digestion in parallel with the sample bands, and the extracted CYP3A4 peptides labeled with 18O. This sample was analyzed to determine the extent of the labeling reaction every time the procedure was performed. Over the course of three labeling experiments, eight CYP3A4 peptides were identified, with labeling efficiencies (expressed as [I4 / (I0 + I2 + I4)] × 100, where I0, I2 and I4 stand for the intensities of the first isotopic peaks of the 16O, single 18O and double 18O labeled peptides, respectively, see Figure 2) ranging from 88% to 98% (Table 1). For each CYP3A4 peptide identified, the percentage of unlabelled peptide is less than 2%. Any singly 18O labeled peptide will cause an increase in the intensity of the third isotopic peak of the unlabelled peptide, and this can be used to mathematically correct for non-quantitative labeling (see next section).
Figure 2.
Mass spectrum showing the isotope pattern produced by CYP3A4 peptide LQEEIDAVLPNK, labeled with 18O. Because the labeling reaction is not 100% efficient, some unlabelled and single 18O-labelled peptide may be present. The efficiency of the 18O labeling reaction is expressed as [I4 / (I0 + I2 + I4)] × 100, where I0, I2 and I4 stand for the intensities of the first isotopic peaks of the 16O, single 18O, and double 18O labeled peptides, respectively. In this case labeling efficiency is 86%.
Table 1.
Labeling efficiencies for CYP3A4 peptides extracted from SDS-PAGE gels and labeled with 18O.
| CYP3A4 peptide | I0 as % of I4a | Labeling efficiency (%) b | n c | ||
|---|---|---|---|---|---|
| Mean | s.d. d | Mean | s.d. d | ||
| SLLSPTFTSGK | 0 | - | 96 | 0.2 | 3 |
| LQEEIDAVLPNK | 0.5 | 0.5 | 88 | 6.3 | 3 |
| EAETGKPVTLK | 0 | - | 92 | 2.5 | 2 |
| YWTEPEK | 0.7 | 0.8 | 93 | 1.8 | 3 |
| DVEINGMFIPK | 2.0 | - | 92 | - | 1 |
| DVEINGMFIPK (methionine oxidised) | 1.4 | - | 96 | - | 1 |
| SAISIAEDEEWK | 0.6 | - | 92 | - | 1 |
| VDFLQLMIDSQNSK (methionine oxidised) | 0 | - | 98 | - | 1 |
| LSLGGLLQPEKPVVLK | 1.9 | - | 93 | - | 1 |
Where I0 < 0.3% of I4, this is shown as zero.
Calculated as [I4 / (I0 + I2 + I4)] × 100, where I0, I2 and I4 stand for the intensities of the first isotopic peaks of the 16O, single 18O, and double 18O labeled peptides, respectively.
n, number of SDS-PAGE experiments. Each value contributing to the average value is itself the average of two MS analyses.
s.d., standard deviation.
Calculation of 16O/18O ratios and protein quantification
In order to allow easy comparison between forward and reverse labeling experiments, individual peptide ratios were calculated according to the method of Ross et al9: peak intensities from the first isotopic peaks of the 16O- and 18O-labelled peptides were inserted into the formula: intensity(treated) / (intensity(control) + intensity(treated)). All values therefore fall between 0 and 1, with a peptide with unchanged expression (1:1 ratio) having a value of 0.5. Peptide ratios were grouped into proteins and averaged to obtain protein-level ratios for the P450s quantified.
Recalling that paired sets of isotope clusters are separated by 4 Da (Figure 3), corrections to the peak intensity of the first isotopic peak of the double 18O-labelled peptide were performed as follows: the sequences of the tryptic peptides were used to calculate the theoretical isotope peak distribution using Micromass MassLynx software. The predicted intensity of the fifth isotope peak of the unlabelled (16O) peptide was subtracted from the intensity of the first isotopic peak of the double 18O-labelled peptide. Secondly, to correct for any incomplete incorporation of 18O into the C terminal of the labeled peptides, the difference between the measured intensity of the third isotope peak of the unlabelled peptide and its predicted intensity was added to the intensity of the first isotopic peak of the double 18O-labelled peptide. This second correction could not be applied when the measured intensity of the third isotope peak of the unlabelled peptide was less than the predicted intensity. This was most frequently true when the I0 was much larger than I4. For these cases the question arises as to whether it is appropriate to make the corrections described above. In order to assess this, uncorrected mean ratios and corresponding standard deviations for the P450s quantified in the validation experiments and in the mouse liver forward and reverse labeling experiments were calculated and compared statistically with the corrected ratios using the variance ratio F-test and Student's two-sampled t-test. In all cases (30 proteins quantified using more than one peptide over three labeling experiments) the means were not statistically different (Student's two-sampled t-test, P values of 0.2 to 1). It was therefore concluded that the corrections described above were unnecessary. Correspondingly, uncorrected ratios were used for all the analyses described in this study.
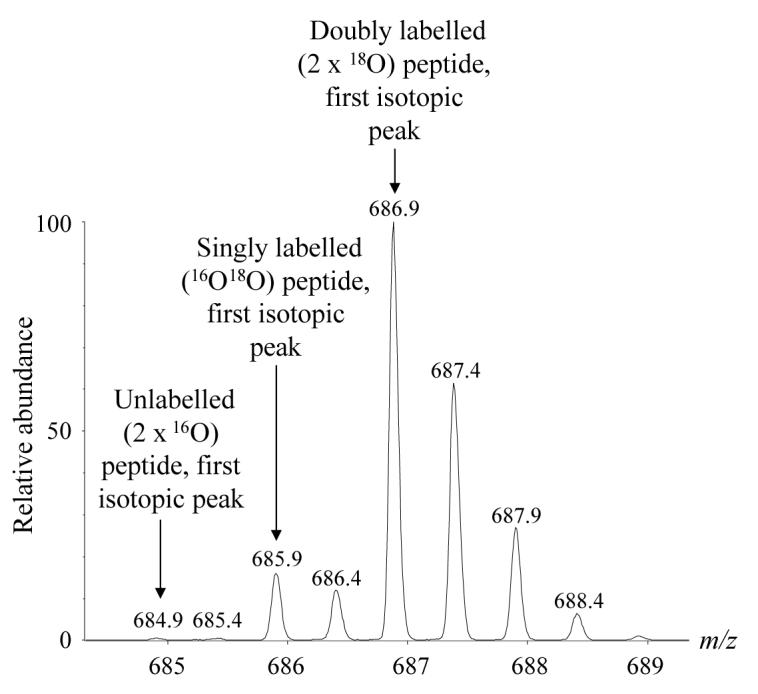
Figure 3.

Mass spectrum showing the isotopic pattern produced by analysis of a pair of identical peptides (CYP2C37 tryptic peptide CLVEELR, carbamidomethyl cysteine), one unlabelled and the other labeled with two 18O atoms at the carboxy terminus. Relative quantification can be performed by comparison of the abundances of the unlabelled and doubly 18O-labeled peptides. In this case, the labeled peptide is approximately 5 times as abundant as the unlabelled peptide.
Proof of concept for the quantification of differential P450 expression from SDS-PAGE gels using 18O labeling
In order to evaluate the use of 18O labeling for the quantification of P450 proteins from SDS-PAGE gels a series of samples were analyzed. Recombinant CYP3A4 and CYP2E1 were separately applied to an SDS-PAGE gel. CYP3A4 was applied to two lanes run in parallel at 5 pmol per lane, while CYP2E1 was applied to two separate lanes also run in parallel at 5 pmol and 2 pmol respectively (Table 2). In addition, a sample of human liver microsomes was applied to a further two lanes at the level of 25 μg and 10 μg (total protein), and bands in the P450 molecular weight region analyzed (Figure 4). Student's t-tests were performed in order to assess the probability that the population mean ratio for the experimental values is equal to the theoretical mean ratio. The results are summarized in Table 2. The standard deviations for all measurements are less than 0.1 (seven of the ten P450s have standard deviations of less than 0.05), which indicates a high degree of precision. For six of the ten P450s assessed, the probabilities show that the experimental mean ratio is statistically very similar to the theoretical ratio (P values of 0.2 to 0.7). For recombinant CYP2E1 and microsomal CYP1A2, 2A6 and 3A4 the P values are 0.017, 0.046, 0.003 and 0.017, respectively. These values indicate that the probabilities that the population mean ratios are the same as the theoretical values are low. This can be attributed to non-systematic error during the procedure. In real terms, the values are close: none of the experimental mean values differ from the theoretical values by more than 0.1; for every protein quantified, experimental mean ratios agree with theoretical values by more than 70%; for eight out of ten of the proteins quantified agreement is ≥ 90% (Table 2). Given the multi-step procedure employed, these figures indicate that the technique is reliable and reproducible for the relative quantification of P450s from SDS-PAGE gels.
Table 2.
Proof of concept for the quantification of differential P450 expression from SDS-PAGE gels using 18O labeling. Recombinant CYP2E1, recombinant CYP3A4 and a sample of human liver microsomes were analyzed by SDS-PAGE in known amounts and the ratios evaluated.
| P450 a | Swiss-Prot accession no. |
Amount loaded onto gel b,c |
No. peptides d,e |
Theoretical mean ratio I4 / (I0 + I4) |
Experimental mean ratio I4 / (I0 + I4) |
s.d. | P f | Agreement g % |
|---|---|---|---|---|---|---|---|---|
| Rec. 3A4 | P08684 | 5*, 5 pmol | 8 | 0.500 | 0.492 | 0.032 | 0.497 | 98 |
| Rec. 2E1 | P05181 | 5*, 2 pmol | 4 | 0.714 | 0.813 | 0.041 | 0.017 | 88 |
| Mic. 2A6 | P11509 | 25*, 10 μg | 9 | 0.714 | 0.766 | 0.036 | 0.003 | 93 |
| Mic. 2C8 | P10632 | 25*, 10 μg | 4 | 0.714 | 0.732 | 0.059 | 0.594 | 98 |
| Mic. 2C9 | P11712 | 25*, 10 μg | 4 | 0.714 | 0.739 | 0.078 | 0.577 | 97 |
| Mic. 2D6 | P10635 | 25*, 10 μg | 6 | 0.714 | 0.738 | 0.041 | 0.219 | 97 |
| Mic. 2E1 | P05181 | 25*, 10 μg | 2 | 0.714 | 0.688 | 0.046 | 0.567 | 96 |
| Mic. 4A11 | Q02928 | 25*, 10 μg | 4 | 0.714 | 0.724 | 0.046 | 0.697 | 99 |
| Mic. 1A2 | P05177 | 25, 10* μg | 10 | 0.286 | 0.258 | 0.038 | 0.046 | 90 |
| Mic. 3A4 | P08684 | 25, 10* μg | 6 | 0.286 | 0.209 | 0.054 | 0.017 | 73 |
Rec., recombinant; Mic., microsomal.
Samples labeled with 18O are indicated by asterisks.
For microsomal P450s amounts shown are for total microsomal protein.
Each peptide was quantified from at least two MS files and the average value taken.
Some peptides included for these calculations are not unique to a single P450 protein; since in this case the theoretical ratio for quantification was known, this was considered acceptable.
P, the probability that the population mean ratio for the experimental values is equal to the theoretical mean ratio (Student's t-test).
Calculated for theoretical versus experimental mean ratios using the formula: (smaller ratio) / (larger ratio) × 100.
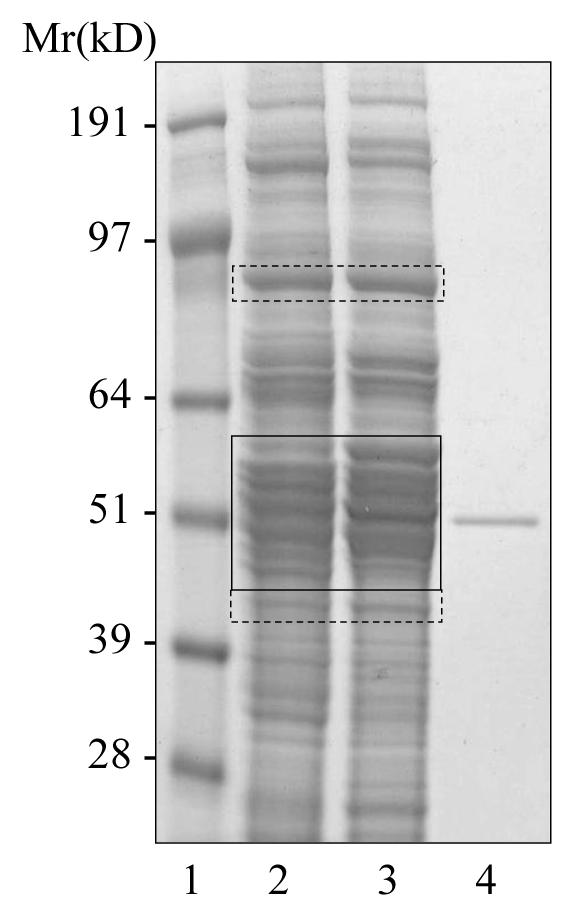
Figure 4.
SDS-PAGE gel analysis of recombinant CYP3A4 and human liver microsomes, showing sample pairs selected for the validation of the 18O labeling method for relative quantification of differentially expressed P450 proteins. Lanes 1 and 8, molecular weight markers; Lane 2, recombinant CYP3A4, 5 pmol; Lane 3, recombinant CYP3A4, 5 pmol; Lane 4, recombinant CYP2E1, 5 pmol; Lane 5, recombinant CYP2E1, 2 pmol; Lane 6, human liver microsomes, 25 μg total protein; Lane 7, human liver microsomes, 10 μg total protein. The molecular weight region of the microsomal samples selected for comparative proteomic analysis is indicated with a box.
Relative quantification of cytochrome P450 proteins in the livers of immune-deficient mice using 18O stable isotope labeling
Mice, which represent a highly controllable experimental model system, are extensively used as animal models for studying human disease. In this study the effect of administering TCPOBOP on P450 expression in immune-deficient mice has been investigated. Animal models, in which human tumors are grown on immune-deficient mice, have been widely used to evaluate the response of human tumors to anticancer drugs. Although no human P450's were identified in this study, this represents a starting point for future studies of anticancer drugs on immune-deficient mice. This model represented an ideal system on which to perform comparative P450 proteomics using 18O-labeling. Mouse liver microsomes from control and TCPOBOP-dosed mice were separated by SDS-PAGE (Figure 5) and protein bands from the P450 molecular weight region (45 - 62 kDa) excised and subjected to in-gel digestion with trypsin. We have demonstrated in a separate study on these mouse liver microsomes that P450s are exclusively identified in the 45 – 62 kDa molecular weight range. Extracted peptides were treated with immobilized trypsin in normal isotopic water (control) or 18O-water (TCPOBOP-dosed) to allow incorporation of 18O at both C-terminal oxygens in the dosed sample. Differentially labeled sample pairs were combined and analyzed by LC-ES-MS/MS for peptide identification, and LC-ES-MS for relative quantification. The reverse labeling experiment was also performed in which peptides from the control sample were labeled with 18O. For the reverse labeling experiment, a slightly wider range of molecular weights was excised from the gel, as well as one band at approximately 90 kDa (Figure 5); this was in order to identify housekeeping proteins, which could be used for normalization purposes.
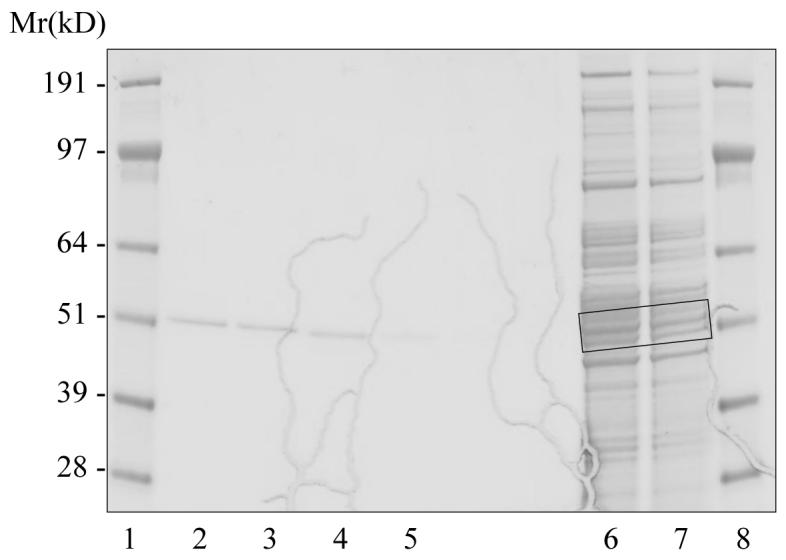
Figure 5.
SDS-PAGE analysis of liver microsomes from control and TCPOBOP-treated mice grafted with a DLD-1 human tumor xenograft. Lane 1, molecular weight markers; Lane 2, liver microsomes from control mouse (25 μg total protein); Lane 3, liver microsomes from TCPOBOP-treated mouse (25 μg total protein); Lane 4, CYP3A4, 5 pmol. Molecular weight regions from microsomes selected for comparative proteomics with 18O labeling are indicated with boxes. Dashed lines represent areas that were selected for the reverse but not the original labeling experiment. The P450 molecular weight region (45 - 62 kDa) was divided into seven pairs of bands for the original labeling experiment, and eight pairs of bands for the reverse experiment.
Seventeen P450 proteins were identified from mouse liver (Table 3, Supporting Information Table 1), of which sixteen yielded data sufficient for relative quantification. Of these, eleven were quantified using more than one unique tryptic peptide (Table 3, Supporting Information Table 1). All the P450s detected were unambiguously identified, with the exception of the highly homologous CYP2A4/2A5, which share 98% sequence identity, and CYP2B9/2B19, for which quantification using the one peptide identified was not possible due to interfering mass spectral peaks. However, the approach was able to discriminate between such highly homologous P450s as CYP2B10 and 2B20 (87% sequence identity), and CYP2C29, 2C37 and 2C38 (71% sequence identity).
Table 3.
Relative quantification of microsomal P450 proteins from the liver of immune deficient mice following TCPOBOP treatment using stable isotope labeling of tryptic peptides with 18O water.
| Protein | Swiss- Prot accession no. |
Labeling experiment a |
No. unique tryptic peptides b |
Mean ratioc It / (Ic + It) |
s.d. | P d | Agreement e % |
Fold change f |
|---|---|---|---|---|---|---|---|---|
| CYP2B20 | Q62397 | A B |
2 1 |
0.972 0.967 |
0.025 - |
- |
99 |
32 |
| CYP2B10 | P12791 | A B |
1 0 |
0.946 - |
- - |
- |
- |
17 |
| CYP2B9/10 g | P12790 | A B |
1 1 |
0.925 0.964 |
- - |
- |
96 |
17 |
| CYP39A1 | Q9JKJ9 | A B |
1 0 |
0.893 - |
- - |
- |
- |
8.3 |
| CYP3A11 | Q64459 | A B |
4 4 |
0.811 0.928 |
0.076 0.037 |
0.03 |
87 |
6.7 |
| CYP2C29 | Q64458 | A B |
3 2 |
0.870 0.837 |
0.103 0.002 |
0.63 |
96 |
5.8 |
| CYP2C37 | P56654 | A B |
5 6 |
0.852 0.832 |
0.031 0.031 |
0.33 |
98 |
5.3 |
| CYP2C38 | P56655 | A B |
1 0 |
0.840 - |
- - |
- |
- |
5.2 |
| CYP1A2 | P00186 | A B |
2 3 |
0.763 0.837 |
0.085 0.016 |
0.44 |
91 |
4.0 |
| CYP2A4/5 | P15392 | A B |
5 6 |
0.591 0.809 |
0.035 0.028 |
0.00 |
73 |
2.3 |
| CYP2D10 | P24456 | A B |
4 2 |
0.456 0.521 |
0.056 0.006 |
0.20 |
87 |
1.0 |
| CYP2A12 | P56593 | A B |
1 3 |
0.489 0.499 |
- 0.063 |
- |
98 |
1.0 |
| CYP2F2 | P33267 | A B |
3 2 |
0.445 0.381 |
0.170 0.029 |
0.65 |
86 |
0.70 |
| CYP27A1 | Q9DBG1 | A B |
1 0 |
0.197 - |
- - |
- |
- |
0.25 |
| CYP2C40 | P56657 | A B |
2 0 |
0.189 - |
0.049 - |
- |
- |
0.23 |
| CYP2E1 | Q05421 | A B |
5 5 |
0.141 0.123 |
0.030 0.007 |
0.25 |
87 |
0.15 |
| CYP3A41 | Q9JMA7 | A B |
1 0 |
0.024 - |
- - |
- |
- |
0.02 |
| CYP2B9/19 h | P12790 | A B |
0 1 |
- - |
- - |
- |
- |
- |
| β-Actin i | P60710 | A B |
0 5 |
- 0.560 |
- 0.034 |
- |
- |
1.3 |
The accuracy of single peptide identifications were manually verified according to the accepted rules of gas-phase ion chemistry (see Knapp at http://www.mcponline.org/misc/PariReport_PP.shtml).
Labeling experiment A: forward labeling experiment, i.e. TCPOBOP-treated sample labeled with 18O water, control sample unlabelled; labeling experiment B: reverse labeling experiment, i.e. control sample labeled with 18O water, treated sample unlabelled.
Each peptide was quantified from at least two MS files and the average value taken.
It, intensity of the first isotopic peptide peak from the treated sample; Ic, intensity of the first isotopic peptide peak from the control sample.
Probability that the mean ratio for experiment A is equal to the mean ratio for experiment B (Student's t-test).
Calculated for the mean ratio of experiment A versus experiment B using the formula: (smaller ratio) / (larger ratio) × 100.
Calculated from the mean ratio of experiments A and B.
Peptide common to CYP2B9 and 2B10. This peptide shows identical up-regulation to the unique 2B10 peptide.
One peptide was identified for CYP2B9/19 from experiment B, but interfering mass spectral peaks meant that relative quantification was not possible.
Actin, a housekeeping protein, was identified in labeling experiment B at approximately 42 kDa on the SDS-PAGE gel, from the region indicated by dashed lines in Figure 5.
The relative levels of most of the P450s quantified were affected by treatment with TCPOBOP (Table 3 and Figure 6). Nine of the P450s quantified were up-regulated (CYP1A2, 2A4/5, 2B10, 2B20, 2C29, 2C37, 2C38, 3A11 and 39A1), four were down-regulated (CYP2C40, 2E1, 3A41 and 27A1) and only three were unaffected (CYP2A12, 2D10 and 2F2). The results for the up-regulated P450s CYP1A2, 2A4/5, 2B10, 2C29, 2C37, 2C38 and 3A11 are in line with those in the literature regarding P450 expression changes in response to TCPOBOP. Strong up-regulation of CYP2B10 mRNA and protein expression after TCPOBOP treatment is well-documented24-26; our results show an up-regulation of 17-fold (Table 3). CYP3A11 mRNA has been shown to be up-regulated by TCPOBOP27,28, as have CYP2A5 mRNA26, and CYP1A, 2A, 2B and 2C proteins by Western blot and mRNA25. On the basis of Western blot and metabolism experiments the CYP1A and 2A proteins found to be up-regulated were characterized as 1A2, 2A4 and 2A5, which agree with the findings of present study25. Members of the mouse CYP3A subfamily were shown by immunoblot to be up-regulated upon TCPOBOP treatment, but these did not including CYP3A4128. CYP3A41 was found to be down regulated in the present study. Konstandi et al29 report that mouse liver CYP2A5 activity was found to be induced by TCPOBOP by about 2.5-fold, which is very similar to the 2.3-fold up-regulation of 2A4/5 shown in our analyses (Table 3). This is the first time that up-regulation of CYP2B20 and CYP39A1 has been shown. CYP2B20 shares 87% sequence identity with CYP2B10; the responses of these two proteins have not previously been distinguished from one another. Down-regulation of P450s by TCPOBOP in mice has not previously been reported, although there is some evidence of down-regulation of CYP2E1 mRNA in response to TCPOBOP treatment25. Of particular significance is the result that CYP2C29, 2C37 and 2C38 are up-regulated whilst CYP2C40 is down-regulated. Because of the poor discrimination between these closely related proteins (they share 61% sequence identity), differential response to chemical stimulation has not previously been detected using conventional techniques. However, Jenkins et al using ICAT methodology have been able to differentiate between CYP2C29 and 2C4031.
Figure 6.

The effect of TCPOBOP treatment on the expression of cytochrome P450 proteins in mouse liver.
To further confirm the proteomic data presented in this study, Western blot analysis using anti-CYP1A2 and anti-CYP2E1 primary antibodies was performed on liver microsomal proteins from TCPOBOP-treated and control mice (Figure 1 Supporting Information). CYP1A2 was clearly up-regulated in liver of the TCPOBOP-treated mouse, and 2E1 down regulated in this mouse.
When making quantitative proteomic comparisons between two samples it is necessary to normalize for the total protein content of each sample. In this study, the protein concentrations of the microsomes were determined by Bradford Assay21, and 25 μg of total protein was analyzed for each sample. However, the perturbations of the P450s quantified were so large that it was desirable to confirm normalization by alternative means. Techniques such as Western and Northern blotting traditionally employ “housekeeping proteins” such as glyceraldehyde-3-phosphate dehydrogenase, β-actin, and β-tubulin, to correct for protein loading and factors such as transfer efficiency30. No housekeeping proteins were identified in the forward labeling experiment and, for this purpose, a wider molecular weight region of the SDS-PAGE gel was selected for analysis in the reverse labeling experiment (Figure 5). β-actin was identified (Table 3). Quantification was performed using 5 peptides and a protein mean ratio of 0.56 calculated, equivalent to a 1.3 fold change after TCPOBOP treatment. This value is very close to the no-change value of 1 expected, and serves as confirmation of normalization by microsomal protein content.
The standard deviation values shown in Table 3 are generally less than 0.1, indicating a high degree of precision9. The only exceptions are CYP2C29 (0.103, forward labeling experiment) and CYP2F2 (0.17, forward labeling experiment). These values can be explained as follows: the P450 molecular weight region of the SDS-PAGE gel was cut into several pairs of bands for analysis (Figure 5); each one of these gel slices contained many proteins. Where protein bands were split between gel slices some anomalous results were observed, with peptide ratios differing between gel slices; for this reason, large standard deviations were recorded. This was the case for CYP2C29 and CYP2F2 in the forward labeling experiment. It was reasoned that taking the mean value of the peptide ratios should approximate to the actual ratio. This was proved to be the case when the reverse labeling experiment was performed: on this occasion CYP2C29 and CYP2F2 were identified from one gel band only, with mean ratios very similar to those from the forward labeling experiment (Table 3).
Statistical analyses were performed to compare the two (forward and reverse) labeling experiments. Variance ratio F-tests and Student's two-sampled t-tests were performed on the results for the eight P450s for which quantification was performed using two or more peptides for both the forward and the reverse labeling experiments (Table 3). The P values, which represent the probability that the population mean ratios for both the forward and reverse labeling experiments are equal, are shown in Table 3. The P values are high for all but CYP2A4/5. It was not possible to distinguish between CYP2A4 and CYP2A5, and so this could be the cause of the apparent discrepancy between the two labeling experiments. Percentage agreements were also calculated and are high (> 70%) for all P450s that were quantified in both labeling experiments.
To date, there have been few proteomics studies to quantify cytochrome P450s. Jenkins et al31 used ICAT reagents for relative and absolute quantification of hepatic P450s induced in response to phenobarbital or 3-methylcholanthrate. ICAT reagents specifically label cysteine residues and rely on MS/MS of cysteine containing peptides to identify and quantify proteins. This is not an ideal approach to differentiate between isozymes with a high degree of amino acid sequence similarity, such as P450 subfamily members. An alternative label-free approach to quantification was suggested by Alterman et al32, this involved the use of unlabelled internal standard tryptic peptides, and MALDI based peptide mass fingerprinting. This method was validated for a mixture of three recombinant proteins, but whether it can be applied to biological samples containing a range of P450 proteins of varying abundance is open to question.
In summary, the method reported in this communication allows identification and relative quantification of a wide range of P450 isoforms. The technique has exquisite discriminatory powers, allowing distinction between such highly homologous isozymes as CYP2B10 and CYP2B20 (87% sequence identity). The method takes advantage of SDS-PAGE to separate membrane proteins, and can potentially use every tryptic peptide of unique amino acid sequence for protein identification and quantification. The method of labeling is enzymatic rather than chemical and has the advantage of being SDS-PAGE compatible and avoids the introduction of derivatisation artifacts. The method has been successfully applied to the analysis of differential P450 expression in the livers of control and TCPOBOP-treated mice grafted with human tumors. Changes in liver P450 expression after treatment with TCPOBOP are consistent with those found in the literature.
Supplementary Material
Acknowledgements
The authors would like to thank Cathrin Seibert and Kersti Karu for sample preparation. This work was supported by The School of Pharmacy, and the UK Biotechnology and Biological Sciences Research Council (grant no. BB/C515771/1 & BB/C511356/1). C S Lane is the holder of a C W Maplethorpe Postdoctoral Fellowship of the University of London
References
- 1.Lewis DFV. Cytochromes P450: structure, function and mechanism. 1st ed. Taylor and Francis; 1996. [Google Scholar]
- 2.Evans WE, Relling MV. Science. 1999;286:487–91. doi: 10.1126/science.286.5439.487. [DOI] [PubMed] [Google Scholar]
- 3.Wolf CR. Cancer Surv. 1990;9:437–74. [PubMed] [Google Scholar]
- 4.Patterson LH, Murray GI. Curr. Pharm. Des. 2002;8:1335–47. doi: 10.2174/1381612023394502. [DOI] [PubMed] [Google Scholar]
- 5.Anderson L, Seilhamer J. Electrophoresis. 1997;18:533–37. doi: 10.1002/elps.1150180333. [DOI] [PubMed] [Google Scholar]
- 6.McFadyen MCE, Rooney PH, Melvin WT, Murray GI. Biochem. Pharmacol. 2003;65:1663–74. doi: 10.1016/s0006-2952(03)00111-4. [DOI] [PubMed] [Google Scholar]
- 7.Gygi SP, Rochon Y, Franza BR, Aebersold R. Mol. Cell Biol. 1999;19:1720–30. doi: 10.1128/mcb.19.3.1720. [DOI] [PMC free article] [PubMed] [Google Scholar]
- 8.Ong SE, Blagoev B, Kratchmarova I, Kristensen DB, Steen H, Pandey A, Mann M. Mol. Cell Proteomics. 2002;1:376–86. doi: 10.1074/mcp.m200025-mcp200. [DOI] [PubMed] [Google Scholar]
- 9.Ross PL, Huang YN, Marchese JN, Williamson B, Parker K, Hattan S, Khainovski N, Pillai S, Dey S, Daniels S, Purkayastha S, Juhasz P, Martin S, Bartlet-Jones M, He F, Jacobson A, Pappin DJ. Mol. Cell Proteomics. 2004;3:1154–69. doi: 10.1074/mcp.M400129-MCP200. [DOI] [PubMed] [Google Scholar]
- 10.Gygi SP, Rist B, Gerber SA, Turecek F, Gelb MH, Aebersold R. Nat. Biotechnol. 1999;17:994–99. doi: 10.1038/13690. [DOI] [PubMed] [Google Scholar]
- 11.Gerber SA, Rush J, Stemman O, Kirschner MW, Gygi SP. Proc. Natl. Acad. Sci. U.S.A. 2003;100:6940–45. doi: 10.1073/pnas.0832254100. [DOI] [PMC free article] [PubMed] [Google Scholar]
- 12.Beynon RJ, Doherty MK, Pratt JM, Gaskell SJ. Nat. Methods. 2005;2:587–89. doi: 10.1038/nmeth774. [DOI] [PubMed] [Google Scholar]
- 13.Schnolzer M, Jedrzejewski P, Lehmann WD. Electrophoresis. 1996;17:945–53. doi: 10.1002/elps.1150170517. [DOI] [PubMed] [Google Scholar]
- 14.Yao X, Freas A, Ramirez J, Demirev PA, Fenselau C. Anal. Chem. 2001;73:2836–42. doi: 10.1021/ac001404c. [DOI] [PubMed] [Google Scholar]
- 15.Rao KC, Carruth RT, Miyagi M. J. Proteome.Res. 2005;4:507–14. doi: 10.1021/pr049792c. [DOI] [PubMed] [Google Scholar]
- 16.Lane CS, Nisar S, Griffiths WJ, Fuller BJ, Davidson BR, Hewes J, Welham KJ, Patterson LH. Eur. J. Cancer. 2004;40:2127–34. doi: 10.1016/j.ejca.2004.04.029. [DOI] [PubMed] [Google Scholar]
- 17.Nisar S, Lane CS, Wilderspin AF, Welham KJ, Griffiths WJ, Patterson LH. Drug Metab. Dispos. 2004;32:382–86. doi: 10.1124/dmd.32.4.382. [DOI] [PubMed] [Google Scholar]
- 18.Heller M, Mattou H, Menzel C, Yao X. J. Am. Soc. Mass Spectrom. 2003;14:704–18. doi: 10.1016/S1044-0305(03)00207-1. [DOI] [PubMed] [Google Scholar]
- 19.Bantscheff M, Dumpelfeld B, Kuster B. Rapid Commun. Mass Spectrom. 2004;18:869–76. doi: 10.1002/rcm.1418. [DOI] [PubMed] [Google Scholar]
- 20.Smith G, Harrison DJ, East N, Rae F, Wolf H, Wolf CR. Br. J. Cancer. 1993;68:57–63. doi: 10.1038/bjc.1993.286. [DOI] [PMC free article] [PubMed] [Google Scholar]
- 21.Bradford MM. Anal. Biochem. 1976;72:248–54. doi: 10.1016/0003-2697(76)90527-3. [DOI] [PubMed] [Google Scholar]
- 22.Hawkins LM, Prybylowski K, Chang K, Moussan C, Stephenson FA, Wenthold RJ. J. Biol. Chem. 2004;279:28903–10. doi: 10.1074/jbc.M402599200. [DOI] [PubMed] [Google Scholar]
- 23.Perkins DN, Pappin DJ, Creasy DM, Cottrell JS. Electrophoresis. 1999;20:3551–67. doi: 10.1002/(SICI)1522-2683(19991201)20:18<3551::AID-ELPS3551>3.0.CO;2-2. [DOI] [PubMed] [Google Scholar]
- 24.Honkakoski P, Moore R, Gynther J, Negishi M. J. Biol. Chem. 1996;271:9746–53. doi: 10.1074/jbc.271.16.9746. [DOI] [PubMed] [Google Scholar]
- 25.Smith G, Henderson CJ, Parker MG, White R, Bars RG, Wolf CR. Biochem. J. 1993;289(Pt 3):807–13. doi: 10.1042/bj2890807. [DOI] [PMC free article] [PubMed] [Google Scholar]
- 26.Cai Y, Konishi T, Han G, Campwala KH, French SW, Wan YJ. Eur. J. Pharm. Sci. 2002;15:89–96. doi: 10.1016/s0928-0987(01)00211-1. [DOI] [PubMed] [Google Scholar]
- 27.Wei P, Zhang J, Dowhan DH, Han Y, Moore DD. Pharmacogenomics. J. 2002;2:117–26. doi: 10.1038/sj.tpj.6500087. [DOI] [PubMed] [Google Scholar]
- 28.Anakk S, Kalsotra A, Kikuta Y, Huang W, Zhang J, Staudinger JL, Moore DD, Strobel HW. Pharmacogenomics. J. 2004;4:91–101. doi: 10.1038/sj.tpj.6500222. [DOI] [PubMed] [Google Scholar]
- 29.Konstandi M, Marselos M, Radon-Camus AM, Johnson E, Lang MA. Eur. J. Drug Metab. Pharmacokinet. 1998;23:483–90. doi: 10.1007/BF03189999. [DOI] [PubMed] [Google Scholar]
- 30.Ferguson RE, Carroll HP, Harris A, Maher ER, Selby PJ, Banks RE. Proteomics. 2005;5:566–71. doi: 10.1002/pmic.200400941. [DOI] [PubMed] [Google Scholar]
- 31.Jenkins RE, Kitteringham NR, Hunter CL, Webb S, Hunt TJ, Elsby R, Watson RB, Williams D, Pennington SR, Park BK. Proteomics. 2006;6:1934–47. doi: 10.1002/pmic.200500432. [DOI] [PubMed] [Google Scholar]
- 32.Alterman MA, Kornilayev B, Duzhak T, Yakovlev D. Drug Metab. Dispos. 2005;33:1399–407. doi: 10.1124/dmd.105.004812. [DOI] [PubMed] [Google Scholar]
Associated Data
This section collects any data citations, data availability statements, or supplementary materials included in this article.