

Abstract
Trapping of weak bases was utilized to evaluate stimulus-induced changes in the internal pH of the secretory vesicles of chromaffin cells and enteric neurons. The internal acidity of chromaffin vesicles was increased by the nicotinic agonist 1,1-dimethyl-4-phenyl-piperazinium iodide (DMPP; in vivo and in vitro) and by high K+ (in vitro); and in enteric nerve terminals by exposure to veratridine or a plasmalemmal [Ca2+ ]o receptor agonist (Gd3+). Stimulation-induced acidification of chromaffin vesicles was [Ca2+ ]o-dependent and blocked by agents that inhibit the vacuolar proton pump (vH+-ATPase) or flux through Cl− channels. Stimulation also increased the average volume of chromaffin vesicles and the proportion that displayed a clear halo around their dense cores (called active vesicles). Stimulation-induced increases in internal acidity and size were greatest in active vesicles. Stimulation of chromaffin cells in the presence of a plasma membrane marker revealed that membrane was internalized in endosomes but not in chromaffin vesicles. The stable expression of botulinum toxin E to prevent exocytosis did not affect the stimulation-induced acidification of the secretory vesicles of mouse neuroblastoma Neuro2A cells. Stimulation-induced acidification thus occurs independently of exocytosis. The quantal size of secreted catecholamines, measured by amperometry in cultured chromaffin cells, was found to be increased either by prior exposure to L-DOPA or stimulation by high K+, and decreased by inhibition of vH+-ATPase or flux through Cl− channels. These observations are consistent with the hypothesis that the content of releasable small molecules in secretory vesicles is increased when the driving force for their uptake is enhanced, either by increasing the transmembrane concentration or pH gradients.
The transport of small-molecule transmitters into secretory vesicles is facilitated by specific transporters in vesicular membranes (Reimer et al. 1998). The force that drives accumulation of transmitter against an adverse concentration gradient is provided by the vacuolar proton pump, vH+-ATPase (Johnson, 1988). This pump is expressed in secretory organelles of all eukaryotes (Finbow & Harrison, 1997). The importance of the transmembrane proton gradient in transmitter accumulation was demonstrated by inhibiting the vH+-ATPase with bafilomycin, which decreased the amplitude of miniature postsynaptic currents in neurons (Zhou et al. 2000). Similarly, postsynaptic recordings at the neuromuscular junction and amperometric studies of catecholamine-secreting adrenal chromaffin and PC12 cells demonstrated that their quantal size is also decreased following exposure to weak bases that alkalinize vesicles (Van der Kloot, 1987; Sulzer et al. 1995; Mundorf et al. 1999).
Proton uptake by the vH+-ATPase generates both a proton gradient (ΔH+) and an electrical potential (ΔΨ) across vesicular membranes (Njus et al. 1986; Johnson, 1988). The magnitude of ΔH+ is thus limited by the membrane conductance to counterions, the translocation of which compensates for the influx of positively charged H+. For example, lysosomal membranes rapidly acidify when treated with ATP in Cl−-containing media because their high Cl− permeability allows Cl− entry to compensate for the H+ influx (Schneider, 1981). It has also been shown that Cl− stimulates the activity of the vH+-ATPase in isolated chromaffin vesicles (Pazoles et al. 1980; Cidon & Nelson, 1983; Johnson, 1988).
The internal milieu of the secretory vesicles of bovine adrenal chromaffin cells has been studied extensively. In fact, the initial identification of the vH+-ATPase was performed in these vesicles (Cidon & Nelson, 1983). The internal pH of isolated chromaffin vesicles has been reported to be ≈5.6 (Pollard et al. 1979; Njus et al. 1986; Johnson, 1988). Studies that have used the trapping of radiolabelled or fluorescent weak bases or nuclear magnetic resonance to estimate the ΔH+ of isolated vesicles have suggested that the internal acidity of vesicles is constitutive rather than regulated (Pollard et al. 1979; Njus et al. 1986; Johnson, 1988). The secretory vesicles of chromaffin cells are also thought to be loaded with a fixed quantity of catecholamines (Johnson, 1988). If the content of synaptic vesicles were to be fixed, then the quantal size of released transmitter would not be likely to be altered presynaptically. That, however, is not the case; presynaptic modulation of quantal size occurs (Sulzer & Pothos, 2000). The idea that the loading of chromaffin vesicles is constitutive and maximal is based on the properties of vesicles isolated from bovine chromaffin cells. The possibilities that secretory stimuli might regulate the ΔH+ and transmitter content of the vesicles of intact chromaffin cells or neurons have not yet been experimentally tested.
Although regulation of acidification has been demonstrated to occur in a variety of secretory organelles (Nelson et al. 2000), the possibility that acidification might similarly be regulated in the secretory vesicles of neuroectoderm-derived cells has not been adequately evaluated. Secretagogue stimulation has been demonstrated to induce the acidification of the secretory vesicles of thyroid parafollicular cells (Barasch et al. 1988; Tamir et al. 1994), which are ‘paraneurons’ of neural crest origin (Fujita, 1987) that secrete serotonin (5-HT). Parafollicular cells respond to increased levels of extracellular Ca2+ and exhibit stimulus-induced vesicle acidification either when they are activated by their natural secretagogue, elevated [Ca2+ ]o, or by non-specific stimuli, such as depolarization with high K+ or phorbol esters. The Cl− content of the vesicles of stimulated parafollicular cells is increased, confirming that Cl− serves as the counterion in intact cells that serves to dissipate the ΔΨ, that would otherwise restrict the inward translocation of H+ (Tamir et al. 1994). The ΔH+, Cl− conductance and 5-HT uptake of vesicles isolated from stimulated parafollicular cells are all greater than those of vesicles isolated from resting cells. Therefore, stimulation appears to induce a relatively long-lived change in properties of vesicular membranes (Barasch et al. 1988; Cidon et al. 1991). The secretory vesicles of mast cells are still another example of stimulation-induced acidification; in this case the vesicles have been observed to acidify following the formation of a transient fusion pore with the plasma membrane (Williams & Webb, 2000). The ΔH+ is also regulated in the insulin-storing vesicles of pancreatic beta cells, which become more acidic as they mature (Orci et al. 1986), although this was not reported to be related to stimulation.
In this study, we test the hypotheses that the ΔH+ and transmitter contents of dense core chromaffin and secretory vesicles are regulated by stimulation. The weak bases acridine orange and 3-(2,4-dinitroanilino)-3′-amino-N-methyl dipropylamine (DAMP), which become trapped in acidic compartments and can be visualized by fluorescent or immunoelectron microscopy, were used to determine the effect of stimulation on the pH of vesicles in intact chromaffin cells and enteric neurons. Amperometry was used to measure the quantal size of catecholamines secreted by chromaffin cells. Both chromaffin vesicles and the synaptic vesicles of enteric neurons were found to acidify following prolonged stimuli that caused cells to secrete. However, endo- and exocytosis were not required for stimulation-dependent vesicular acidification. A subpopulation of chromaffin vesicles was found to increase in volume following stimulation. In addition, we found that the quantal size of a subpopulation of secretory events was increased by prior incubation of chromaffin cells with l-dihydroxyphenylalanine (l-DOPA) or secretory stimulation, and decreased by the collapse of the pH gradient by the weak base chloroquine, the vH+-ATPase inhibitor bafilomycin, or the Cl− channel blocker 5-nitro-2-(3-phenylpropylamino)-benzoic acid (NPPB). These observations demonstrate that stimulation-induced regulation of the pH of secretory and synaptic vesicles occurs in chromaffin cells and at least some neurons and may represent a novel mechanism contributing to the modulation of secretion and synaptic transmission.
METHODS
Unless stated otherwise, all compounds were purchased from Sigma (Milwaukee, WI). Animal protocols are approved by Columbia University and Tufts University IACUC.
Adrenal chromaffin cultures
For rat-derived cultures, adrenal glands from 2- to 3-week-old male Sprague-Dawley rats, killed by injection of ketamine hydrochloride (100 mg kg−1), were dissected in Hank's media (HBSS). The capsule and cortex were removed and the remaining medullae were minced. After several washes with HBSS, cells were dissociated by incubation at 37 °C with Ca2+-free collagenase IA solution (0.2 %) for 30 min with shaking. The digested tissues were rinsed three times with HBSS and triturated gently for 5 min in a solution containing 1 % bovine serum albumin and 0.02 % deoxyribonuclease. The dissociated cells were centrifuged to form a pellet and resuspended in a medium composed of Dulbecco's modified Eagle's medium (DMEM), enriched with 10 % fetal bovine serum, 50 units ml−1 penicillin, and 50 μg ml−1 streptomycin. The cell suspension was placed onto poly-d-lysine-laminin-coated glass wells in 50 mm dishes, and after 3 h the dishes were flooded with the culture medium. Cells were maintained in a CO2 incubator at 37 °C. Recordings took place between days 3 and 8 post-plating. For electron microscopy, the petri dishes were prepared with Aclar coverslips but were otherwise treated identically.
For bovine-derived cultures, fresh bovine adrenals were dissected in Ca2+-Mg2+-free Earl's balanced salt solution (EBSS). The medullae were removed and minced into pieces. After several washes, cells were dissociated by incubation at 37 °C with collagenase IA solution (0.2 %) containing 0.02 % deoxyribonuclease in Ca2+-Mg2+-free EBSS for 30 min. The dissociated cells were filtered through nylon mesh and then centrifuged to form a pellet. The resulting pellet was resuspended in MEM. Chromaffin cells were further purified by centrifugation on a 10–25 % Ficoll gradient (Pharmacia Fine Chemicals, Peapack, NJ, USA) made in MEM. The purified cells were washed and then resuspended in 50 % DMEM, 50 % F-12 Coon's medium enriched with 5 % fetal bovine serum, 50 units ml−1 penicillin, and 50 μg ml−1 streptomycin. Cells were plated in poly-d-lysine- and laminin-coated glass wells attached in the centre of 50 mm dishes. Ten microlitres of 10 ml of the above solution were plated per well, which yielded ≈1000 chromaffin cells per well. Culture media contained the same ingredients as above (50 % DMEM, 50 % F-12 Coon's medium enriched with 5 % fetal bovine serum, 50 units ml−1 penicillin, and 50 μg ml−1 streptomycin). Fetal bovine serum was removed after 24 h and cells were then maintained in serum-free media. Amperometry experiments were conducted between days 3 and 7 post-plating.
Stimulation of cells in vitro for fluorescent and electron microscopy
One hour before stimulation, cultured rat chromaffin cells or Neuro2A cells were rinsed twice with medium A (128 mm NaCl, 2 mm KCl, 1 mm MgCl2, 25 mm glucose, 10 mm Hepes, 1 mm CaCl2, pH 7.4), and 2 ml of the same medium was added to each culture dish. Cells were stimulated by replacing medium A with medium B (80 mm NaCl, 50 mm KCl, 1 mm MgCl2, 25 mm glucose, 10 mm Hepes, 1 mm CaCl2, pH 7.4) for the indicated duration of time. Alternatively, 10 μm nicotinic receptor agonist, dimethylphenylpiperazinium (1,1-dimethyl-4-phenyl-piperazinium iodide; DMPP) was added to medium A for 10 min. Inhibitors were added 30 min before stimulation. In experiments that used Ca2+-free medium, the Ca2+ was replaced with 1 mm EGTA.
Analysis of acridine orange fluorescence
The trapping of the pH-sensitive dye acridine orange was imaged in cultures either using conventional fluorescence microscopy as previously described (Barasch et al. 1988; Sulzer & Holtzman, 1989; Sulzer & Rayport, 1990), or using a 2-photon system. Briefly, cells were preincubated with acridine orange (10 nm) for 30 or 60 min before stimulation. Conventional fluorescent images were acquired using a chilled CCD camera (Star 1, Photometrics; 384 × 576 pixels) and a fluorescein filter set (Zeiss). Two-photon imaging (Zeiss, Coherent) used 880 nm excitation and 520 nm emission wavelengths. The laser power was attenuated to 5 % of a maximum. Under these conditions, there was no cellular damage or photobleaching of acridine orange, which enabled the acquisition of multiple images from single cells for kinetic analysis. Changes in acridine orange intensity over time were measured on 16 regions of interest in 16 cells on six micrographs. Background mean pixel intensity levels were subtracted. Data are reported as percentages of control values; means ± s.e.m.
Immunoelectron microscopy of DAMP in chromaffin vesicles in culture
Cell stimulation and fixation.
3-(2,4-Dinitroanilino)-3′-amino-N-methyldipropylamine (DAMP) is a weak base that can be detected in tissues with antibodies to dinitrophenol (DNP) (Anderson et al. 1984; Barasch et al. 1988; Orci et al. 1994). The cultures were first preincubated in medium A with the addition of 200 μm DAMP (Molecular Probes, Eugene, OR, USA) for 10 min, and then for 40 additional minutes with either medium A (for controls) or B (for stimulation) with the same concentration of DAMP. The cultures were then rinsed in medium A for 5 min, and fixed in ‘PLP’ fixative (4 % paraformaldehyde, 77 mm lysine HCl, 10 mm sodium periodate, 3 % sucrose in 0.1 m phosphate buffer, pH 7.4) for 1 h at room temperature. The cultures were then rinsed twice for 5 min in medium A.
For processing, the tissue was exposed to 0.5 % sodium borohydrate in 0.1 m phosphate buffer with 3.5 % sucrose (P/S) for 30 min, rinsed in P/S until no bubbles were observed, mordanted with 0.25 % tannic acid in 100 mm P/S for 1 h at 4 °C, and then rinsed three times in P/S. The tannic acid was quenched with 50 mm NH4 Cl in P/S, washed extensively with 100 mm sodium maleate containing 4 % sucrose (pH 6.2) and stained en block with maleate-buffered 2 % uranyl acetate. Once the specimens were dehydrated to 70 % ethanol, the temperature was lowered to 20 °C for complete dehydration, clearing and embedding in LR Gold (LR Gold Resin Company Ltd, UK). The LR Gold was polymerized by UV light at −20 °C. Thin sections were cut and picked up on nickel grids coated with Formvar.
Post-embedding immunocytochemistry.
The sections were treated on the grids with a blocking solution containing 10 % normal goat serum in PBS for 30 min at room temperature. For DAMP, the sections were incubated with a mouse monoclonal antibody to DNP (Oxford Biomedical Research, Oxford, UK) diluted 1 : 100 in 4 % normal goat serum in PBS overnight at room temperature. Grids were subsequently washed in blocking solution and incubated for 2 h at room temperature with goat anti-mouse antibodies coupled to either 10 nm particles of colloidal gold (Amersham, Piscataway, NJ, USA; diluted 1 : 20 in 4 % normal goat serum in PBS) or 5 nm gold particles diluted 1 : 30 in the same solution. The sections were washed in PBS and postfixed with 2.5 % glutaraldehyde in water for 5 min. For micrographs with DAMP antibody only, the sections were stained with aqueous 2 % osmium, uranyl acetate and lead citrate. For micrographs with both DAMP and ferritin antibody, the sections were unstained. Sections were examined with a JEOL 1200 EX electron microscope.
Double labelling with DAMP and cationic ferritin.
For immunoelectron microscopy of cationic ferritin, cultures were incubated as for DAMP but with the addition of 0.1 mg ml−1 cationized ferritin (horse spleen derived, Electron Microscopy Sciences, Fort Washington, PA, USA). Subsequent fixation and processing were as for DAMP, except that antibody to ferritin (1 : 50, rabbit anti-horse spleen ferritin, Sigma) was added concurrently with the anti-DNP antibody, and the secondary antibody was goat anti-rabbit coupled to 10 nm gold particles (Amersham).
Immunoelectron microscopy of adrenal chromaffin vesicles in vivo
Male rats (Charles River; 200–250 g) were injected intraperitoneally with 0.5 ml of a 600 μm solution of DAMP. After 40 min, a nicotinic receptor agonist (DMPP; 10 μg kg−1) or saline was injected into the femoral veins of experimental or control rats. All animals were deeply anaesthetized 5 min later with ketamine HCl (Fort Dodge Laboratories; 110 mg kg−1) and xylazine (Haver; 20 mg kg−1). When the animals failed to respond to a tail-pinch, the hearts of the rats were exposed and the tip of an 18 gauge needle connected to a perfusion apparatus was inserted into the left ventricle. The blood was flushed out by perfusion with saline and heparin (4 mg kg−1). The animals were then fixed by perfusion for 15 min with 250 ml of a solution containing 4 % formaldehyde (freshly prepared from paraformaldehyde) and 0.5 % glutaraldehyde in 0.1 m phosphate buffer pH 7.4. The adrenal glands were removed and post-fixed by immersion for an additional 1 h in the same fixative. Following fixation, the adrenal glands were cut into small blocks and incubated overnight in 0.1 m phosphate buffer containing 3 % sucrose. The following steps for immunoelectron microscopy are detailed in the preceding section.
Electrochemical recordings
Amperometric electrodes used 5 μm carbon fibres (Amoco). The electrodes were back-filled with 3 m KCl and bevelled at the tip. Electrode response was tested by cyclic voltammetry. A positive 700 mV voltage (vs. a Ag-AgCl ground) was applied to the carbon fibre electrode using a 200B amplifier (Axon Instruments). The output was digitized at 50 kHz, low-pass filtered at 10 kHz and analysed using a locally written Superscope II program (GWI Instruments). For analysis, peaks were at least 4.5 times greater than r.m.s. noise, with 2 pA as a minimum amplitude in all cases, and between 1 and 500 ms in baseline-to-baseline duration. Cells yielding fewer than five amperometric events per stimulation were not included in the analysis. Overlapping events were not included in the analysis of quantal sizes, but were included in the analysis of interspike intervals. The number of molecules oxidized was determined by the relation N = Q/nF, where Q is the charge of the spike, n is the number of electrons transferred (two for catecholamines), N is the number of moles and F is Faraday's constant (96 485 coulombs per equivalent). Statistical analysis of quantal sizes was performed by ANOVA of the means (Sulzer & Pothos, 2000). Interspike intervals report the mean and s.e.m. for all intervals <5 s. Statistical analysis on interspike intervals was performed using the Kolmogorov-Smirnov test on the cumulative data. Secretagogues were applied from a distance of 20–40 μm from the recording electrode using 3–6 p.s.i. air pressure (Picospritzer, General Valve) for 6 s for a total application of ≈7-20 nl.
For amperometric recordings, cells were rinsed three times for 5 min each with physiological saline prior to recording. The recording medium (physiological saline) contained 150 mm NaCl, 2 mm KCl, 1.2 mm CaCl2, 1 mm MgCl2, 1 mm NaH2PO4, 25 mm glucose and 10 mm Hepes (pH 7.3). The stimulation medium used for acidification contained 102 mm NaCl, 50 mm KCl, 1.2 mm CaCl2, 21 mm glucose and 10 mm Hepes, pH 7.3. The medium used for local injection stimulation (Picospritzer) contained 92.4 mm NaCl, 80 mm KCl, 6 mm CaCl2, 21 mm glucose and 10 mm Hepes, pH 7.3.
Expression of botulinum neurotoxin E light chain in neuroblastoma cell line
Neuro2A mouse neuroblastoma cells (a kind gift from Dr Peter Cserjesi, Columbia University, NY) were transfected to constitutively express botulinum toxin E. Botulinum toxin E light chain was amplified from BoNT/E-pCMV plasmid (a kind gift from Dr T. Binz, Hanover, Germany) using primers: 5′-CCTCCTGCGCTCGAGTCTAGATTACCTTATGCCTTTTACAGAA and 5′-TAATTAACCTAAGCTTGCCACCATGGGAATGCCAAAAATTAATAGTTTTAAT, digested with Hin dIII and Xba1, and subcloned into pIND vectors to yield BoNT/E-pIND. Cells were transfected with Lipofectamine (Invitrogen, Carlsbad, CA, USA), according to the manufacturer's instructions. The lines were maintained in DMEM with 8 % FBS, 2 mm l-glutamine, 20 mm Hepes 50 units ml−1 penicillin and 50 μg ml−1 streptomycin in a 5 % CO2 incubator at 37 °C. The medium for the transfected cells also contained 0.75 μg ml−1 neomycin and 0.25 μg ml−1 zeocin, to maintain high levels of expression of the botulinum toxin E light chain by selecting against cells that have lost the transfected gene. Neomycin and zeocin were obtained from Invitrogen (Carlsbad, CA, USA).
Stimulation of enteric neurons in situ
The longitudinal muscle with adherent myenteric plexus (LM-MP) was prepared as previously described (Wade et al. 1994). Briefly, male guinea-pigs were stunned and exsanguinated. The small intestine was rapidly removed, flushed and placed in a beaker of iced Krebs solution. The LM-MP was dissected from the ileum and suspended in buffer. In control experiments the LM-MP preparation was incubated for 5 min at 37 °C with tetrodotoxin (0.5 μm) in oxygenated Krebs solution, followed by incubation for 30 min in the presence of tetrodotoxin and DAMP (200 μm). The experimental tissue was incubated with tetrodotoxin as above, rinsed well and then incubated for 30 min with or without the secretagogues veratridine (1.0 μm) or Gd3+ (500 μm) in the presence of DAMP. Veratridine opens voltage-gated Na+ channels and thus stimulates virtually all enteric neurons (Mawe & Gershon, 1986) while Gd3+ is an agonist at the plasmalemmal Ca2+-sensing receptor (CaR; a heptahelical G-protein-coupled receptor) and stimulates only the subset of enteric neurons that expresses it (Brown & MacLeod, 2001). Tissues were rinsed and fixed in the solutions described above for 3 h at room temperature. Tissues were embedded in LR gold and prepared for immunocytochemistry at the electron microscopic level as described above.
Data analysis and calulcations
Estimation of vesicular pH gradients.
The internal pH of subcellular organelles was measured at the ultrastructural level by determining the partition of DAMP, which is distributed according to the pH gradient. Measurements of intravesicular pH were accomplished as previously published (Orci et al. 1994). The area of intracellular organelles was measured using NIH Image software. The density of immunogold particles over neutral compartments (nuclei; Dneutral compartment) and the density of particles over secretory vesicles (Dvesicles) were expressed as particles per unit area. Assuming that the pH of the nuclei is 7.0, intravesicular pH can be estimated according to the relationship:
The density is reported as mean ± standard error of the mean DAMP density in all vesicles measured in a population. The pH and [H+ ] (reported in Fig. 4 in μm units) is determined from the relationship above. The density of immunogold particles decreases logarithmically as the pH increases, yielding a coarser resolution of pH values in the more neutral compartments. In the tables and Fig. 4, mean and s.e.m. values for pH are not indicated because pH values are natural log transformations of [H+ ], and thus of different magnitudes in the basic and acidic direction.
Figure 4.
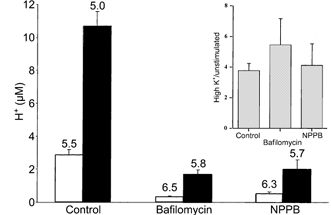
Mean calculated dense-core vesicle H+ concentration
The bars represent [H+ ] (mean ± s.e.m.; μm) determined from immunogold labelling of vesicles to detect DAMP, as reported in Fig. 2 and Table 1. The corresponding pH values (for which s.e.m.s are inappropriate; see Methods) for each unstimulated (□) and stimulated (▪) pair are written above the bars. While bafilomycin and NPPB produce more alkaline vesicles, for each pair the stimulated preparations display greater acidity. The inset shows the same data as a ratio of H+ concentrations in resting and high-K+-treated cells in the absence and in the presence of bafilomycin or NPPB.
Statistical analysis.
To analyse the intensity of fluorescent images, we assumed normal distribution and used an ANOVA test. For comparing pH values between two populations, which are not normally distributed (see above), we used the non-parametric Mann-Whitney U test. To compare morphological categories of vesicles, we used the χ2 test or Fisher's exact test. For comparing populations of quantal sizes, we used ANOVA of the means. To analyse differences in interspike intervals we used the Kolmogorov-Smirnov test. To estimate changes in proportional volume from areas, we assumed that vesicles are spherical so that:
where A is the area and V is the volume.
RESULTS
Stimulation-induced vesicular acidification
The intracellular trapping of the fluorescent weak base, acridine orange, was used to screen the ability of experimental agents to alter vesicular pH in chromaffin cells and, for those that were found to do so, obtain estimates of the rates of the responses (Barasch et al. 1988; Sulzer & Rayport, 1990; Takamori et al. 2000; Williams & Webb, 2000). Acridine orange trapping was monitored in cells in situ by two-photon microscopy. After the chromaffin cells were exposed to acridine orange, punctate concentrations (0.5-0.7 μm in diameter) of cytoplasmic fluorescence appeared (Fig. 1A and B). The diameter of the fluorescent spots was about twice that of individual chromaffin vesicles (≈0.3 μm in diameter). Individual chromaffin vesicles are too small to be resolved individually by the light at the wavelength (520 nm) emitted by acridine orange; the punctate fluorescence could have originated either from single vesicles or from small aggregates of vesicles. Acridine orange, which is known to enter nuclei and intercalate with chromatin, also induced nuclear fluorescence in some cells.
Figure 1.

Acidification of intracellular organelles in rat chromaffin cells exposed to high K+ or DMPP
Acidification of intracellular sites as observed by acridine orange accumulation was apparent after exposure to the 50 mm K+ (A, before; B, 40 min after 50 mm K+). Scale bar: 10 μm. C, mean increase in fluorescence (± s.e.m.) for cytoplasmic regions of interest in 16 cells in 16 separate micrographs. D, increase in punctate fluorescence emission over time for a single chromaffin cell. E, the increased fluorescence due to exposure to 10 μm DMPP was blocked by the vH+-ATPase inhibitor bafilomycin (500 nm), in Ca2+-free medium, and by the Cl− channel inhibitor NPPB (30 μm; mean ± s.e.m. of controls, >10 regions of interest per condition).
Stimulation of rat chromaffin cells with 50 mm K+ greatly increased the punctate fluorescence (Fig. 1C and D). This increase reached a maximum after approximately 40 min of exposure. The K+-induced increase in punctate fluorescence was observed in every chromaffin cell examined (n = 16). Stimulation of cells with a nicotinic agonist, DMPP (10 μm, 10 min), also caused the punctate fluorescence to increase significantly (P < 0.01, ANOVA). Both the DMPP-induced increase in punctate fluorescence and that evoked by high K+ were abolished by the vH+-ATPase inhibitor bafilomycin (500 nm), the plasma membrane-permeable Cl− channel blocker NPPB (30 μm), and by carrying out the studies in Ca2+-free media (Fig. 1E). These observations suggest that the high-K+- and DMPP-enhanced trapping of acridine orange in cytoplasmic puncta each require vH+-ATPase activity, Cl− channel permeability and extracellular Ca2+. Identical results were observed in mouse and bovine adrenal chromaffin cells (not illustrated).
Ultrastructural identification of chromaffin vesicles
The intracytoplasmic compartments responsible for weak base trapping cannot be identified with certainty by fluorescence microscopy with acridine orange. We therefore studied the trapping of another weak base, 3-(2,4-dinitroanilino)-3′-amino-N-methyldipropylamine (DAMP), which, like acridine orange, accumulates in acidic compartments, but can be fixed in situ and visualized by electron microscopy (Anderson et al. 1984; Anderson & Pathak, 1985). DAMP thus identifies the organelles responsible for the stimulation-dependent acidification originally detected with acridine orange. Intracellular DAMP was detected by post-embedding immunocytochemistry with immunogold. The number of gold particles within an organelle reflects the intracellular concentration of DAMP, which is, in turn, proportional to the ΔH+ across the membrane that separates the interior of the organelle from the cytosol. By quantifying the numbers of gold particles, therefore, the ΔH+ could be estimated. DAMP would accumulate in cytoplasmic organelles if either the interior of the organelle became more acidic or the cytosol became more alkaline. Lysosomes are constitutively acidic and would trap more DAMP if the cytosol became alkaline; therefore, the degree to which lysosomes trapped DAMP provided a measurable reference that was employed to verify whether the observed stimulation-induced change in the ΔH+ across the membranes of chromaffin vesicles was due to an alkalinization of the cytosol. Since neither K+ nor DMPP caused any change in the numbers of gold particles associated with lysosomes (see below), the cytosol did not alkalinize. The K+- and DMPP-induced increases in the number of gold particles associated with chromaffin vesicles thus reflected vesicle acidification. The number of DAMP particles in nuclei was also determined and used as a reference to estimate the pH within cytoplasmic organelles, assuming that the intranuclear pH is a stable 7.0.
In cultures of rat chromaffin cells, DAMP was found to accumulate in dense-cored secretory vesicles both under control (resting) and stimulated conditions (Fig. 2 and Fig. 3). The calculated average intravesicular pH of the vesicles of non-stimulated cells was 5.5, a value consistent with that reported in previous studies (Fig. 4; Table 1; Pollard et al. 1979; Njus et al. 1986; Johnson, 1988). Two subpopulations of dense-cored secretory vesicles were identified. In one, the vesicular membrane fitted tightly around the dense cores, while in the other the vesicular membrane was loosely fitting, leaving an electron-lucent halo of >50 nm separating the dense core from the vesicular membrane. The vesicles of the first population, with tightly fitting membranes, were called stable, while the vesicles of the second population, with halos, were called active because their numbers increased when cells were exposed to secretagogues (see below). About 84 % of the dense-cored secretory vesicles of unstimulated cells were classified as stable and only 16 % appeared to be active (Fig. 3).
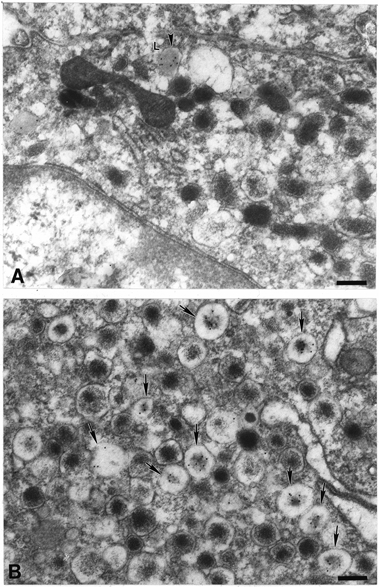
Figure 2.
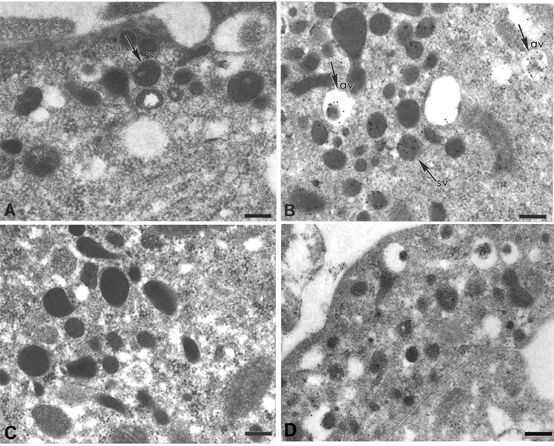
Effects of bafilomycin and NPPB on K+-induced changes in the acidification and morphology of vesicles in cultured chromaffin cells
The acidity of vesicles in rat chromaffin cultures was evaluated by using immunogold labelling to detect the trapping of the weak base DAMP. A, control. A number of dense-cored vesicles can be seen in the field. None has become labelled by incubation with DAMP. Note that most of the vesicles lack electron-lucent halos and are thus stable vesicles (sv). B, 50 mm K+ for 40 min. Several of the dense-cored vesicles in the field have trapped DAMP. Some of these vesicles possess halos around the dense cores and are thus active vesicles (av). Note that the dense cores of the active vesicles tend to be less electron-dense than those of neighbouring stable vesicles. C, 50 mm K+ plus bafilomycin (500 nm for 40 min). The K+-induced trapping of DAMP within dense-cored vesicles is abolished. Almost all vesicles are stable in morphology. D, 50 mm K+ plus NPPB (30 μm) for 40 min. The K+-induced trapping of DAMP within dense-cored vesicle is again prevented. Many active vesicles, however, can be seen in the field. Scale bars: 200 nm.
Figure 3.
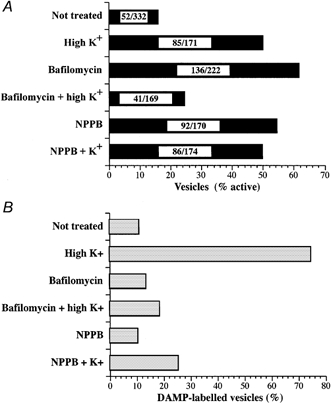
Fraction of active and DAMP-labelled dense-cored chromaffin vesicles
The percentage of active vesicles (A) and the percentage of DAMP-labelled vesicles (B) for each condition are indicated. Cultured bovine chromaffin cells were exposed to high K+ in the absence or presence of inhibitors of vH+-ATPase (bafilomycin) or flux through chloride channels (NPPB). The numbers of dense-cored vesicles assayed in each condition are indicated within the bars in A, as number of active vesicles/total number of vesicles. The data are non-parametric.
Table 1.
Effects of experimental perturbations on the sizes and internal pH of the secretory vesicles of cultured bovine chromaffin cells
| All vesicles | Active vesicles | Stable vesicles | |
|---|---|---|---|
| Percentage cytoplasmic area occupied by vesicles | |||
| Not treated | 11.6 | 3.7 | 7.9 |
| High K+ | 9.3 | 6.1 | 3.2 |
| Bafilomycin | 34.6 | 25.0 | 9.6 |
| Bafilomycin + K+ | 13.6 | 5.4 | 8.1 |
| NPPB | 31.7 | 23.3 | 8.4 |
| NPPB + K+ | 18.3 | 10.1 | 8.2 |
| Area of individual vesicular pro files (μm2) | |||
| Not treated | 0.027 ± 0.002 | 0.054 ± 0.010 | 0.022 ± 0.001 |
| High K+ | 0.041 ± 0.003 | 0.054 ± 0.005 | 0.028 ± 0.002 |
| Bafilomycin | 0.031 ± 0.002 | 0.036 ± 0.002 | 0.022 ± 0.001 |
| Bafilomycin + K+ | 0.029 ± 0.002 | 0.047 ± 0.004 | 0.023 ± 0.001 |
| NPPB | 0.035 ± 0.002 | 0.048 ± 0.004 | 0.020 ± 0.001 |
| NPPB + K+ | 0.025 ± 0.001 | 0.026 ± 0.002 | 0.024 ± 0.002 |
| Mean DAMP density in a single vesicle (gold particles μm−2) | |||
| Not treated | 33.6 ± 3.9 | 84.5 ± 15.7 | 9.9 ± 1.9 |
| High K+ | 126.1 ± 7.4 | 170.4 ± 15.2 | 41.2 ± 7.5 |
| Bafilomycin | 5.9 ± 1.3 | 6.0 ± 1.7 | 5.8 ± 1.9 |
| Bafilomycin +K+ | 19.3 ± 2.8 | 46.4 ± 12.9 | 1.3 ± 1.1 |
| NPPB | 4.1 ± 1.1 | 4.3 ± 1.5 | 3.8 ± 1.7 |
| NPPB + K+ | 23.2 ± 5.4 | 38.8 ± 13.4 | 4.1 ± 2.0 |
| Average pH | |||
| Not treated | 5.5 | 5.1 | 6.1 |
| High K+ | 5.0 | 4.8 | 5.5 |
| Bafilomycin | 6.3 | 6.3 | 6.3 |
| Bafilomycin + K+ | 5.8 | 5.4 | 6.9 |
| NPPB | 6.5 | 6.4 | 6.5 |
| NPPB + K+ | 5.7 | 5.5 | 6.5 |
The effects of the exposure of cultured bovine chromaffin cells to high K+ in the absence or presence of inhibitors of vH+-ATPase (bafilomycin) or flux through chloride channels (NPPB). Values of the area and mean DAMP density are shown as mean ± s.e.m. Cytoplasmic area occupied by vesicles and average pH are non-parametric data. All pH estimates are assessed relative to the nucleus, the internal pH of which is assumed to be 7.0. The numbers of vesicles assayed per condition are shown in Fig. 3.
The mean areas of the profiles of individual active vesicles were larger than those of stable vesicles (P < 0.01, Mann-Whitney U test; Table 1). If chromaffin vesicles are spherical, the measured profile area would yield a calculated average volume of active vesicles that is 3.8-fold that of stable vesicles. The dense cores of active vesicles usually were smaller and/or more electron-lucent than those of stable vesicles; the difference between the core diameters of the two types of vesicle was difficult to quantify, however, because the borders of the dense cores of active vesicles were indistinct (see Fig. 2B). The pH of the interiors of active vesicles (pH 5.1) was found to be significantly lower than that of the interiors of stable vesicles (pH 6.1) (a 10-fold difference in H+ concentration; Table 1, P < 0.0001, Mann-Whitney U test).
Stimulation decreased vesicular pH.
When cultured chromaffin cells were exposed to high K+ (50 mm; 40 min) in the presence of DAMP (Fig. 2B), a higher fraction of vesicles were labelled by DAMP than in controls (P < 0.0001, χ2 test; Fig. 3), and the mean pH of the interiors of the total population of dense-cored vesicles decreased by 0.5 pH units (P < 0.0001, Mann-Whitney U test; Table 1). While active vesicles continued to be more acidic than stable vesicles, stimulation acidified active vesicles by 0.3 pH units and stable vesicles by 0.6 pH units (P < 0.01 for both active and stable vesicles, Mann-Whitney U test).
Stimulation decreases the proportion of cytoplasmic volume occupied by chromaffin vesicles.
Stimulation of chromaffin cells with high K+ caused the proportion of the volume of cytoplasm occupied by vesicles to become ≈20 % smaller than that of non-stimulated control cells (Table 1). In contrast, the average volume of individual vesicles (calculated for spherical vesicles from the profile areas; Table 1) increased by 88 % after stimulation. It follows, therefore, that stimulation with high K+ decreased the total number of chromaffin vesicles. This change probably reflects the effects of exocytosis. The number of vesicles remaining in the cytoplasm after stimulation with high K+ was estimated from the areas of the individual vesicles and the cytoplasmic volume occupied by vesicles (Table 2). The stimulation-induced decrease in vesicle numbers suggests that at least half of the initial population of vesicles were subjected to exocytosis during stimulation. Since new vesicles might also form during stimulation, this estimate of vesicle loss due to exocytosis might be low.
Table 2.
Calculated estimates of the numbers of vesicles per 10 μm2 of chromaffin cell cytoplasm before and after stimulation with high K+
| Condition | Total* | Active** | Stable | Ratio (active/stable) | |||
|---|---|---|---|---|---|---|---|
| Not treated | 43.1 | 6.7 | 36.3 | 0.19 | |||
| High K+ | 22.7 | 11.3 | 11.4 | 0.99 | |||
| Percentage of not treated | 53 | 167 | 31 (58†) | ||||
| Bafilomycin | 111.8 | 68.6 | 43.3 | 1.58 | |||
| Bafilomycin + high K+ | 47.0 | 11.4 | 35.7 | 0.32 | |||
| Percentage of bafilomycin | 42 | 17 | 82(7) | ||||
| NPPB | 90.8 | 49.2 | 41.6 | 1.18 | |||
| NPPB + high K+ | 73.4 | 36.2 | 37.1 | 0.98 | |||
| Percentage of NPPB | 81 | 74 | 89(5) |
**The proportions of active and stable vesicles in each population of vesicles were calculated by using the percentage of active vesicles (Table 1) for each experimental condition, f The numbers in parentheses indicate the percentage of stable vesicle population decrease in relation to the total number of vesicles; ((stablenottreated − stabletreated)/totalnottreated) ± 100.
The proportion of vesicles classified as stable or active was determined in K+-stimulated and non-stimulated cells. The proportions of the two types of vesicle were dramatically altered by K+ stimulation (P < 0.0001, χ2 test; Fig. 3). Following stimulation of chromaffin cells with high K+, the estimated number of active vesicles per 10 μm2 increased from 6.7 to 11.3 while that of stable vesicles decreased from 36.3 to 11.4. The ratio of active to stable vesicles thus changed substantially, from 0.19 in resting cells to 0.99 in cells stimulated with high K+. These data are consistent with the possibility that vesicles convert from a stable to an active morphology (in which the volume of individual vesicles is larger) prior to exocytosis. Exocytosis appears to occur exclusively or predominantly from the pool of active vesicles (see also below).
Effect of bafilomycin and NPPB.
When chromaffin cells were exposed to bafilomycin (500 nm, 70 min), the amount of DAMP trapped in dense-cored vesicles decreased, confirming that the ΔH+, and therefore DAMP trapping in these vesicles, is vH+-ATPase-dependent (Fig. 4). When chromaffin cells were stimulated with high K+ in the presence of bafilomycin, the interiors of dense-cored vesicles did not acidify to the same extent as they did when cells were similarly stimulated with high K+ in the absence of bafilomycin (Fig. 2C and Fig. 3, Table 1; P < 0.01, Mann-Whitney U test); nevertheless, the ratio of the H+ concentration in the interiors of chromaffin vesicles of cells stimulated with high K+ in the presence of bafilomycin to that found in non-stimulated cells exposed to bafilomycin was still increased (Fig. 4, inset). In fact, this ratio was the same, whether or not cells were exposed to bafilomycin. Bafilomycin, therefore, affects the degree to which the interiors of vesicles can become acidic, but bafilomycin evidently does not affect the coupling of vesicle acidification to high K+ stimulation.
Similar effects were observed when chromaffin cells were exposed to the broad-spectrum inhibitor of Cl− channel permeability, NPPB (Pollock et al. 1998). NPPB decreased the degree to which vesicles became acidic following stimulation with high K+; however, as was the case with bafilomycin, the ratio of the H+ concentration in the interiors of the chromaffin vesicles of K+-stimulated cells to that of the vesicles of non-stimulated cells was the same whether or not cells were exposed to NPPB (Fig. 2D and Fig. 4, Table 1, P < 0.01, Mann-Whitney U test). These data indicate that both the activity of vH+-ATPase and Cl− channels regulate the extent to which vesicles can acidify.
When non-stimulated chromaffin cells were exposed to bafilomycin or NPPB, the estimated total number of chromaffin vesicles was found, surprisingly, to increase by 2.6- and 2.1-fold, respectively (Table 2). At the same time, the size of individual vesicles with either an active or a stable morphology was smaller in bafilomycin- or NPPB-treated cells compared with untreated controls (Table 1). As also observed for cultures that were not exposed to bafilomycin or NPPB, exposure to high K+ decreased the numbers of chromaffin vesicles when stimulation was carried out in the presence of bafilomycin or NPPB (see Table 2). This decrease in the number of vesicles was not very different when cells were stimulated with high K+ in the absence (to 53 % of that in non-stimulated cells) or presence of bafilomycin (to 42 % of that in cells exposed only to bafilomycin). In contrast, the number of vesicles was decreased much less substantially by exposure to high K+ in the presence of NPPB (to 81 % of that in cells exposed only to NPPB). These observations are consistent with the possibility that stimulation-dependent exocytosis is antagonized by NPPB but not by bafilomycin.
In the absence of either bafilomycin or NPPB, the high-K+-induced decline in the number of vesicles was accompanied by a shift in the ratio of active to stable vesicles from 0.19 to 0.99 (Table 2). This shift, like that of the numbers of vesicles discussed above, is compatible with the idea that stimulation causes vesicles with a stable morphology to become active. When cells were similarly stimulated in the presence of bafilomycin, the ratio of active to stable vesicles changed from 1.58 to 0.32. Thus, in chromaffin cells exposed to bafilomycin, a greater proportion of vesicles displayed an active morphology prior to stimulation with high K+. In this case, stimulation reduced the total number of vesicles, primarily at the expense of the active pool, which is thus diminished, decreasing the active-to-stable ratio. The number of stable vesicles did not change much after cells were stimulated with high K+ in the presence of bafilomycin (Table 2). This observation suggests (i) that bafilomycin may have blocked the K+-stimulation-induced conversion of vesicles from a stable to an active morphology, and (ii) that stable vesicles are unable, or less able, to undergo exocytosis than active vesicles.
In the presence of NPPB the ratio of active to stable vesicles changed from 1.18 to 0.98 (Table 2). Again, as with bafilomycin, exposure to NPPB increased the proportion of vesicles with an active morphology prior to stimulation with high K+. Stimulation in the presence of NPPB moderately reduced the total number of vesicles; however, the ratio of active to stable vesicles hardly changed as a result of stimulation. NPPB, therefore, may interfere both with the loss of vesicles from the active pool due to exocytosis and with the conversion of stable to active vesicles.
Stimulation-induced vesicular acidification is not dependent on exocytosis
Because high K+ and DMPP induce exocytosis, the vesicles that are induced by these secretagogues to acidify might be those that have not yet undergone exocytosis, those that have been retrieved from the plasma membrane following endocytosis, or both. To determine which population(s) of chromaffin vesicles undergo stimulus-induced acidification, we exposed cultured chromaffin cells to cationic ferritin, a marker that labels the outside surface of the plasma membrane (Farquhar, 1978). Because the membrane of secretory vesicles fuses with the plasma membrane during exocytosis, the ectodomains of vesicular membrane proteins become exposed to cationic ferritin. Vesicles that have been retrieved following exocytosis while cells are exposed to cationic ferritin can thus be identified because their luminal surface is labelled by cationic ferritin. The iron cores of ferritin molecules are electron-dense and can be discerned in electron micrographs; however, the identification of ferritin was also confirmed in the current experiments by immunocytochemistry.
Chromaffin cells that were incubated with DAMP and cationic ferritin were stimulated with high K+ in order to investigate the relationship between stimulation-induced vesicle acidification and recycling. Double label immunocytochemistry was employed to identify simultaneously vesicles that were induced by K+-stimulation to trap DAMP and the cationic ferritin-labelled vesicles that had undergone recycling following exocytosis. DAMP and cationic ferritin immunoreactivities were identified, respectively, with 5 nm and 10 nm particles of immunogold. As expected, cationic ferritin was observed to label the outer surface of the plasma membrane of all of the chromaffin cells that were incubated in its presence (Fig. 5A), and was also observed in many internal vesicles, which were thus identified as endosomes containing internalized plasma membrane. In neither stimulated nor resting cells was cationic ferritin found to be present in chromaffin vesicles with either a stable or active morphology (Fig. 5A and B). No ferritin was found in 204 counted chromaffin vesicles in non-stimulated cells or in 312 of the vesicles counted in stimulated cells. DAMP-labelled dense-cored vesicles were not labelled by cationic ferritin. Active vesicles do not arise from recycling and, thus, must reflect an effect of cellular activity upon exocytic vesicles.
Figure 5.

Cationic ferritin and DAMP colocalization in cultured chromaffin cells
A, non-stimulated cells. Cationic ferritin, used as a tracer for endosomes, has a stippled, electron-dense appearance and is labelled with 10 nm diameter immunogold particles. DAMP, used to indicated acidic organelles, is immunolabelled with 5 nm immunogold particles. The plasma membrane (arrowheads) and examples of cationic ferritin-labelled endosomal structures (larger arrows and inset) are indicated. DAMP-containing active dense-core vesicles (small arrows) do not display cationic ferritin. B, in stimulated chromaffin cells, cationic ferritin also does not appear in active dense-cored vesicles (arrows as in A). Scale bar: 200 nm.
The suggestion derived from the above-described morphological experiments with cationic ferritin, that stimulation-induced acidification of chromaffin vesicles is independent of exocytosis was tested in another system. Exocytosis can be inhibited in many cells by botulinum toxins, which cleave SNAP-25 (Banerjee et al. 1996), a component of the SNARE complex, which participates in the fusion of vesicles with the plasma membrane (Martin, 1994). Unfortunately, however, incubation with botulinum toxins does not effectively block secretagogue-stimulated exocytosis in adrenal chromaffin cells (Penner et al. 1986). To test the relationship of the acidification of secretory vesicles to exocytosis, therefore, we used a neuroblastoma-derived cell line, Neuro2A, which exhibits stimulation-dependent secretion from dense-cored vesicles (Chevrier et al. 1991) and produces transformed lines more reliably and stably than lines of cells derived from the adrenal medulla. Neuro2A cells were stably transfected with cDNA encoding the light chain of botulinum toxin E. When botulinum toxin is expressed in neuroblastoma-derived cells (Aguado et al. 1997), SNAP-25 is totally cleaved and exocytosis is abolished.
The fluorescence of acridine orange was monitored in live native and botulinum toxin E-expressing Neuro2A cells by means of 2-photon fluorescence microscopy in order to evaluate the acidity of secretory vesicles. When the Neuro2A cells were stimulated with 50 mm K+, acridine orange accumulated intracellularly with a punctate distribution, just as it did in similarly stimulated chromaffin cells. The stimulation-induced trapping of acridine orange occurred in both native and botulinum toxin E-expressing Neuro2A cells (Fig. 6). The expression of botulinum toxin E therefore did not inhibit the stimulation-induced trapping of acridine orange by Neuro2A cells. These observations suggest that stimulation-induced acidification of secretory vesicles occurs whether or not vesicles are able to fuse with the plasma membrane. Vesicles that acidify in response to high-K+ stimulation thus are not limited to those that are retrieved from the plasma membrane following exocytosis.
Figure 6.
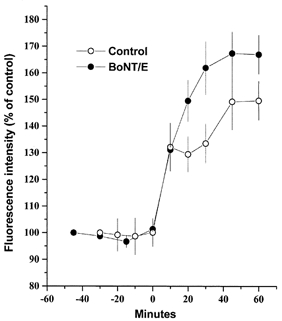
Effect of botulinum toxin E expression on stimulation-dependent vesicle acidification
Stimulation-dependent acidification of intracellular sites in native Neuro2A cells (○) and cells expressing BoNT/E-LC (•), as observed by acridine orange accumulation after exposure to 50 mm K+ (added at time = 0 min). Each data point represents n = 3 experiments (± s.e.m.), with >30 cells imaged per experiment.
Stimulation acidifies chromaffin vesicles in vivo
Cultured adrenal chromaffin cells are subject to constitutive or frequent stimulation, raising the possibility that the phenomenon of stimulation-induced acidification might only occur in vitro. To examine whether stimulation-dependent vesicle acidification also occurs in vivo, we administered DAMP systemically to rats. After 40 min, the DAMP-treated rats were injected intravenously, either with vehicle or with the nicotinic receptor agonist, DMPP, which acts on adrenal chromaffin cells as a powerful secretagogue (Nagayama et al. 1999). Five minutes following DMPP injection, the animals were rapidly anaesthetized and their adrenal medullae removed. DAMP was visualized by electron microscopic immunocytochemistry and its intracellular distribution analysed.
After administration of DMPP, the fraction of vesicles identified morphologically as active was ≈4-fold greater than the fraction of active vesicles in vehicle-treated animals (Fig. 7, Table 3, P < 0.01, χ2 test). As in the in vitro studies, active vesicles were substantially more acidic than stable vesicles (Table 3, P < 0.01, Mann-Whitney U test). Administration of DMPP caused the total vesicle population to become more internally acidic (P < 0.01 vs. control; Mann-Whitney U test). This change was mainly due to the profound acidification of the subfraction of vesicles that were classified as active (P < 0.01 vs. control; Mann-Whitney U test). The internal acidity of the subfraction of vesicles classified as stable was not significantly altered by treatment with DMPP. The average volume of the vesicles (calculated for spherical vesicles from the profile areas; Table 3) was increased by 33 %. The proportion of the volume of cytoplasm occupied by stable vesicles decreased from 12.8 to 6.9 % in response to DMPP, while the proportion of the volume of cytoplasm occupied by active vesicles increased from 4 to 11.3 % (Table 3). These observations are consistent with the possibility that DMPP stimulation causes vesicles to convert from a stable to an active morphology.
Figure 7.
Effects of the nicotinic receptor agonist DMPP on the acidification and morphology of vesicles of chromaffin cells in vivo
A, vehicle-injected control. Both active and stable dense-cored vesicles are present. Although few are labelled with DAMP, a highly labelled lysosome (L) is present. The trapping of DAMP within the lysosome indicates that the injected DAMP has entered the chromaffin cell and that its distribution reflects the ΔH+ gradient across the membrane of this organelle. B, DMPP treated. More chromaffin vesicles exhibit an active morphology (arrows) with halo around the dense cores. Note also that many of the vesicles are now labelled with DAMP (see also Table 3). Scale bars: 200 nm.
Table 3.
The effects of the in vivo administration of DMPP on the morphology, size and internal acidity of rat chromaffin vesicles
| Condition | Vesicle morphology ( % active) | DAMP-labelled vesicles ( %) | |
|---|---|---|---|
| Not treated | 10.9 (60/548) | 1.5 | |
| DMPP | 47.6 (246/517) | 24.5 | |
| Size and internal acidity of vesicle populations | |||
| All vesicles | Active vesicles | Stable vesicles | |
| Percentage of cytoplasmic area occupied by vesicles | |||
| Not treated | 16.8 | 4.0 | 12.8 |
| DMPP | 18.2 | 11.3 | 6.9 |
| Area of individual vesicular profiles (μm2) | |||
| Not treated | 0.018 ± 0.011 | 0.037 ± 0.031 | 0.013 ± 0.006 |
| DMPP | 0.022 ± 0.006 | 0.028 ± 0.002 | 0.016 ± 0.005 |
| Mean DAMP density in a single vesicle (gold particles μm−2) | |||
| Not treated | 0.63 ± 0.32 | 1.39 ± 0.75 | 0.51 ± 0.35 |
| DMPP | 33.26 ± 3.79 | 65.27 ± 7.20 | 2.32 ± 1.38 |
| Average pH | |||
| Not treated | ∼7.0 | 6.6 | ∼7.0 |
| DMPP | 5.2 | 4.9 | 6.4 |
There were 548 vesicles analysed in control and 517 vesicles in DMPP-treated animals. The background density of gold particles (determined in preparations not exposed to DAMP) was 0.58 grains μm−2. All pH estimates are assessed relative to the nucleus, which is assumed to be pH 7.0.
In contrast to cultured chromaffin cells, the internal pH of most of the secretory vesicles of the chromaffin cells of control animals fixed in situ was close to neutral. For this reason, we utilized the internal pH of lysosomes, which are constitutively acidic (Van Dyke, 1996), as a positive internal control. In contrast to chromaffin vesicles, lysosomes were highly labelled in cells from both control and DMPP-treated animals. The average pH of lysosomes was 5.2 (n = 25) in cells from control animals and 5.4 (n = 14) in those from rats exposed to DMPP. DMPP stimulation, therefore, did not change the H+ gradient across the limiting membranes of lysosomes, suggesting that stimulation did not significantly alter the pH of the cytosol. The accumulation of DAMP in lysosomes, moreover, confirmed that our method would have detected internal acidity in vesicles if it had been present. The data also demonstrate that the stimulation-evoked changes in the ΔpH across the membranes of chromaffin vesicles were due to vesicle acidification rather than alkalinization of the cytosol.
Stimulation-induced acidification of small synaptic vesicles
To determine whether the acidification of secretory vesicles induced by stimulation with secretagogues applies only to the vesicles of endocrine cells, small synaptic vesicles were examined in the axons terminals of neurons in the myenteric plexus of the gut. Both large dense-cored and small electron-lucent vesicles are found in the varicosities of these terminal axons (Gershon & Sherman, 1982). The longitudinal muscle was dissected with the adherent myenteric plexus from the wall of the guinea-pig small intestine and incubated with DAMP in oxygenated Krebs solution in vitro. The thickness of these preparations averaged ≈50 μm. The ongoing spontaneous discharge of action potentials was blocked by the addition of tetrodotoxin. In control preparations, tetrodotoxin was maintained throughout the experimental period. In experimental preparations, tetrodotoxin was washed out and replaced for 30 min with stimulation media containing Gd3+ (500 μm) or veratridine (1 μm). Gd3+ is an agonist at the G-protein-coupled plasmalemmal Ca2+ receptor that is expressed in the myenteric plexus (Cheng et al. 1999), while veratridine is an activator of voltage-sensitive Na+ channels and has previously been demonstrated to activate enteric neurons (Mawe & Gershon, 1986)
In the control preparations, the DAMP immunoreactivity of both small clear, and large dense-cored vesicles was not different from background (Fig. 8A). Lysosomes, however, which were examined in the perikarya and proximal processes of the same neurons as a positive control, were highly labelled by DAMP (Fig. 8A, inset). Stimulation, either with Gd3+ (Fig. 8B), or veratridine (Fig. 8C), induced the trapping of DAMP in both small synaptic vesicles and large dense-cored vesicles. The proportion of small synaptic vesicles labelled by DAMP in preparations stimulated with Gd3+ increased from 1 % in control cultures to 5 % (P < 0.01, Fisher's exact test) and the DAMP labelling of large dense-cored vesicles increased from 0 % to 17 % (P < 0.05, Fisher's exact test). Similarly, when cultures were exposed to veratridine, the proportion of small synaptic vesicles labelled by DAMP was increased from 1 % in control cultures to 12 % (P < 0.01, Fisher's exact test), and the proportion of DAMP-labelled large dense-cored vesicles increased from 0 % in controls to 11 % (P < 0.05, Fisher's exact test). Due to the small area of the vesicles, which are ≈50-fold smaller than dense-cored chromaffin vesicles, and small numbers of gold particles over individual vesicles, we did not attempt to calculate the intravesicular pH. These observations suggest that the activation of neurons, like that of endocrine cells, causes the interiors of secretory vesicles (in the case of neurons, both small synaptic and large dense-cored) to become more acidic. The phenomenon thus does not appear to be limited to endocrine cells.
Figure 8.
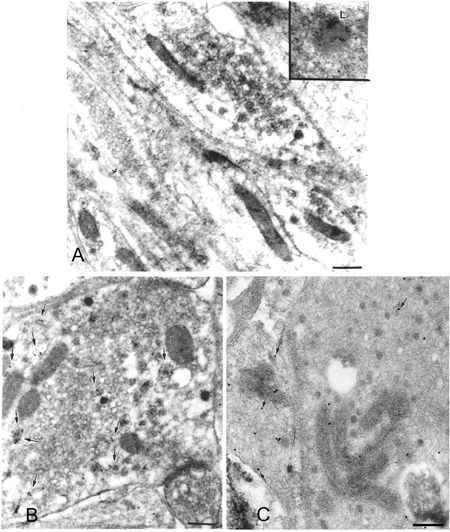
Effects of stimulation on the acidification of small and large synaptic vesicles of rat myenteric neurons
A, in control preparations of rat myenteric neurons in which spontaneous activity of neurons was blocked by the addition of tetrodotoxin, synaptic vesicles contained very little DAMP. In contrast, lysosomes, which are abundant in the enteric perikarya, were highly labelled (inset). B, stimulation of myenteric neurons with Ca2+ receptor agonist, Gd3+ (500 μm for 30 min) in the presence of DAMP. Arrows indicate small and large synaptic vesicles labelled with DAMP. C, rat myenteric neurons were stimulated with the Na+ channel activator veratridine (1 μm for 30 min) in the presence of DAMP. Both small clear and large dense-cored synaptic vesicles were labelled (arrows). Scale bars: 100 nm.
Effect of stimulation on quantal size
It is often assumed that chromaffin vesicles are fully loaded with catecholamines (Johnson, 1988). Recent evidence from related cells, however, has suggested that this assumption may not be correct. Exposure of PC12 cells, a pheochromocytoma-derived cell line, and dopaminergic neurons from the ventral midbrain, to the catecholamine precursor, l-DOPA prior to stimulation increases the number of catecholamine molecules per secreted quantum (Pothos et al. 1996, 1998). The assumption that chromaffin vesicles are constitutively filled to their maximum capacity with catecholamines was tested in cultured chromaffin cells by using amperometry with carbon fibre electrodes in combination with electrochemical detection (Michael & Wightman, 1999; Sulzer & Pothos, 2000). As was observed with PC12 cells and dopaminergic neurons, exposure of cultured bovine chromaffin cells to l-DOPA was found to increase the quantal size of secreted catecholamines (Table 4). After the chromaffin cells were treated with 100 μml-DOPA for 40 min, catecholamine release per quantum reached 173 % of control levels (P < 0.0001 by two-way ANOVA of the means). These observations indicate that the vesicles of adrenal chromaffin cells, like those of other catecholaminergic cells and neurons that have previously been investigated, are not constitutively filled to their capacity, but can store more and do so when the cytosolic concentration of catecholamine is raised by administration of precursor.
Table 4.
Quantal analysis of catecholamine release from cultured bovine adrenal chromaffin cells
| Mean quantal size | Mean quantal size | Amplitude | t1/2 | Interspike intervals | |
|---|---|---|---|---|---|
| per cell | for all quanta | (pA) | (ms) | (ms) | |
| Control | 1470000 ± 158000 | 1615000 ± 67 000 | 11.6 ± 1.7 | 35.5 ± 6.5 | 796 ± 24 |
| (100 %) | (100 %) | ||||
| K+ | 2053 000 ± 191000* | 1851 000 ± 78000* | 10.5 ± 0.9 | 25.6 ± 3.8 | 717 ± 21 |
| (139.7 %) | (114.5 %) | ||||
| l-DOPA | 2541 000 ± 438 000* | 2708 000 ± 223 000* | 26.5 ± 5.5* | 9.6 ± 1.1* | 500 ± 41* |
| (172.9 %) | (167.6 %) | ||||
| Bafilomycin | 905000 ± 103000* | 935 000 ± 66 000* | 5.0 ± 0.6* | 25.5 ± 2.7* | 988 ± 35* |
| (61.5 %) | (57.8 %) |
Quantal release events recorded from control (1410 events from 24 cells), high-K+-exposed (50 mm) for 40 min, 1536 events from 54 cells), bafilomycin-treated (500 nM for 70 min, 405 events from 12 cells) and L-DOPA-exposed (100 μm for 40 min, 359 events from 14 cells) bovine adrenal chromaffin cell cultures. Amplitude, t1/2 and width are reported as mean ± s.e.m. of the values from each cell recorded. * Values are significantly different from controls with P < 0.01 by one-way ANOVA of the means.
The observation that the loading of chromaffin vesicles with catecholamine is enhanced when the driving force of the transmembrane concentration gradient is increased suggests that vesicular loading might also be enhanced when another driving force, the transmembrane pH gradient, is increased. Studies of weak base trapping (described above) suggest that chromaffin vesicles become more acidic after the cells are exposed to secretory stimuli. If an increase in the transmembrane pH gradient does enhance the loading of catecholamine into vesicle, then prolonged secretory stimulation would be expected to increase the quantal size of secreted catecholamine. To test this prediction, we used amperometry to compare the quantal size of catecholamine secreted by chromaffin cells maintained for 40 min in the presence of a physiological (2 mm; Fig. 9A) or an elevated (50 mm; Fig. 9B) concentration of K+. Statistical analysis of all quantal events from each group of cells revealed significant increase of the mean quantal size in cells stimulated by high K+ to 115 % of control values (Table 4, P < 0.01, Kolmogorov-Smirnov test). This type of statistical approach, however, is highly vulnerable to outlying values (Colliver et al. 1999). A more accurate statistical analysis can be achieved by comparing the means obtained from each investigated cell (Fig. 9D). When this was done, the mean quantal size per cell in high-K+-treated cells was found to be increased to 140 % of control values (Table 4, P < 0.05 by two-way ANOVA test).
Figure 9.

Effects of high-K+ stimulation and bafilomycin on the size of quanta recorded from bovine chromaffin cells
Sample amperometric recordings from control cells (A), cells stimulated to release with high K+ (B; 50 mm for 40 min) and bafilomycin-exposed cells (C; 0.5 μm for 40 min). The arrows indicate application of a 6 s 80 mm K+ puff as a secretagogue. D, box-and-whiskers plot of the distribution of the median quantal size from each cell recorded. Each distribution is significantly different from the other two (see text). E and F, normal probability distributions of the population of logs of each of the quantal size data points from each group. Histograms of the untransformed distribution of quantal sizes resulting from each treatment are shown as supplemental material.
In order to analyse subpopulations of quantal events, we replotted all data points as a normal probability distribution plot (Fig. 9E). In this format, a straight line indicates a normal (Gaussian) distribution of values. This analysis showed that, while the mean values for high-K+-treated and control cells were close (see also Table 4, first column), the quantal sizes within the highest and the lowest subpopulations of events from the stimulated cells were much larger than those of the equivalent subpopulations of events from control cells. This was particularly striking for the subpopulations of the smaller quantal events. In sum, ≈66 % of all quantal events were increased in size in cells that were subjected to prolonged stimulation with high K+.
To verify that an increase in the transmembrane pH gradient of chromaffin vesicles was required for the altered distribution of quantal size in K+-stimulated cells, we investigated the effects of the vH+-ATPase inhibitor bafilomycin (500 nm) on quantal size (Fig. 9C). The mean quantal size of secreted catecholamine was significantly decreased by bafilomycin to 61 % of control values (Fig. 9D; Table 4, P < 0.01 by two-way ANOVA of the means). In a normal probability distribution plot, the overlap between bafilomycin-treated and control cells occurred only for those events with sizes distributed two or three standard deviations below the mean, indicating that the size of ≈98 % of all quantal events had been decreased by bafilomycin (Fig. 9F). These observations suggest that decreasing the transmembrane pH gradient of chromaffin vesicles diminishes their loading with catecholamine. This suggestion was tested by determining the effect on quantal size of secreted catecholamine of chloroquine, a membrane-permeable weak base, which becomes trapped in acidic compartments and increases their internal pH. Chloroquine has previously been demonstrated to alkalinize dense-cored vesicles in intact cells (Sabban et al. 1990) and to collapse the pH gradient across the membranes of isolated chromaffin vesicles (Sulzer & Rayport, 1990). Chloroquine thus mimics the effect of bafilomycin on the transmembrane pH gradient of chromaffin vesicles, but does so by a different mechanism. Like bafilomycin, chloroquine decreased the mean quantal size of catecholamine secreted by rat chromaffin cells to 49 % of control levels (Fig. 10C, Table 5). The chloroquine-induced shift in the normal probability distribution plot of quantal sizes was quite similar to that induced by bafilomycin (compare Fig. 10E with Fig. 9F). Finally, exposure of bovine chromaffin cells to a chloride channel blocker, NPPB, also induced a statistically significant decrease from control of the mean quantal size of secreted catecholamine (Fig. 10C and F; Table 5, P < 0.05 by two-way ANOVA of the means).
Figure 10.
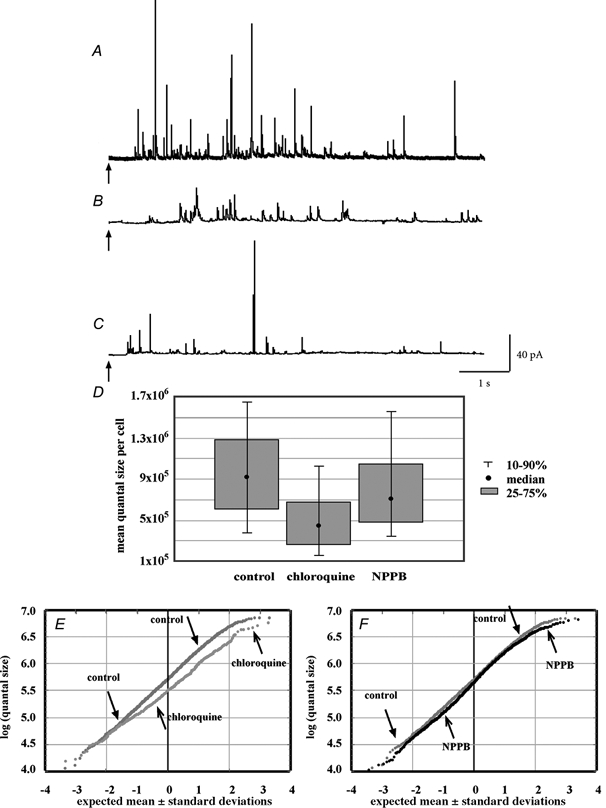
Effects of chloroquine and NPPB on the size of quanta recorded from rat chromaffin cells
Sample amperometric recordings from control cells (A), cells treated with chloroquine (B; 100 μm for 30 min) and NPPB-exposed cells (C; 30 μm for 30 min). D, box-and-whiskers plot of the distribution of the median quantal size recorded from each cell recorded. Each distribution is significantly different from the other two (see text). E and F, normal probability distributions of the population of logs of each of the quantal size data points from each group. Histograms of the untransformed distribution of quantal sizes resulting from each treatment are shown as supplemental material.
Table 5.
Quantal analysis of catecholamine release from cultured rat adrenal chromaffin cells
| Mean quantal size per cell | Mean quantal size for all quanta | Amplitude (pA) | t1/2 (ms) | Interspike intervals (ms) | |
|---|---|---|---|---|---|
| Control | 979000 ± 55000 | 928000 ± 17000 | 15.9 ± 1.5 | 12.0 ± 1.0 | 484 ± 12 |
| (100 %) | (100 %) | ||||
| Chloroquine | 499 000 ± 55 000** | 523 000 ± 22 000** | 11.2 ± 1.8** | 11.0 ± 0.8 | 588 ± 31 |
| (51.0 %) | (56.4 %) | ||||
| NPPB | 828000 ± 51000* | 815000 ± 18000** | 17.4 ± 1.6 | 11.0 ± 1.0 | 288 ± 10** |
| (84.6 %) | (87.8 %) |
Quantal release events recorded from control (4352 events from 84 cells), chloroquine-treated (100 μm for 30 min; 934 events from 29 cells) and NPPB-treated (30 μm for 30 min; 3081 events from 99 cells) rat chromaffin cell cultures. Amplitude, t1/2 and width are reported as mean ± s.e.m. of the values from each cell recorded. *P < 0.05 and **P < 0.01 when compared with controls by one-way ANOVA of the means. The entire population of quantal sizes is plotted in Fig. 10.
DISCUSSION
The current data suggest that the internal pH of secretory vesicles is regulated by secretory stimuli in adrenal chromaffin cells and enteric neurons and not, as previously considered, on the basis of experiments with isolated chromaffin vesicles, to be constitutive. Stimulation of chromaffin cells in vitro or in vivo with high K+ or the nicotinic acetylcholine receptor agonist DMPP causes the internal pH of their secretory vesicles to fall. The effect of secretory stimulation on the internal pH of chromaffin vesicles was paralleled by the effects of comparable stimuli on the synaptic vesicles in the axonal varicosities of enteric neurons. Both veratridine, an agonist at voltage-gated Na+ channels, and Gd3+, an agonist at a plasmalemmal G-protein-coupled Ca2+ receptor, decreased the pH of these synaptic vesicles. Other components of the cisternal space, which like chromaffin and synaptic vesicles express the vH+-ATPase, also regulate transmembrane pH gradients (Nelson et al. 2000; Sonawane et al. 2001). The regulation of the pH of the internal milieu may thus be a phenomenon that is widely shared by the Golgi and post-Golgi elements of the secretory and endosomal pathways. In addition to the decrease in internal pH, we also find that secretory stimulation causes chromaffin vesicles to increase in size and undergo a change in morphology. Whether the stimulation-evoked changes in internal pH, and those in the size and morphology of vesicles, are causally related to one another or correlated events initiated by stimulation, remains to be determined. The observation that the stimulation-evoked change in the morphology of vesicles from stable to active can be mimicked by exposure of cells to agents that block acidification (bafilomycin and NPPB) indicates that the acidification of vesicle interiors that accompanies stimulation is not the cause of their acquisition of an active morphology.
The functional significance of the enhanced acidification of chromaffin vesicles evoked by stimulation was evaluated with respect to their loading with catecholamines. This study was prompted by the critical importance of the transmembrane pH gradient as the driving force behind the transport of catecholamines into vesicles. Analyses of the quantal size of secreted catecholamines suggested that the prior exposure of chromaffin cells to the catecholamine precursor, l-DOPA, and stimulation with high K+ each increased the amount of catecholamine released per quantal event. Bafilomycin and chloroquine, which collapse the proton gradient across the chromaffin vesicle membrane but do so by different means, both reduced quantal size. These observations confirm the dependence of quantal size on the proton gradient of chromaffin vesicles. An increase in quantal size has previously been reported to be elicited by l-DOPA in PC12 cells and ventral tegmental neurons (Pothos et al. 1998; Colliver et al. 2000). A decrease in quantal size was reported in hippocampal neurons in response to bafilomycin (Zhou et al. 2000) and in neurons and chromaffin cells in response to chloroquine and/or other weak bases (Van der Kloot, 1987; Sulzer et al. 1995; Mundorf et al. 1999; Sulzer & Pothos, 2000). These observations, taken as whole, thus support the idea that the loading of chromaffin vesicles with catecholamines reflects the driving force, and is enhanced by increasing either the catecholamine concentration or pH gradients across the vesicular membrane.
The ability of stimulation to regulate the internal pH of secretory vesicles could allow a history of recent or prolonged prior stimulation to facilitate the continuation of secretion by enhancing the vesicle loading. Since the transmembrane pH gradient is also important in the loading of small molecule neurotransmitters into synaptic vesicles and, at least those of the enteric nervous system also become more acidic in response to secretory stimuli, nerve stimulation is likely to enhance the loading of synaptic vesicles in the same way that secretory stimuli enhance the loading of chromaffin vesicles. If so, then the stimulation-induced acidification of those synaptic vesicles that are loaded by pH gradient-dependent mechanisms may, by increasing the size of quantal events, provide a novel presynaptic mechanism of secretory plasticity.
The current experiments employed the trapping of DAMP to assess the internal pH of the vesicles of chromaffin cells that were presumably at rest, including cultured bovine chromaffin cells and the adrenal medullae of unstressed rats. In addition, the synaptic vesicles of enteric neurons were examined after incubation with tetrodotoxin to block the conduction of action potentials and provide a resting state. In each case, the distribution of DAMP in vesicles was found to be heterogeneous. While some vesicles were quite acidic and trapped DAMP, others displayed little or no DAMP labelling. Even more striking was the demonstrable increase in the trapping of DAMP and thus the evident acidification of the interiors of large (trans-Golgi network-derived) secretory vesicles of chromaffin cells and both the large and small (endosome-derived) synaptic vesicles of enteric neurons when these cells were stimulated. In contrast, the trapping of DAMP in lysosomes, which were examined as controls, was equally robust in resting and stimulated chromaffin cells and enteric axonal varicosities. The interiors of lysosomes were very acidic in both control and stimulated secretory cells; therefore, the failure of many of the chromaffin vesicles of resting cells to trap DAMP was not due to a technical problem in the demonstration of DAMP, but instead probably reflected small transmembrane pH gradients in the unlabelled organelles and larger gradients in those that trapped DAMP. The enhanced trapping of DAMP in chromaffin and synaptic vesicles following stimulation, moreover, was not due to an alkalinization of the cytosol, because the trapping of DAMP in lysosomes was unchanged by secretory stimuli. The validity of DAMP as a probe for the pH of vesicles was supported by the inhibition of DAMP labelling of vesicles by bafilomycin and the essentially similar data obtained by real-time (two-photon) analyses of the trapping of acridine orange by subcellular vesicles in living chromaffin cells in vitro.
The interiors of isolated bovine chromaffin vesicles, in contrast to those of intact cells, behave as if they are maximally acidic when they are provided with ATP and suspended in media that are thought to mimic the conditions of the cytosol (Johnson, 1988). It is possible that the state of the chromaffin vesicles isolated from the bovine adrenal medulla reflects stimulation-induced modifications that occurred prior to the death of the animals and the collection of the glands. The slaughter of the cattle from which these glands are obtained is stressful to the animals and stress is a powerful stimulus for adrenal chromaffin cell secretion. In contrast, the rats used to assay chromaffin vesicle acidity in this study undergo little stress prior to anaesthesia. Stimulation of intact thyroid parafollicular cells, for example, has been found to cause a long-lasting change in the Cl− conductance of the membranes of secretory vesicles and luminal acidification, which are retained by the vesicles following their subcellular isolation (Barasch et al. 1988; Cidon et al. 1991). The internal pH of isolated vesicles from bovine chromaffin cells, therefore, may appear to be maximally acidic because they were isolated from stimulated cells.
It is of interest to note that the phenomenon of stimulation-induced acidification occurred both in vivo and in vitro, was seen in different species, in more than one cell type, and was observed after the application of a number of different kinds of secretory stimulation. The injection of the nicotinic agonist, DMPP, into rats led to an even more striking decrease in the apparent pH of chromaffin vesicles (≈1.8 pH units, which corresponds to a 50-fold increase in ΔH+, Table 3) than the exposure of cultured rat or bovine chromaffin vesicles to high K+ (≈0.5 pH units, which amounts to a 4-fold increase in ΔH+; Table 1). Chromaffin vesicles of unstimulated rats in vivo maintained a more neutral pH than vesicles in unstimulated chromaffin cell cultures. It is possible that steps during the isolation or maintenance of the primary cultures activated the cells and induced some vesicular acidification. These factors may include loss of cell-cell contact following culture, or the presence or absence of specific components of the artificial medium or extracellular matrix.
The interiors of large dense-cored and small synaptic vesicles in enteric neurons became more acidic when enteric neurons were stimulated via voltage-gated Na+ channels with veratridine or with Gd3+ via the G-protein-coupled plasmalemmal Ca2+ receptor. Similarly, the secretory vesicles of parafollicular cells, which also express this Ca2+ receptor, have been reported to be acidified by stimulation with thyrotropin (Barasch et al. 1988), high K+ (McGehee et al. 1997), high extracellular Ca2+ (Tamir et al. 1994, 1996), or Gd3+ (Tamir et al. 1996). The coupling of secretory stimuli to the acidification of the interiors of secretory vesicles may thus be independent of the type of secretagogue and applicable to a variety, if not all, types of cell. Conceivably, acidification of storage organelles may be an integral component of regulated secretion. The current investigation appears to have been the first to examine the effects of stimulation on the internal pH of secretory vesicles in vivo.
An increase in the size of the secretory vesicles of chromaffin cells following stimulation has been reported previously and confirmed in the current study (Ornberg et al. 1995). The average volumes of chromaffin vesicles were found to increase significantly both when cells were stimulated in vitro with high K+ and in vivo with DMPP (Tables 1A and 2). Stimulation also induced a change in the morphology of vesicles. In resting cells, the predominant vesicles (≈85 %) were those in which the limiting membrane was typically closely apposed to a well defined dense core. In a much smaller proportion (≈15 %) the limiting membrane was separated from an ill-defined core by a clear halo. Since stimulation increased the proportion of vesicles with halos (to ≈50 %) at the apparent expense of those without (see Table 2), the vesicles that lacked halos were defined as stable and those with halos were defined as active. The stimulation-induced increase in the ratio of active to stable vesicles (from 0.19 to 0.99) suggests that active vesicles are derived from stable vesicles. The stimulation-induced increase in vesicular size in the population of chromaffin vesicles taken as a whole was mainly due to the increase in the proportion of active vesicles, which are larger than stable vesicles (see Table 1).
The trapping of DAMP was most evident in the population of vesicles defined as active, which thus are more internally acidic than their stable counterparts; moreover, the active vesicles of stimulated chromaffin cells are also more acidic than those of resting cells. The volume of isolated mast cell vesicles has been shown to increase due to alterations in transmembrane osmotic gradients (Brodwick et al. 1992). The swelling of chromaffin vesicles in stimulated cells has also been reported previously along with evidence that the phenomenon is related to secretory stimulation and vesicle acidification (Ornberg et al. 1995). Whether an altered osmotic gradient is responsible for the stimulation-induced increase in the volume of chromaffin vesicles in intact cells remains to be demonstrated. The stimulation-evoked increase in vesicle size was inhibited both by bafilomycin and by NPPB, both of which decreased the acidity of chromaffin vesicles. These observations are consistent with the possibility that the stimulation-induced increase in vesicular volume is acidification-dependent; however, other explanations of the effects of these drugs on vesicular volume are possible. Bafilomycin and NPPB were found to exert complex effects on the numbers of vesicles and the proportions of stable and active vesicles. The drugs may thus cause changes in exocytosis and vesicular dynamics that are unrelated to their known actions as inhibitors, respectively of vH+-ATPase and flux through chloride channels. Alternatively, the effects of bafilomycin and NPPB on exocytosis and vesicular dynamics could be indirect and due to actions on the vH+-ATPase and chloride channels of membranes other than those of chromaffin vesicles. Both bafilomycin and NPPB are likely, for example, to affect the Golgi apparatus, the cisternae of which are internally acidified by vH+-ATPase. Such an effect might explain the larger numbers of smaller chromaffin vesicles found in cells exposed to these inhibitors. NPPB, in particular, might also decrease the volume of the cytoplasm by affecting the chloride channels of the plasma membrane. Such a change would account for the NPPB-associated increase in the numbers of chromaffin vesicles per unit of cytoplasmic volume (Table 2).
The observation that the chromaffin vesicles that become most internally acidic following stimulation are those with an active morphology is consistent with the idea that acidification is a prelude to exocytosis. Chromaffin vesicles contain a variety of proteins and peptides as well as catecholamines (Winkler, 1993). The catecholamines enter the vesicles by transmembrane transport (Johnson, 1988), but the proteins and peptides do not. They are packaged in the vesicles at the time of their formation in the TGN. Chromaffin vesicles are thus more analogous to the TGN-derived large dense-cored vesicles of synapses (Winkler, 1993) than to the small endosome-derived synaptic vesicles, which recycle (Hannah et al. 1999). Consistent with these ideas, active vesicles do not appear to arise from recycling of chromaffin vesicles. When cells were stimulated to secrete in the presence of the plasma membrane marker, cationized ferritin, the marker appeared in endosomes, but not in chromaffin vesicles. The stimulation-induced increase in the internal acidity of chromaffin vesicles therefore must occur prior to exocytosis and not afterwards in recycled vesicles. Similarly, the active morphology of chromaffin vesicles must also be acquired prior to exocytosis, and reflect an effect of cellular activity upon the vesicles. The independence of stimulation-induced acidification of secretory vesicles from their subsequent exocytosis was confirmed by the observation that stimulation-induced vesicle acidification was not altered in Neuro-2A cells by the stable expression of botulinum toxin type E to prevent exocytosis.
Relationship between vesicle acidification, volume and quantal size
It is notable that the subfraction of events in which stimulation increased quantal size (66 %) was similar both to the fractions of vesicles that were induced by stimulation to become more internally acidic (64 %; see Table 1, percentage of DAMP-labelled vesicles) and greater in volume (58 %; Table 2). Taken together, these observations are consistent with the possibility that the vesicle subpopulation that is increased in quantal size by stimulation is the same as that that is also increased in internal acidity and volume. Empirical studies with isolated chromaffin vesicles have shown that their accumulation of monoamines is a function of three vesicle/ cytosol gradients: (i) the catecholamine concentration gradient, [A]in /[A]out, (ii) the H+ concentration gradient, [H+ ]in /[H+ ]out, and (iii) the voltage gradient, ΔΨ (Njus et al. 1986; Johnson, 1988). In the current experiments, changes in both the transmembrane catecholamine and H+ concentration gradients were found to be associated with an increase in quantal size, suggesting that each of these changes increases the content of releasable catecholamine in vesicles. Additional factors, including osmotic gradients and the ability to synthesize dopamine in the cytosol, are also likely to affect the vesicular accumulation of catecholamine.
It has recently been reported that the catecholamine precursor, l-DOPA, increases the volume of the catecholamine-containing vesicles of PC12 cells by expanding the halo that separates the dense cores of these vesicles from their limiting membrane (Colliver et al. 2000). Exposure of PC12 cells to l-DOPA has also been found to increase the quantal size of secreted catecholamines (Pothos et al. 1996; Colliver et al. 2000). The stimulation-induced increase in the vesicle volume and quantal size in chromaffin cells observed in the present study are thus consistent with similar observations made with PC12 cells, which are a chromaffin cell-derived tumour cell line. In contrast to these data, which induce perturbations that increase quantal size, reserpine, which in PC12 cells decreases quantal size (Kozminski et al. 1998), decreases the volume of their secretory vesicles (Colliver et al. 2000). These observations suggest that changes in the content of catecholamines may be reflected in the size of vesicles. The reductions of quantal size and the volume of vesicles resulting from exposure to vH+-ATPase inhibitor, bafilomycin, and the chloride channel blocker, NPPB, found in the current study are all consistent with this suggestion.
Possible mechanisms of stimulation-induced vesicle acidification
A variety of mechanisms can be envisioned that might couple stimulation to the acidification of the interiors of secretory vesicles. Changes in the activity of vH+-ATPase and/or vesicular Cl− channels could account for an increased influx of H+ into vesicles. In thyroid parafollicular cells, the plasmalemmal Ca2+ receptor is linked to the acidification of secretory vesicles and to exocytosis by different G-protein-coupled pathways (Tamir et al. 1996). In these cells, the activity of vH+-ATPase appears to be constitutive and stimulation enhances the acidification of vesicles by increasing permeation through a chloride channel in the vesicular membrane, which prevents the development of a ΔΨ, which would otherwise limit the influx of H+ (Barasch et al. 1988; Cidon et al. 1991; Tamir et al. 1994, 1996). Synaptic vesicles of transgenic mice that lack a chloride channel, ClC-3, have been reported to be deficient in synaptic vesicle acidification (Stobrawa et al. 2001). Cl− permeability has also been found to regulate ΔpH of other components of the cisternal space of cells, including lysosomes, endosomes, the Golgi apparatus and beta cell insulin granules (Rybak et al. 1997; Forgac, 2000; Grabe et al. 2000; Barg et al. 2001). The effects of NPPB observed in the current study are consistent with the idea that the influx of H+ into chromaffin vesicles is similarly dependent on the ability of Cl− to serve as a counterion. Whether stimulation increases the acidity in chromaffin vesicles by gating a chloride channel remains to be determined. The requirement for extracellular Ca2+ in the regulation of stimulation-dependent vesicle acidification is consistent with a role for Ca2+ in a second messenger cascade (Bae & Verkman, 1990; Tamir et al. 1996). The requirement for extracellular Ca2+ is unlikely to be due to Ca2+-induced exocytosis, however, because the stimulation-induced acidification of secretory vesicles (of chromaffin and Neuro2A cells) was found, in the current study, to be independent of exocytosis.
It has been reported recently that the vesicles of PC12 and mast cells can alkalinize just prior to exocytosis (Han et al. 1999; Williams & Webb, 2000). While the mechanism of this phenomenon is unknown, it can occur within seconds of secretion and is related to the deprotonation of intravesicular proteins or peptides, which facilitates their decondensation and release to the extracellular milieu. The alkalinization of these vesicles is different from the stimulation-induced acidification of chromaffin vesicles, which results from prolonged stimulation over many minutes. Conceivably, chromaffin vesicles might also become more alkaline in the seconds prior to their fusion with the plasma membrane. This possibility was not investigated.
Possible mechanisms of stimulation-induced changes of vesicle volume
The small acetylcholine-containing synaptic vesicles of motor nerve terminals at neuromuscular junctions do not expand in volume when extravesicular osmolarity is decreased (Van der Kloot & Spielholz, 1987). This lack of a response has been attributed to a corresponding change in the surface tension of the vesicular membrane (Johnson & Buttress, 1973). In contrast to these synaptic vesicles, however, the large secretory vesicles of mast cells can increase in diameter by as much as 73 % when they are exposed to hyposmolar media (Brodwick et al. 1992). The mast cell vesicle membrane was observed to expand more than the matrix, so that a halo formed around them, which resembles those we observed in the active vesicles of chromaffin cells. The stimulation-induced increase in the volume of chromaffin vesicles may also be partially due to vesicle-vesicle fusion with subsequent ‘compound exocytosis’, as has been demonstrated in stimulated mast cells (Scepek & Lindau, 1993; Williams & Webb, 2000). Intragranular membrane has also been suggested to be donated to the membranes of vesicles (Ornberg et al. 1986; Engel et al. 1991).
Possible functions of stimulation-dependent acidification of secretory vesicles
The stimulation-induced regulation of intravesicular pH may be involved in a number of functions. A ΔpH gradient across the vesicular membrane is required for uptake of cytosolic transmitter. Besides the uptake of small molecules for secretion, these may include the regulation of the activity of enzymes with acidic pH optima (Orci et al. 1986), the enhancement of the vesicular accumulation of Ca2+ (Goncalves et al. 1999), and enabling secretory products to decondense and/or dissociate from elements of the vesicle matrix to which they may be bound (Jankowski et al. 1994; Aspinwall et al. 1997; Han et al. 1999).
A recent amperometric study carried out with chromaffin cells has independently confirmed our finding that stimulation increases the quantal size of events resulting from the exocytosis of a subpopulation of vesicles (Elhamdani et al. 2001). In that study, the authors speculate that the increase in quantal size may be due to the formation of a more stable fusion pore, or to a full fusion of the vesicle with the plasma membrane, allowing more intravesicular transmitter to be released. This interpretation may be consistent with stimulation-induced vesicle acidification. Recent studies on the fusion of secretory organelles in yeast suggests that counterion-regulated vesicle acidification enhances exocytosis through an effect on SNARE proteins (Maechler & Wollheim, 1999; Rorsman & Renstrom, 1999; Ungermann et al. 1999). Alternatively, acidification of the vesicle lumen may be required for formation of the exocytotic fusion pore independently from an interaction with the SNARE. In pancreatic beta cells, the acidification of secretory vesicles appears to be required for refilling a pool of readily releasable vesicles (Barg et al. 2001). In yeast, vacuolar fusion may be mediated by the integral membrane Vo subunit of the vH+-ATPase itself and may also be facilitated by a H+ gradient (Peters et al. 2001). In the present study, fusion promoted by increased intravesicular acidification could occur either at the plasma membrane, potentiating exocytosis, or between vesicles, increasing vesicle volume.
Acknowledgments
The authors wish to thank Dr T. Binz for the botulinum toxin E/LC cDNA and Drs Qais Al-Awqati, Jonathan Barasch, Robert Edwards, Edward Levitan and Yvonne Schmitz for discussion and critique of the manuscript. Emmanuel N. Pothos is a Walter Sonneborn Katz Investigator funded by a 1999 National Alliance for Research on Schizophrenia and Depression (NARSAD) Young Investigator Award, a recipient of a NIDA B/START award and an Aaron Diamond Foundation Young Faculty Awardee. David Sulzer is a NARSAD Independent Investigator. This study was supported by grants from the Aaron Diamond Foundation DK52139; NS 12969; NIH #5 P30, R29MH53576; MH57068, NARSAD, NIDA 07418 and 10154, the Parkinson's Disease Foundation, and Mr and Mrs John Z. Katz.
Supplementary material
The online version of this paper contains supplementary data indicating the untransformed distributions of quantal sizes resulting from each treatment in Figs 9 and 10: http://www.jphysiol.org/cgi/content/full/542/2/453
REFERENCES
- Aguado F, Gombau L, Majo G, Marsal J, Blanco J, Blasi J. Regulated secretion is impaired in AtT-20 endocrine cells stably transfected with botulinum neurotoxin type A light chain. Journal of Biological Chemistry. 1997;272:26005–26008. doi: 10.1074/jbc.272.41.26005. [DOI] [PubMed] [Google Scholar]
- Anderson RGW, Falck JR, Goldstein JL, Brown MS. Visualization of acidic organelles in intact cells by electron microscopy. Proceeding of the National Academy of Sciences of the USA. 1984;81:4838–4842. doi: 10.1073/pnas.81.15.4838. [DOI] [PMC free article] [PubMed] [Google Scholar]
- Anderson RGW, Pathak RK. Vesicles and cisternae in the trans Golgi apparatus of human fibroblasts are acidic compartments. Cell. 1985;40:635–643. doi: 10.1016/0092-8674(85)90212-0. [DOI] [PubMed] [Google Scholar]
- Aspinwall CA, Brooks SA, Kennedy RT, Lakey JR. Effects of intravesicular H+ and extracellular H+ and Zn2+ on insulin secretion in pancreatic beta cells. Journal of Biological Chemistry. 1997;272:31308–31314. doi: 10.1074/jbc.272.50.31308. [DOI] [PubMed] [Google Scholar]
- Bae H-R, Verkman AS. Protein kinase A regulates chloride conductance in endocytic vesicles from proximal tubule. Nature. 1990;348:637–639. doi: 10.1038/348637a0. [DOI] [PubMed] [Google Scholar]
- Banerjee A, Kowalchyk JA, Dasgupta BR, Martin TFJ. SNAP-25 is required for a late postdocking step in Ca2+-dependent exocytosis. Journal of Biological Chemistry. 1996;271:20227–20230. doi: 10.1074/jbc.271.34.20227. [DOI] [PubMed] [Google Scholar]
- Barasch J, Gershon MD, Nunez EA, Tamir H, Al-Awqati Q. Thyrotropin induced the acidification of secretory granules of parafollicular cells by increasing the chloride conductance of the granular membrane. Journal of Cell Biology. 1988;107:2137–2147. doi: 10.1083/jcb.107.6.2137. [DOI] [PMC free article] [PubMed] [Google Scholar]
- Barg S, Huang P, Eliasson L, Nelson DJ, Obermuller S, Rorsman P, Thevenod F, Renstrom E. Priming of insulin granules for exocytosis by granular Cl(−) uptake and acidification. Journal of Cell Science. 2001;114:2145–2154. doi: 10.1242/jcs.114.11.2145. [DOI] [PubMed] [Google Scholar]
- Brodwick MS, Curran M, Edwards C. Effects of osmotic stress on mast cell vesicles of the beige mouse. Journal of Membrane Biology. 1992;126:159–169. doi: 10.1007/BF00231914. [DOI] [PubMed] [Google Scholar]
- Brown EM, MacLeod RJ. Extracellular calcium sensing and extracellular calcium signaling. Physiological Review. 2001;81:239–297. doi: 10.1152/physrev.2001.81.1.239. [DOI] [PubMed] [Google Scholar]
- Cheng I, Qureshi I, Chattopadhyay N, Qureshi A, Butters R, Hall A, Cima R, Rogers K, Herbert S, Geibel J, Brown E, Soybel D. Expression of an extracellular calcium-sensing receptor in rat stomach. Gastroenterology. 1999;116:118–126. doi: 10.1016/s0016-5085(99)70235-0. [DOI] [PubMed] [Google Scholar]
- Chevrier D, Fournier H, Nault C, Zollinger M, Crine P, Boileau G. Expression of porcine pro-opiomelanocortin in mouse neuroblastoma (Neuro2A) cells: targeting of the foreign neuropeptide to dense-core vesicles. Molecular and Cellular Endocrinology. 1991;79:109–118. doi: 10.1016/0303-7207(91)90101-w. [DOI] [PubMed] [Google Scholar]
- Cidon S, Nelson N. A novel ATPase in the chromaffin granule membrane. Journal of Biological Chemistry. 1983;258:2892–2898. [PubMed] [Google Scholar]
- Cidon S, Tamir H, Nunez EA, Gershon MD. ATP dependent uptake of 5-hydroxytryptamine by secretory granules isolated from thyroid parafollicular cells. Journal of Biological Chemistry. 1991;266:4392–4400. [PubMed] [Google Scholar]
- Colliver T, Hess E, Pothos EN, Sulzer D, Ewing AG. Quantitative and statistical analysis of the shape of amperometric spikes recorded from two populations of cells. Journal of Neurochemistry. 1999;74:1086–1097. doi: 10.1046/j.1471-4159.2000.741086.x. [DOI] [PubMed] [Google Scholar]
- Colliver TL, Pyott SJ, Achalabun M, Ewing AG. VMAT-mediated changes in quantal size and vesicular volume. Journal of Neuroscience. 2000;20:5276–5282. doi: 10.1523/JNEUROSCI.20-14-05276.2000. [DOI] [PMC free article] [PubMed] [Google Scholar]
- Elhamdani A, Palfrey HC, Artalejo CR. Quantal size is dependent on stimulation frequency and calcium entry in calf chromaffin cells. Neuron. 2001;31:819–830. doi: 10.1016/s0896-6273(01)00418-4. [DOI] [PubMed] [Google Scholar]
- Engel J, Pastushenko VF, Richter W, Donath E. On the interaction between chromaffin granule membranes and intragranular vesicles — theory and analysis of freeze-fracture micrographs. Biorheology. 1991;28:75–87. doi: 10.3233/bir-1991-281-208. [DOI] [PubMed] [Google Scholar]
- Farquhar MG. Recovery of surface membrane in anterior pituitary cells. Variations in traffic detected with anionic and cationic ferritin. Journal of Cell Biology. 1978;77:R35–42. doi: 10.1083/jcb.77.3.r35. [DOI] [PMC free article] [PubMed] [Google Scholar]
- Finbow ME, Harrison MA. The vacuolar H+-ATPase: a universal proton pump of eukaryotes. Biochemical Journal. 1997;324:697–712. doi: 10.1042/bj3240697. [DOI] [PMC free article] [PubMed] [Google Scholar]
- Forgac M. Structure, mechanism and regulation of the clathrin-coated vesicle and yeast vacuolar H(+)-ATPases. Journal of Experimental Biology. 2000;203:71–80. doi: 10.1242/jeb.203.1.71. [DOI] [PubMed] [Google Scholar]
- Fujita T. Paraneurons. In: Adelman G, editor. Encyclopedia of Neuroscience. II. Boston: Birkhaüser; 1987. pp. 921–923. [Google Scholar]
- Gershon MD, Sherman D. Selective demonstration of serotonergic neurons and terminals in electron micrographs: loading with 5,7-dihydroxytryptamine and fixation with NaMnO4. Journal of Histochemistry and Cytochemistry. 1982;30:769–773. doi: 10.1177/30.8.7119420. [DOI] [PubMed] [Google Scholar]
- Goncalves PP, Meireles SM, Neves P, Vale MG. Synaptic vesicle Ca2+/H+ antiport: dependence on the proton electrochemical gradient. Molecular Brain Research. 1999;71:178–184. doi: 10.1016/s0169-328x(99)00183-7. [DOI] [PubMed] [Google Scholar]
- Grabe M, Wang H, Oster G. The mechanochemistry of V-ATPase proton pumps. Biophysical Journal. 2000;78:2798–2813. doi: 10.1016/S0006-3495(00)76823-8. [DOI] [PMC free article] [PubMed] [Google Scholar]
- Han W, Li D, Stout AK, Takimoto K, Levitan ES. Ca2+-induced deprotonation of peptide hormones inside secretory vesicles in preparation for release. Journal of Neuroscience. 1999;19:900–905. doi: 10.1523/JNEUROSCI.19-03-00900.1999. [DOI] [PMC free article] [PubMed] [Google Scholar]
- Hannah MJ, Schmidt AA, Huttner WB. Synaptic vesicle biogenesis. Annual Review of Cell and Developmental Biology. 1999;15:733–798. doi: 10.1146/annurev.cellbio.15.1.733. [DOI] [PubMed] [Google Scholar]
- Jankowski JA, Finnegan JM, Wightman RM. Extracellular ionic composition alters kinetics of vesicular release of catecholamines and quantal size during exocytosis at adrenal medullary cells. Journal of Neurochemistry. 1994;63:1739–1747. doi: 10.1046/j.1471-4159.1994.63051739.x. [DOI] [PubMed] [Google Scholar]
- Johnson RG. Accumulation of biological amines into chromaffin granules: a model for hormone and neurotransmitter transport. Physiological Review. 1988;68:232–307. doi: 10.1152/physrev.1988.68.1.232. [DOI] [PubMed] [Google Scholar]
- Johnson SM, Buttress N. The osmotic insensitivity of sonicated liposomes and the density of phospholipid-cholesterol mixtures. Biochimica et Biophysica Acta. 1973;307:20–26. doi: 10.1016/0005-2736(73)90021-7. [DOI] [PubMed] [Google Scholar]
- Kozminski KD, Gutman DA, Davila V, Sulzer D, Ewing AG. Voltammetric and pharmacological characterization of dopamine released from single quantal events in PC12 cells. Analytical Chemistry. 1998;70:3123–3130. doi: 10.1021/ac980129f. [DOI] [PubMed] [Google Scholar]
- McGehee DS, Adlersberg M, Liu KP, Hsuing S, Heath MJ, Tamir H. Mechanism of extracellular Ca2+ receptor-stimulated hormone release from sheep thyroid parafollicular cells. Journal of Physiology. 1997;502:31–44. doi: 10.1111/j.1469-7793.1997.031bl.x. [DOI] [PMC free article] [PubMed] [Google Scholar]
- Maechler P, Wollheim CB. Mitochondrial glutamate acts as a messenger in glucose-induced insulin exocytosis. Nature. 1999;402:685–689. doi: 10.1038/45280. [DOI] [PubMed] [Google Scholar]
- Martin TF. The molecular machinery for fast and slow neurosecretion. Current Opinion in Neurobiology. 1994;4:626–632. doi: 10.1016/0959-4388(94)90002-7. [DOI] [PubMed] [Google Scholar]
- Mawe GM, Gershon MD. Functional heterogeneity in the myenteric plexus: demonstration using cytochrome oxidase as a verified cytochemical probe of the activity of individual enteric neurons. Journal of Comparative Neurology. 1986;249:381–391. doi: 10.1002/cne.902490305. [DOI] [PubMed] [Google Scholar]
- Michael DJ, Wightman RM. Electrochemical monitoring of biogenic amine neurotransmission in real time. Journal of Pharmaceutical and Biomedical Analysis. 1999;19:33–46. doi: 10.1016/s0731-7085(98)00145-9. [DOI] [PubMed] [Google Scholar]
- Mundorf ML, Hochstetler SE, Wightman RM. Amine weak bases disrupt vesicular storage and promote exocytosis in chromaffin cells. Journal of Neurochemistry. 1999;73:2397–2405. doi: 10.1046/j.1471-4159.1999.0732397.x. [DOI] [PubMed] [Google Scholar]
- Nagayama T, Matsumoto T, Kuwakubo F, Fukushima Y, Yoshida M, Suzuki-Kusaba M, Hisa H, Kimura T, Satoh S. Role of calcium channels in catecholamine secretion in the rat adrenal gland. Journal of Physiology. 1999;520:503–512. doi: 10.1111/j.1469-7793.1999.00503.x. [DOI] [PMC free article] [PubMed] [Google Scholar]
- Nelson N, Perzov N, Cohen A, Hagai K, Padler V, Nelson H. The cellular biology of proton-motive force generation by V-ATPases. Journal of Experimental Biology. 2000;203:89–95. doi: 10.1242/jeb.203.1.89. [DOI] [PubMed] [Google Scholar]
- Njus D, Kelley PM, Harnadek GJ. Bioenergetics of secretory vesicles. Biochimica et Biophysica Acta. 1986;853:237–265. doi: 10.1016/0304-4173(87)90003-6. [DOI] [PubMed] [Google Scholar]
- Orci L, Halban P, Perrelet A, Amherdt M, Ravazzola M, Anderson RG. pH independent and dependent cleavage of proinsulin in the same secretory vesicle. Journal of Cell Biology. 1994;126:1149–1156. doi: 10.1083/jcb.126.5.1149. [DOI] [PMC free article] [PubMed] [Google Scholar]
- Orci L, Ravazzola M, Amherdt M, Madsen O, Perrelet A, Vassalli JD, Anderson RG. Conversion of proinsulin to insulin occurs coordinately with acidification of maturing secretory vesicles. Journal of Cell Biology. 1986;103:2273–2281. doi: 10.1083/jcb.103.6.2273. [DOI] [PMC free article] [PubMed] [Google Scholar]
- Ornberg RL, Duong LT, Pollard HB. Intragranular vesicles: new organelles in the secretory granules of adrenal chromaffin cells. Cell and Tissue Research. 1986;245:547–553. doi: 10.1007/BF00218556. [DOI] [PubMed] [Google Scholar]
- Ornberg RL, Furuya S, Goping G, Kuijpers GA. Granule swelling in stimulated bovine adrenal chromaffin cells: regulation by internal granule pH. Cell and Tissue Research. 1995;279:85–92. doi: 10.1007/BF00300694. [DOI] [PubMed] [Google Scholar]
- Pazoles C, Creutz C, Ramu A, Pollard H. Permeant anion activation of MgATPase activity in chromaffin granules. Journal of Biological Chemistry. 1980;255:7863–7869. [PubMed] [Google Scholar]
- Penner R, Neher E, Dreyer F. Intracellularly injected tetanus toxin inhibits exocytosis in bovine adrenal chromaffin cells. Nature. 1986;324:76–78. doi: 10.1038/324076a0. [DOI] [PubMed] [Google Scholar]
- Peters C, Bayer MJ, Buhler S, Andersen JS, Mann M, Mayer A. Trans-complex formation by proteolipid channels in the terminal phase of membrane fusion. Nature. 2001;409:581–588. doi: 10.1038/35054500. [DOI] [PubMed] [Google Scholar]
- Pollard HB, Shindo H, Creutz CE, Pazoles CJ, Cohen JS. Internal pH and state of ATP in adrenergic chromaffin granules determined by 31P nuclear magnetic resonance spectroscopy. Journal of Biological Chemistry. 1979;254:1170–1177. [PubMed] [Google Scholar]
- Pollock NS, Kargacin ME, Kargacin GJ. Chloride channel blockers inhibit Ca2+ uptake by the smooth muscle sarcoplasmic reticulum. Biophysical Journal. 1998;75:1759–1766. doi: 10.1016/S0006-3495(98)77617-9. [DOI] [PMC free article] [PubMed] [Google Scholar]
- Pothos E, Davila V, Sulzer D. Presynaptic recording of quanta from midbrain dopamine neurons and modulation of the quantal size. Journal of Neuroscience. 1998;18:4106–4118. doi: 10.1523/JNEUROSCI.18-11-04106.1998. [DOI] [PMC free article] [PubMed] [Google Scholar]
- Pothos E, Desmond M, Sulzer D. l-3,4-Dihydroxy-phenylalanine increases the quantal size of exocytic dopamine release in vitro. Journal of Neurochemistry. 1996;66:629–636. doi: 10.1046/j.1471-4159.1996.66020629.x. [DOI] [PubMed] [Google Scholar]
- Reimer RJ, Fon EA, Edwards RH. Vesicular neurotransmitter transport and the presynaptic regulation of quantal size. Current Opinion in Neurobiology. 1998;8:405–412. doi: 10.1016/s0959-4388(98)80068-8. [DOI] [PubMed] [Google Scholar]
- Rorsman P, Renstrom E. Glutamate primes the pump. Nature. 1999;402:595–596. doi: 10.1038/45110. [DOI] [PubMed] [Google Scholar]
- Rybak S, Lanni F, Murphy RF. Theoretical considerations on the role of membrane potential in the regulation of endosomal pH. Biophysical Journal. 1997;73:674–687. doi: 10.1016/S0006-3495(97)78102-5. [DOI] [PMC free article] [PubMed] [Google Scholar]
- Sabban EL, Schwartz J, McMahon A. Effect of compounds which disrupt proton gradients on secretion of neurosecretory proteins from PC12 pheochromocytoma cells. Neuroscience. 1990;38:561–570. doi: 10.1016/0306-4522(90)90050-e. [DOI] [PubMed] [Google Scholar]
- Scepek S, Lindau M. Focal exocytosis by eosinophils — compound exocytosis and cumulative fusion. EMBO Journal. 1993;12:1811–1817. doi: 10.1002/j.1460-2075.1993.tb05829.x. [DOI] [PMC free article] [PubMed] [Google Scholar]
- Schneider D. ATP-acidification of intact and disrupted lysosomes. Journal of Biological Chemistry. 1981;256:3858–3864. [PubMed] [Google Scholar]
- Sonawane ND, Thiagarajah JR, Verkman AS. Chloride concentration in endosomes measured using a ratioable fluorescent Cl− indicator: Evidence for Cl− accumulation during acidification. Journal of Biological Chemistry. 2001;7:7. doi: 10.1074/jbc.M110818200. [DOI] [PubMed] [Google Scholar]
- Stobrawa SM, Breiderhoff T, Takamori S, Engel D, Schweizer M, Zdebik AA, Bosl MR, Ruether K, Jahn H, Draguhn A, Jahn R, Jentsch TJ. Disruption of ClC-3, a chloride channel expressed on synaptic vesicles, leads to a loss of the hippocampus. Neuron. 2001;29:185–196. doi: 10.1016/s0896-6273(01)00189-1. [DOI] [PubMed] [Google Scholar]
- Sulzer D, Chen T, Lau Y, Kristensen H, Rayport S, Ewing A. Amphetamine redistributes dopamine from synaptic vesicles to the cytosol and promotes reverse transport. Journal of Neuroscience. 1995;15:4102–4108. doi: 10.1523/JNEUROSCI.15-05-04102.1995. [DOI] [PMC free article] [PubMed] [Google Scholar]
- Sulzer D, Holtzman E. Acidification and endosome-like compartments in the presynaptic terminals of frog retinal photoreceptors. Journal of Neurocytology. 1989;18:529–540. doi: 10.1007/BF01474548. [DOI] [PMC free article] [PubMed] [Google Scholar]
- Sulzer D, Pothos EN. Presynaptic mechanisms that regulate quantal size. Reviews in the Neurosciences. 2000;11:159–212. doi: 10.1515/revneuro.2000.11.2-3.159. [DOI] [PubMed] [Google Scholar]
- Sulzer D, Rayport S. Amphetamine and other psychostimulants reduce pH gradients in midbrain dopaminergic neurons and chromaffin granules: a mechanism of action. Neuron. 1990;5:797–808. doi: 10.1016/0896-6273(90)90339-h. [DOI] [PubMed] [Google Scholar]
- Takamori S, Riedel D, Jahn R. Immunoisolation of GABA-specific synaptic vesicles defines a functionally distinct subset of synaptic vesicles. Journal of Neuroscience. 2000;20:4904–4911. doi: 10.1523/JNEUROSCI.20-13-04904.2000. [DOI] [PMC free article] [PubMed] [Google Scholar]
- Tamir H, Liu KP, Adlersberg M, Hsuing S, Gershon MD. Acidification of serotonin-containing secretory vesicles induced by a plasma membrane calcium receptor. Journal of Biological Chemistry. 1996;271:6441–6450. doi: 10.1074/jbc.271.11.6441. [DOI] [PubMed] [Google Scholar]
- Tamir H, Piscopo I, Liu K-P, Hsiung S, Adlersberg M, Nicolaides M, Al-Awqati Q, Gershon MD. Secretogogue-induced gating of chloride channels in the secretory vesicles of a paraneuron. Endocrinology. 1994;135:2045–2057. doi: 10.1210/endo.135.5.7525261. [DOI] [PubMed] [Google Scholar]
- Ungermann C, Wickner W, Xu Z. Vacuole acidification is required for trans-SNARE pairing, LMA1 release, and homotypic fusion. Proceedings of the National Academy of Sciences of the USA. 1999;96:11194–11199. doi: 10.1073/pnas.96.20.11194. [DOI] [PMC free article] [PubMed] [Google Scholar]
- Van der Kloot W. Inhibition of packing of acetylcholine into quanta by ammonium. FASEB Journal. 1987;1:298–302. doi: 10.1096/fasebj.1.4.3498657. [DOI] [PubMed] [Google Scholar]
- Van der Kloot W, Spielholz N. Effects of changes in tonicity of the extracellular solution on the size of vesicles in frog motor nerve terminals. Journal of Neurocytology. 1987;16:77–84. doi: 10.1007/BF02456699. [DOI] [PubMed] [Google Scholar]
- Van Dyke RW. Acidification of lysosomes and endosomes. Sub-cellular Biochemistry. 1996;27:331–360. doi: 10.1007/978-1-4615-5833-0_10. [DOI] [PubMed] [Google Scholar]
- Wade PR, Tamir H, Kirchgessner AL, Gershon MD. Analysis of the role of 5-HT in the enteric nervous system using anti-idiotopic antibodies to 5-HT receptors. American Journal of Physiology. 1994;266:G403–416. doi: 10.1152/ajpgi.1994.266.3.G403. [DOI] [PubMed] [Google Scholar]
- Williams RM, Webb WW. Single granule pH cycling in antigen induced mast cell secretion. Journal of Cell Science. 2000;21:3839–3850. doi: 10.1242/jcs.113.21.3839. [DOI] [PubMed] [Google Scholar]
- Winkler H. The adrenal chromaffin granule: a model for large dense core vesicles of endocrine and nervous tissue. Journal of Anatomy. 1993;183:237–252. [PMC free article] [PubMed] [Google Scholar]
- Zhou Q, Petersen CC, Nicoll RA. Effects of reduced vesicular filling on synaptic transmission in rat hippocampal neurones. Journal of Physiology. 2000;525:195–206. doi: 10.1111/j.1469-7793.2000.t01-1-00195.x. [DOI] [PMC free article] [PubMed] [Google Scholar]
Associated Data
This section collects any data citations, data availability statements, or supplementary materials included in this article.
Supplementary Materials
The online version of this paper contains supplementary data indicating the untransformed distributions of quantal sizes resulting from each treatment in Figs 9 and 10: http://www.jphysiol.org/cgi/content/full/542/2/453