

Abstract
Thalamic stimulation at frequencies between 5 and 15 Hz elicits incremental or ‘augmenting’ cortical responses. Augmenting responses can also be evoked in cortical slices and isolated cortical slabs in vivo. Here we show that a realistic network model of cortical pyramidal cells and interneurones including short-term plasticity of inhibitory and excitatory synapses replicates the main features of augmenting responses as obtained in isolated slabs in vivo. Repetitive stimulation of synaptic inputs at frequencies around 10 Hz produced postsynaptic potentials that grew in size and carried an increasing number of action potentials resulting from the depression of inhibitory synaptic currents. Frequency selectivity was obtained through the relatively weak depression of inhibitory synapses at low frequencies, and strong depression of excitatory synapses together with activation of a calcium-activated potassium current at high frequencies. This network resonance is a consequence of short-term synaptic plasticity in a network of neurones without intrinsic resonances. These results suggest that short-term plasticity of cortical synapses could shape the dynamics of synchronized oscillations in the brain.
Thalamic stimulation at frequencies between 5 and 15 Hz results in cortical field potentials that grow in size, accompanied by an increase in depolarization and spike responses in individual cells. These incremental or ‘augmenting’ responses (Morison & Dempsey, 1943) have been observed in motor (Purpura et al. 1964; Castro-Alamancos & Connors, 1996a,b; Steriade et al. 1998), somatosensory (Morin & Steriade, 1981; Kandel & Buzsáki, 1997) and association cortical areas (Nuñez et al. 1993), as well as in visual (Ferster & Lindström, 1985) and auditory (Metherate & Ashe, 1994) cortices. Cortical augmenting responses can also be evoked by stimulation of white (Morin & Steriade, 1981; Castro-Alamancos & Connors, 1996b) and grey matter (Castro-Alamancos & Connors, 1996b; Steriade et al. 1998) and contralateral cortical areas (Nuñez et al. 1993). In many systems, driven resonance is closely related to endogenous rhythmogenesis. Thalamocortical oscillations at the preferred frequencies of augmenting responses occur as spindles during sleep (Steriade et al. 1993; Destexhe & Sejnowski, 2001), as well as in awake, behaving states (Nicolelis et al. 1995; Fanselow et al. 2001), though the specific mechanisms involved are probably different during sleep and waking. Furthermore, augmenting responses may develop into self-sustained oscillatory activity and seizure-like cortical discharges resembling pathological conditions (Steriade & Timofeev, 2001). Interestingly, augmenting responses are modulated by behavioural state (Steriade et al. 1969; Castro-Alamancos & Connors, 1996a), which suggests a possible role in sensory processing.
Recent evidence suggests that there are at least two separate components contributing to augmenting responses: one intrinsic to the thalamus and one intrinsic to the cortex. The underlying mechanisms of the intrathalamic component have recently been investigated in decorticated animals (Steriade & Timofeev, 1997; Timofeev & Steriade, 1998) and with computer models (Bazhenov et al. 1998a). Thalamically generated augmenting responses probably contribute to cortical incremental responses (Bazhenov et al. 1998b; Steriade et al. 1998). The occurrence of augmenting responses in cortical slices (Castro-Alamancos & Connors, 1996b), deafferented cortical slabs (Timofeev et al. 2002) and athalamic animals (Morin & Steriade, 1981) suggests an additional, purely cortical, component. The underlying mechanism of this cortical resonance is unknown. Previous hypotheses involve facilitation of a late (Purpura et al. 1964) or NMDA receptor-mediated excitatory postsynaptic potential (EPSP) (Metherate & Ashe, 1994) via depression of inhibitory postsynaptic potentials (IPSPs), facilitation of layer 6 to layer 4 collaterals (Ferster & Lindström, 1985) or intrinsic properties of layer 5 cells (Castro-Alamancos & Connors, 1996b). This raises the possibility that network resonance arises from the intrinsic frequency preferences of individual cells. Some cortical cells display a subthreshold resonance (Gutfreund et al. 1995; Hutcheon et al. 1996; Pike et al. 2000; Fellous et al. 2001) accompanied by a firing preference near the resonant frequency. Subthreshold resonances are typically caused by slow potassium currents (Gutfreund et al. 1995), low-threshold calcium (T-) currents (Puil et al. 1994), hyperpolarization-activated cation (H-) currents (Hutcheon et al. 1996; Pike et al. 2000), or combinations thereof (for review see Hutcheon & Yarom, 2000).
Here we ask if augmenting responses could be caused by the rapid short-term synaptic plasticity of cortical synapses. Short-term synaptic plasticity is a ubiquitous property of cortical circuitry. Both the synaptic impact (Abbott et al. 1997; Tsodyks & Markram, 1997) and the balance of synaptic excitation and inhibition (Galarreta & Hestrin, 1998; Varela et al. 1999) depend on spike frequency. Connections between excitatory cells display short-term depression (Abbott et al. 1997; Thomson, 1997; Tsodyks & Markram, 1997; Galarreta & Hestrin, 1998; Finnerty et al. 1999; Varela et al. 1999; Hempel et al. 2000) or facilitation (Stratford et al. 1996; Reyes & Sakmann, 1999) that is frequency dependent. Connections from excitatory cells onto inhibitory cells facilitate (Thomson et al. 1993; Markram et al. 1998; Reyes et al. 1998; Gibson et al. 1999) or depress (Buhl et al. 1997; Galarreta & Hestrin, 1998; Reyes et al. 1998; Tarczy-Hornoch et al. 1998; Gibson et al. 1999; Rozov et al. 2001). Connections from inhibitory cells onto excitatory cells depress (Deisz & Prince, 1989; Castro-Alamancos & Connors, 1996b; Galarreta & Hestrin, 1998; Reyes et al. 1998; Tarczy-Hornoch et al. 1998; Varela et al. 1999; Gupta et al. 2000). Connections between inhibitory cells depress (Galarreta & Hestrin, 1999; Gibson et al. 1999; Gupta et al. 2000; Tamás et al. 2000) or facilitate (Gupta et al. 2000). Extrinsic afferents from the thalamus depress (Stratford et al. 1996; Gil et al. 1997; Sanchez-Vives et al. 1998; Gibson et al. 1999; Gil et al. 1999). The simultaneous short-term dynamics of excitatory and inhibitory synapses may cause cortical networks to resonate for inputs at preferred frequencies. We systematically investigated this hypothesis in a cortical network model endowed with short-term synaptic plasticity.
This paper is organized as follows. First, we provide in vivo data that characterize augmenting responses in isolated cortical slabs. We then show that very similar incremental responses occur in a computational model of the cortex that includes individually non-resonant neurones and short-term depression of inhibitory and excitatory synapses. Next, we determine how the parameters of the model influence these incremental responses. Finally, we investigate the contribution of synaptic and intrinsic conductances in the simplest model that displays incremental responses, a connected interneurone and pyramidal cell.
METHODS
Animal preparation and recording procedure
Experiments were carried out on adult cats (2.5-3.5 kg) anaesthetized with ketamine and xylazine (10-15 and 2–3 mg kg−1i.m., respectively). The electroencephalogram (EEG) was monitored continuously during the experiments to maintain a suffcient level of anaesthesia. Additional doses of anaesthetic were given at the slightest tendency toward an activated EEG pattern. In addition, all pressure points and tissues to be incised were infiltrated with lidocaine (lignocaine). The cats were injected with the neuromuscular blocking agent gallamine triethiodide (20 mg kg−1i.v.) and artificially ventilated to an end-tidal CO2 of 3.5-3.8 %. The heartbeat was monitored and kept constant (acceptable range, 90–110 beats min−1). Body temperature was maintained at 37–39 °C. Glucose saline (5 % glucose, 10 ml i.p.) was given every 3–4 h during the experiments, which lasted for 8–14 h. The stability of intracellular recordings was ensured by cisternal drainage, bilateral pneumothorax, hip suspension and by filling the hole made in the skull with a solution of agar-agar (4 %). All experimental procedures were performed according to national guidelines and were approved by the committee for animal care of Laval University.
To study intracortical augmenting responses, slabs were prepared from suprasylvian association areas 5 and 7. Details of the preparation and morphological and physiological properties of the slab are published elsewhere (Timofeev et al. 2000). After opening the fourth ventricle, the dura mater over the suprasylvian gyrus was removed and a 6–7 mm by 9–10 mm region of the gyrus was undercut and isolated from neighbouring cortical territories. The stimulating and recording bipolar coaxial electrodes were placed in the slab, the outer pole at the cortical surface and the inner pole at a cortical depth of 0.8-1 mm. Control electrodes were positioned outside the slab, either in the adjacent part of the suprasylvian gyrus or in area 4 of the motor cortex. Single or dual simultaneous intracellular recordings were performed with conventional sharp electrodes of 30–80 MΩ resistance, filled with a 2.5 m solution of potassium acetate. Single or multiple (10 and 40 Hz, 5–20 shocks) electrical stimuli to the slab were delivered every 5–10 s. In the intact brain, thalamic stimulation was applied through coaxial electrodes into the ventral lateral (VL) nucleus. At the end of experiments the animals were given a lethal dose of sodium pentobarbitone.
Model
The responses of neocortical pyramidal cells (PY) and interneurones (IN) were simulated using reduced two-compartment models (Mainen & Sejnowski, 1996) that included voltage-dependent currents described by Hodgkin-Huxley type of kinetics. The intrinsic currents for the ‘axo-somatic’ and ‘dendritic’ compartments were:
| (1) |
| (2) |
where Ileak is the leak current, INa and IK are fast sodium and potassium currents responsible for action potential generation, ICa is a high-voltage-activated calcium current, IM is a slow non-inactivating potassium current and IK(Ca) is a calcium-activated potassium current. Current (I) from each channel type was given by: I = g-mnh(V — E), where g- is the maximal conductance, m is an activation variable with n order kinetics, h is an optional inactivation variable, V is the membrane potential and E is the reversal potential for the ionic species. Conductance values and descriptions of the currents were identical to those in Mainen & Sejnowski (1996). A capacitance and a leak conductance were added to the axo-somatic compartment. Also, the calcium decay time constant was 100 ms and g-K(Ca) was 0.6 mS cm−2. In this two-compartment model an entire spectrum of firing patterns could be produced when the ratio of axo-somatic to dendritic membrane area (ρ), or the coupling resistance between axo-somatic and dendritic compartments (κ), was varied. For low values of ρ, cells were fast spiking (FS), for intermediate values regular spiking (RS) and for high values intrinsically bursting (IB). Cells did not display a subthreshold resonance as determined by sinusoidal current injections. In our model, PY cells were taken to be of the RS-type (Fig. 1A, top; ρ = 140, κ = 10) and IN cells of the FS-type (Fig. 1A, bottom; ρ = 50, κ = 10) with a resting potential of −70 mV. Leak conductances and reversal potentials were randomly varied (standard deviations of 10 % and 1 mV, respectively), except in simulations used to calculate response increment values. In one set of experiments a low-threshold calcium current, IT (Destexhe et al. 1996), a hyperpolarization-activated current, IH (Spain et al. 1987) or a persistent sodium current INa,P (Alzheimer et al. 1993) was added to the PY model. When INa,P or IT was added g-Ca was reduced by a factor of 3 to prevent abnormal burst discharges and g-K(Ca) was increased to maintain a similar strength potassium current to that in the original model. Responses to step current injections were not affected by these parameter changes and, in all PY models, spike trains showed adaptation. NEURON (Hines & Carnevale, 1997) was used for all simulations.
Figure 1.

Cortical network models
A, responses of a model PY cell (top) and IN cell (bottom) to a 0.1 nA current injection. B, excitatory and inhibitory PSPs resulting from activation of AMPA and GABAA receptors. C, schematic representation of the reduced model. D, schematic representation of the full network model.
AMPA and GABAA receptor-mediated currents were represented by first-order activation schemes (Destexhe et al. 1997):
| (3) |
where Ri is the fraction of open channels resulting from the ith synaptic event, T is the concentration of neurotransmitter in the synaptic cleft, and α and β are constant rate parameters. We assumed that T was a pulse of 1 ms in duration and 1 mm in amplitude. The rate constants were: α = 5.0 ms−1 mm−1 and β = 0.19 ms−1 and 0.18 ms−1 for AMPA and GABAA synapses, respectively (Destexhe et al. 1997). This model yielded realistic postsynaptic potentials (Fig. 1B).
Short-term synaptic plasticity was modelled using a phenomenological description for synaptic conductance g(t):
| (4) |
where g- is the maximal conductance increase per synaptic event, ti is the time of occurrence of the ith synaptic event, Fi is a facilitation variable defined below, and Di is a depression variable representing the amount of available ‘synaptic resources’ for release at ti (Abbott et al. 1997; Tsodyks & Markram, 1997) given by:
| (5) |
Here U is the fraction of resources used per action potential, τ the time constant of recovery of the synaptic resources, Di the value of D immediately before the ith event, and δ(t) the delta function. For a constant firing rate, f, the frequency dependence of steady-state depression D∞ (the amount of resources available for release as i → ∞) is given by:
| (6) |
The rate of convergence r to steady state is then:
| (7) |
In a few experiments U was made dynamic to investigate the effects of facilitation (Markram et al. 1998):
| (8) |
In this formulation U is increased by U0(1 — Ui) after a spike at time ti, where U0 is the initial value of U before any spikes and Ui the value immediately before the ith event, and between spikes U decays to U0 with time constant τF. Synaptic conductance for the ith event is increased by a factor Fi = Ui/U0 in eqn (4). Total synaptic current was given by:
| (9) |
where V is the membrane potential and Esyn the synaptic reversal potential. The AMPA and GABAA reversal potentials were 0 and −70 mV, respectively.
The cortical model (Fig. 1D) consisted of two chains of 121 PY and 121 IN cells. Each PY cell was connected to six neighbouring PY and seven neighbouring IN cells through AMPA synapses. Each IN cell was connected to seven neighbouring PY cells through GABAA synapses. For simplicity, connections between inhibitory cells were ignored. Architectures with more localized IN cell projections gave similar results. A set of AMPAergic extrinsic afferent synapses, presumably of thalamocortical and intercortical origin, contacted both PY and IN cells. All synapses contacted the dendritic compartments. Total maximal synaptic conductances per neurone in the model were: g_PY-IN = 60 nS, g_PY-PY = 25 nS, g_IN-PY = 100 nS and, for the extrinsic afferents, g_ext-PY = 60 nS and g_ext-IN = 20 nS. Synaptic conductances for individual synapses were obtained by dividing conductance values by the total number of contacts for each type of synapse. Parameter values were the same for all simulations except where explicitly mentioned.
Parameters of synaptic plasticity were determined as follows. For both the PY-PY and IN-PY synapses we took U = 0.3 and τ = 750 ms. These values were similar to those reported for PY-PY connections (Finnerty et al. 1999) and IN-PY connections (Gupta et al. 2000) in somatosensory cortex and reproduced the frequency dependence of steady-state depression of excitatory potentials in the prefrontal cortex (Hempel et al. 2000). An additional very fast depression component (U = 0.6, τ = 50 ms) was included for the PY-PY, but not the IN-PY, synapses, to account for the paired-pulse depression (PPD) at very short intervals in dual pyramidal cell recordings (Thomson, 1997). Some simulations were run without this fast component, as discussed in the text. These parameter choices are in agreement with observations that inhibitory potentials depress to a similar (Galarreta & Hestrin, 1998) or lesser (Varela et al. 1999) extent than excitatory potentials. For the extrinsic afferent synapses we took U = 0.3 and τ = 100 ms, based on data for thalamocortical synapses in somatosensory cortex, which displayed a PPD of 30–40 % at short intervals (Gil et al. 1997). In another study, mean second pulse amplitudes of putative thalamocortical synapses recovered with a time constant of around 100 ms (Stratford et al. 1996). Excitatory synapses onto inhibitory interneurones either facilitate or depress. For simplicity, the PY-IN synapses in our model were fixed since results were similar when either depression or facilitation was taken into account (see Fig. 8F). Slow depression components with time constants of 1–10 s (Varela et al. 1997; Galarreta & Hestrin, 1998) were not considered for any of the synapses in the model.
Figure 8.

Parameter dependence of incremental responses in the cortical network model
Frequency dependence of average response increment (RI). For each panel a different parameter was varied: maximal conductance of IN-PY synapses (A), PY-IN synapses (B), extrinsic afferent synapses onto IN cells (C), and PY-PY synapses (D); time constants of IN-PY synapses (E), PY-IN synapses (F), extrinsic afferent synapses (G), and PY-PY synapses (slow component) (H); peak conductance of IK(Ca) in PY cells (I); intensity of stimulation in the grey matter (J) and in the white matter (K); and time constants of IN-PY and PY-PY synapses (single depression component, U = 0.3) (L). Parameter values are indicated on the graphs. The thick curve corresponds to the original set of parameters and is the same in all panels.
Electrical stimulation in the grey matter was modelled as the simultaneous activation of extrinsic afferent and intrinsic PY-PY, PY-IN and IN-PY synapses. Presumably, only a fraction of all synapses is excited by electrical stimulation. Therefore, at the stimulation site in the centre of the network (PY and IN cells 61) 10 % of the maximal conductance value of each intrinsic synaptic connection and all of the extrinsic afferent synapses were activated by the electrical stimulus. The fraction of activated synapses x decayed exponentially (rate λ = 0.1 cell−1) with distance from the site of stimulation. Smaller rates λ and larger networks gave similar results. To quantify how cellular responses altered during a train of electrical shocks, the average response increment (RI) value was defined as the average increase in the number of spikes per shock in all cells with respect to the first shock for the last five shocks in a train, divided by the total number of spikes in all cells for the first shock.
RESULTS
Augmenting responses in vivo
Typical examples of augmenting responses evoked by stimulation at 10 Hz in the intact brain are illustrated in Fig. 2A. The differences between thalamically and cortically evoked augmenting responses have been discussed elsewhere (Steriade et al. 1998). To separate cortical mechanisms from thalamic mechanisms (see Introduction), augmenting responses were studied in acutely isolated neocortical slabs. This preparation leaves intact local intracortical connections within an area of 50–70 mm2 containing 5–7 × 10⁶ neurones, but disconnects the slab from all projections arising in the thalamus, other cortical areas and ascending modulatory systems. Cortical neurones recorded from the slab were relatively hyperpolarized, with a mean membrane potential around −70 mV. Most of the time, the field potential and intracellular recordings were silent. In 23 of 29 slabs, the field potentials and intracellular recordings revealed the presence of periodic, large-amplitude depolarizing events lasting 0.5-3 s and separated by 10–30 s of silence (Timofeev et al. 2000). Similar depolarizing events were elicited by low-intensity electrical stimulation in all spontaneously ‘active’ slabs and in four out of six ‘silent’ slabs. An example of such a response is presented in Fig. 2B (left panel) where a single stimulus (0.15 mA) applied to the slab evoked an EPSP followed by residual activity with lower amplitude.
Figure 2.

Augmenting responses in the intact brain and the isolated neocortical slab
A, dual intracellular recordings from cortical area 4 and thalamic VL nucleus, together with field potentials from the depth of area 4. Stimulation consisted of a pulse-train at 10 Hz. Augmenting responses were elicited by thalamic VL stimulation (left) or area 4 stimulation (right) in the intact thalamocorticothalamic network. B, intracortical augmenting responses in the slab. Left, a single stimulus (0.15 mA) to the slab elicited a depolarizing response. Middle, a 10 Hz pulse-train resulted in augmenting responses. Right, 15 stimuli at 40 Hz resulted in temporal summation at the beginning of the pulse-train and depression of PSPs close to the end of the train. C, the first and the last responses to 10 Hz stimuli (left) and 40 Hz stimuli (right) from B are superimposed and expanded in time and amplitude.
Augmenting responses were elicited by a pulse-train applied to the slab with a frequency of 10 Hz. An example of these responses is presented in Fig. 2B (middle panel), where stimulation at a frequency of 10 Hz resulted in growing EPSPs and spike firing on the fourth and fifth stimuli. An increase in the frequency of stimulation to 40 Hz led to temporal summation during the first few stimuli and spike firings. Thereafter, the amplitude of EPSPs decreased and EPSPs did not depolarize the neurone to firing threshold (Fig. 2B, right). At stimulation frequencies < 3 Hz, responses did not increment (not shown). These and accompanying data (Timofeev et al. 2002) indicate that intracortical augmenting responses occur at frequencies around 10 Hz and that at higher frequencies the responses of cortical neurones are decremental.
In the slab preparations, augmenting responses were observed in the vicinity of the stimulating electrode. At a distance of 3–6 mm from the stimulating electrode, augmenting responses were not revealed. Also, augmenting responses required high intensities of the stimulating pulse-train. These two features are illustrated in Fig. 3, where simultaneous recordings were obtained from two neurones located in the neocortical slab. One of the neurones was located in the vicinity of the stimulating electrode and another at a distance of 2 mm. Stimulation at an intensity of 0.05 mA (Fig. 3A) was at threshold for an EPSP to occur in neurone 1 and a 10 Hz pulse-train elicited decremental responses. Cell 2 did not respond to a pulse-train of such a weak intensity. An intensity of 0.07 mA (Fig. 3B) was the minimal intensity for cell 2 for which decremental responses were found. Simultaneously, cell 1 showed large amplitude EPSPs but no augmenting response. Only a high-intensity pulse-train (Fig. 3C, 0.30 mA) was effective in eliciting augmenting responses in cell 1 and large-amplitude, almost equal responses in cell 2.
Figure 3.
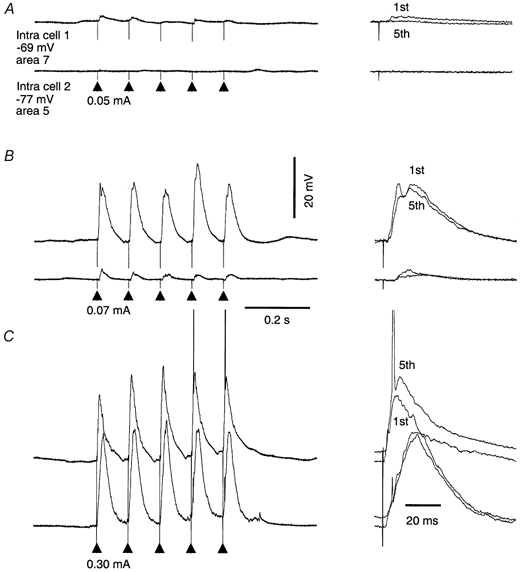
Dependence of intracortical augmenting responses on intensity of stimulation and distance from stimulating electrode
Simultaneous dual intracellular recordings from an acutely isolated neocortical slab. Cell 1 was located in the vicinity (< 0.5 mm) of the stimulating electrode. Cell 2 was recorded 2 mm anterior to the stimulating electrode. A, low-intensity stimulation (0.05 mA) elicited decremental responses in cell 1 and no response in cell 2. B, a slightly higher intensity of stimulation (0.07 mA) resulted in almost equal responses in cell 1 but decremental responses in cell 2. C, higher intensity of stimulation (0.30 mA) produced augmenting responses in cell 1 and equal responses in cell 2.
Augmenting responses featuring spike increments, from zero or one spike on the first shock to one or two spikes on the later shocks, were found in 23 % of recorded neurones (Timofeev et al. 2002). In 40 % of neurones, augmenting responses consisted of a progressively growing depolarization. Augmenting responses were not observed in 37 % of neurones recorded at some distance from the stimulation site. FS neurones also displayed augmenting responses, during which they typically fired many more action potentials than RS neurones.
Cortical network model
The responses of neocortical pyramidal cells (PY) and interneurones (IN) were simulated using reduced two-compartment models (Mainen & Sejnowski, 1996) that included voltage-dependent currents described by Hodgkin-Huxley type of kinetics (see Methods). The cortical network model consisted of two chains of PY and IN cells, synaptic connections between PY cells and between PY and IN cells, and a set of extrinsic afferents (Fig. 1D). Synaptic currents were mediated by AMPA and GABAA receptors (Fig. 1B). A phenomenological description (Abbott et al. 1997; Tsodyks & Markram, 1997) was used to model short-term synaptic plasticity, whose parameters were matched to various experimental data. The inhibitory synapses and the recurrent excitatory synapses between PY cells displayed short-term depression with a relatively slow time constant of recovery (750 ms). At high frequencies the recurrent excitatory synapses depressed more strongly than the inhibitory synapses because of an additional short-duration depression component (50 ms). A fast time constant (100 ms) governed recovery of depression at the extrinsic afferents. Electrical shocks were mimicked by the simultaneous activation of extrinsic afferents and intrinsic fibres. The fraction of stimulated fibres decayed exponentially from the centre of the network.
Incremental responses.
Before examining the effects of short-term synaptic plasticity, we studied the network with all synaptic conductances kept fixed. When this network was given a train of shocks at 10 Hz, PY cell responses to individual shocks were very similar (Fig. 4A). PY cells close to the point of stimulation responded with a single spike to each shock (27 out of 121), whereas cells away from the stimulation site displayed sub-threshold mixtures of EPSPs and IPSPs. A few PY cells in the periphery fired an action potential to all or some of the second and following shocks, but not to the first shock (8 out of 121). This occurred because neighbouring IN cells were slightly hyperpolarized preceding the second and following shocks. This hyperpolarization caused a small delay in IN cell action potential generation and, consequently, a failure to prevent the action potential in PY cells.
Figure 4.

Incremental responses in the network model with short-term plasticity of cortical synapses
In this and subsequent colour figures the centre 81 (out of 121) cells were lined up along the vertical axis and activity was ‘imaged’ in time. Membrane potentials are colour-coded from dark blue (hyperpolarization) to red (depolarization). Action potentials are indicated by black dots. A, responses of PY cells in the network with fixed synapses were similar for shocks at 10 Hz. B, responses of PY cells (top) and IN cells (bottom) in the network with short-term synaptic plasticity were progressively enhanced during the first few shocks at 10 Hz. C, responses of PY cells were not incremental when the network was spontaneously active. D, incremental PY responses were reduced at high and low frequencies of stimulation. Top, PY cell responses to stimulation at 2 Hz (time between shocks is truncated). Bottom, PY cell responses to stimulation at 30 Hz. The time scale is identical for all plots. E, left: average response increment (RI) as a function of stimulation frequency. Right, frequency dependence of the average increase in membrane depolarization of the centre 51 PY cells.
In contrast, the network model with dynamic synapses responded incrementally to the first few shocks in a 10 Hz train (Fig. 4B). Compared with the first shock, the second and subsequent shocks depolarized cells more strongly and increased the number of action potentials. The responses of PY cells close to the stimulus increased from one to two spikes per shock (PY61, Fig. 5). Away from the stimulus, different response types were observed. PY cells that fired a spike for the first shock increased depolarizations for the subsequent shocks (PY50, Fig. 5). PY cells that were subthreshold for the first shock increased depolarizations and carried spikes for the second (PY45, Fig. 5) or third (PY42, Fig. 5) and some or all of the subsequent shocks. PY cells far away from the stimulus showed mixtures of subthreshold postsynaptic potentials (PSPs) with similar amplitudes for each shock (PY35, Fig. 5), or decremental responses (PY25, Fig. 5) due to depression of local excitatory synapses. IN cells also displayed incremental responses (Fig. 4B, bottom).
Figure 5.
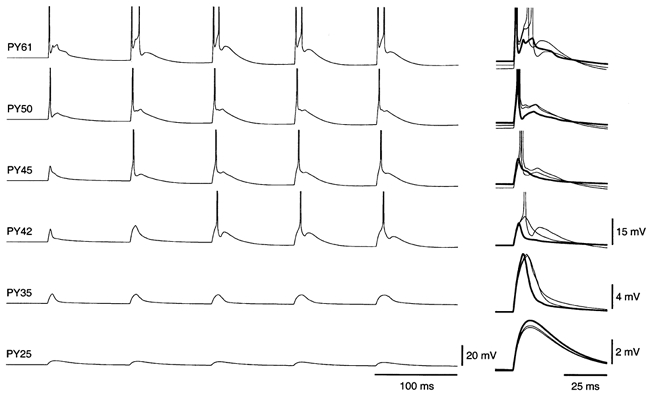
Incremental responses in individual PY cells in the cortical network model
Left, membrane potentials for five cortical shocks at 10 Hz from site of stimulation (PY61) to periphery (PY25). Right, overlaid and expanded voltage traces for the first shock (thick line), and second and third shocks (thin lines).
Stimulation frequency.
At low frequencies of stimulation each shock evoked spikes in a similar number of cells (2 Hz, Fig. 4D). At high frequencies some of the shocks evoked spikes in cells that did not spike on the first shock, and in a few cells that did spike on the first shock an additional spike was elicited (30 Hz, Fig. 4D). However, most of the later shocks in a train evoked the same number of spikes as the first shock. The response increment (RI; see Methods) value was maximal for frequencies between 4 and 10 Hz, with a rapid fall-off at lower and higher frequencies (Fig. 4E, left). The average depolarization of cells evoked by each shock was measured during a 25 ms period following stimulation by subtracting the pre-shock membrane potential. The average depolarization of the centre 51 cells strongly increased during the first few shocks at frequencies around 10 Hz. Increases in average PY cell depolarization reached over 7 mV and peaked for frequencies between 8 and 20 Hz, with a rapid fall-off at lower and higher frequencies (Fig. 4E, right). In the network without short-term synaptic plasticity, RI values at frequencies between 5 and 30 Hz were small (Fig. 4E, left). Similarly, a small increase in depolarization occurred at frequencies between 10 and 25 Hz (Fig. 4E, right).
Stimulation intensity.
A wide range of stimulation intensities induced incremental responses (Fig. 6). Stimulation intensity was varied by scaling the maximal conductances of the extrinsic afferent synapses and the fraction, x, of intrinsic synapses directly activated by the electrical stimulus, compared with those used in other parts of this study (100 %; g_ext-PY = 60 nS, g_ext-IN = 20 nS and x = 0.1). For low intensities none of the shocks at 10 Hz evoked spikes in PY cells (10 %, Fig. 6). Peak depolarization of PY cells close to the stimulus was similar for all shocks, but PSPs decayed more slowly for later shocks. PY cells away from the stimulus displayed decremental responses. Incremental responses were observed for higher stimulation intensities (25-200 %; Fig. 6). For intensities ≥ 25 %, the first few shocks at 10 Hz resulted in an increasing number of spiking PY cells. Also, at intensities ≥ 100 % some PY cells responded with one spike to the first shock and with two or three spikes to subsequent shocks. Voltage traces of a PY cell (PY52) at different stimulation intensities are shown in Fig. 6B. The responses of this cell were decremental at 10 % intensity and incremental in depolarization and/or spike number at intensities ≥ 25 %. At 50 % intensity, RI values were high at stimulation frequencies ≤ 20 Hz (see Fig. 8J). This was due to the relatively small number of PY cells that responded to the first shock. All higher intensities (≥ 100 %) generated similar frequency-dependent RI values.
Figure 6.

Influence of stimulation intensity on incremental responses in the network model
A, responses of PY cells in the network for five shocks at 10 Hz at increasing stimulation intensities (centre 65 cells are shown). B, voltage traces of a single PY cell (PY52) at the same stimulation intensities. Stimulation intensity was changed by scaling the peak conductances of the extrinsic afferents and the fraction of intrinsic synapses activated by the electrical stimulus from 10 % up to 200 %.
Stimulations were also performed without direct electrical activation of intrinsic synapses (x = 0), which might correspond to a stimulus location in the white matter. This resulted in a larger number of PY cells that spiked for the first shock (not shown). The first spike of IN cells was delayed because PY-IN excitatory synapses were not electrically stimulated. This allowed afferent excitation to reach spike threshold in a larger group of PY cells. Responses to later shocks were relatively unaffected and RI values were reduced at all frequencies and intensities (see Fig. 8K).
Transient incremental responses.
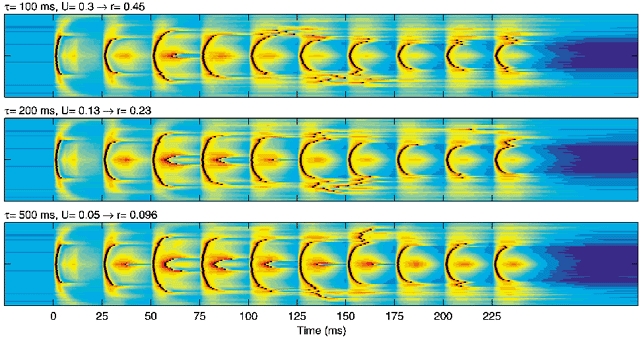
At high frequencies of stimulation some of the early shocks evoked enhanced network responses compared with the first shock, whereas most of the later shocks evoked similar responses (30 Hz, Fig. 4D; see also Fig. 2B). We examined whether these ‘transient’ incremental responses depended on the rate r at which synaptic depression reached steady-state D∞. For a synapse with a single depression component, r depends on spike frequency, U and τ (see Methods). By changing U and τ it is possible to change r while keeping D∞ approximately constant. Using this approach we considered three different rates of depression for the extrinsic afferents (onto both PY and IN cells), with r = 0.45 (U = 0.3, τ = 100 ms), r = 0.23 (U = 0.13, τ = 200 ms) and r = 0.096 (U = 0.05, τ = 500 ms) at a frequency of 40 Hz. As expected, RI values were similar for the three rates at all stimulation frequencies, although the fall-off at high frequencies was less rapid at r = 0.096 compared with r = 0.45 or r = 0.23 (not shown). The main difference occurred for responses to the early shocks in a high-frequency train. Low r values resulted in strong transient incremental responses (Fig. 7). For example, for r = 0.45 a few PY cells fired two spikes on the third shock, whereas double spikes occurred on shocks 3–5 for r = 0.23 and shocks 2–7 for r = 0.096. Similarly, increasing the rate of depression for IN-PY synapses, or decreasing the rate for PY-PY synapses, enhanced transient incremental responses (not shown). Thus, transient incremental responses occur at high stimulation frequencies when the rate of depression at excitatory synapses is slow compared with that at inhibitory synapses.
Figure 7.
Dependence of transient incremental responses on the rate of depression of afferent excitatory synapses
From top to bottom, responses at a stimulation frequency of 40 Hz in the network model for decreasing rates, r, of depression of extrinsic afferents (centre 65 cells are shown). The indicated parameter values resulted in a similar steady-state depression but different rates of convergence to steady state.
Spontaneous activity.
To determine how responses were affected by spontaneous activity mimicking in vivo conditions, each PY cell in the network was bombarded by independent random excitatory synaptic inputs. This bombardment resulted in irregular action potential firing at rates around 6 Hz for PY cells and 23 Hz for IN cells. The active network did not display incremental responses when electrically stimulated at 10 Hz (Fig. 4C). Instead, stimulation recruited a large number of spiking PY cells starting from the first shock. This occurred as inhibitory synapses were depressed due to the spontaneous activity and PY cells were depolarized. Results were similar for a wide range of spontaneous firing rates.
Parameter dependence
To study the robustness of incremental responses we modified some of the parameters and compared RI values after parameter modification with those corresponding to the original set of parameters studied above (Fig. 4E).
Synaptic conductances.
The conductance of the IN-PY synapses strongly influenced the number of spiking cells in the network. An increase of 50 % reduced the number of spikes from 27 to 21 for the first shock, and from an average of 44.8 to 37.6 for the last five shocks at 10 Hz stimulation. A 50 % decrease in conductance most strongly increased spikes for the first shock (44 spikes) compared with the last shocks (average 52.4 spikes). This strong increase for the first shock was largely mediated by a contribution of recurrent excitatory synapses, which were strongly depressed during the later shocks. At higher stimulation frequencies, the number of spikes for the last shocks was less dependent on the IN-PY conductance value as both inhibitory and recurrent excitatory synapses were strongly depressed. Since RI is a ratio relative to the first shock, RI values increased for larger IN-PY conductance values and decreased for smaller conductance values (Fig. 8A).
One of the effects of decreasing PY-IN conductance was to delay IN cell spike times due to the decreased excitatory drive to IN cells. This had a much stronger impact on the number of PY cell spikes for the first shock than for the later shocks. Consequently, RI values decreased (Fig. 8B). This differential impact was a result of the depression of inhibitory IN-PY synapses during the repetitive stimulation: with weak IN-PY synapses the exact timing of IN cell firing influenced the number of PY cell spikes only weakly, whereas with strong IN-PY synapses small changes in IN cell spike times resulted in large changes in the number of PY cell spikes. In the model without PY-IN synapses, the first and some of the later shocks resulted in spike activity that spread over the whole network since peripheral IN cells were not activated by the electrical stimulus. The PY-IN conductance also influenced IN cell responses. For small values (g_PY-IN = 20 nS) the number of spikes was similar for the first and later shocks, whereas for large values (g_PY-IN = 80 nS) the number of IN cell spikes increased by 31 %.
The relative synaptic strength of extrinsic afferent contacts onto PY and IN cells influenced the proportion of PY cells that spiked, especially on the first shock. For stronger extrinsic activation of the IN cells a smaller number of PY cells spiked on the first shock, and responses to subsequent shocks were moderately reduced. As a result RI values increased (Fig. 8C). For strong extrinsic activation of the IN cells (g_ext-IN = 60 nS) responses at high frequencies were transiently incremented. Also, at frequencies ≥ 20 Hz the ninth or tenth shock resulted in a lateral propagation of spike activity because IN-PY synapses were strongly depressed. This strongly increased RI values at high frequencies (g_ext-IN = 60 nS; Fig. 8C). Strong extrinsic activation of the PY cells had a similar but opposite effect on RI values (not shown).
Incremental responses occurred for different maximal conductance values of the PY-PY synapses. An increase in the peak conductance moderately reduced RI values at frequencies ≥ 10 Hz but increased RI values at low frequencies (Fig. 8D). The first few shocks at high frequencies were strongly incremented. With very strong PY-PY synapses, the first and some of the subsequent shocks resulted in a propagation of activity up to the boundaries of the network. Without PY-PY synapses (g_PY-PY = 0), RI values were only slightly affected at most frequencies.
Synaptic plasticity.
The time constant of recovery of synaptic depression of IN-PY synapses strongly influenced PY cell responses. Fast time constants, compared with the original parameter value (750 ms), reduced RI values at all frequencies, whereas slow time constants increased RI values at most frequencies (Fig. 8E). Without plasticity (τ = 0) responses were decremental at frequencies > 10 Hz. The U value affected incremental responses in a very similar way (not shown). At high U values the first few shocks at high frequencies were incremented.
Incorporation of a depression component (U = 0.3, τD = 750 ms) or a facilitation component (U = 0.3, τD = 0, τF = 100 ms) for the PY-IN synapses had little effect on PY cell responses and RI values (Fig. 8F). This was expected as the number of spikes for the later shocks depended only weakly on PY-IN conductance (see above). Depression and facilitation did have a large impact on the nature of IN cell responses. With PY-IN facilitation most IN cells displayed incremental responses (38 % more spikes) compared with decremental responses with PY-IN depression (27 % fewer spikes).
The time constant of the extrinsic afferents strongly influenced responses at frequencies > 5 Hz (Fig. 8G). For τ = 50 ms RI values increased for frequencies > 5 Hz. Without short-term depression of the extrinsic afferents (τ = 0) responses to frequencies ≥ 0 Hz were equally incremented. For τ = 200 ms, incremental responses were reduced and decremental at frequencies ≥ 20 Hz. Changes in the U value of the extrinsic afferents had a similar effect on RI values (not shown). At low U values, shocks at high frequencies were transiently incremented.
Reduction of the slow time constant of the PY-PY synapses strongly enhanced incremental responses, in particular at frequencies between 5 and 10 Hz (Fig. 8H). Without the slow component (τ = 0) RI values were over 200 % at a peak frequency of 10 Hz and the number of spiking PY cells increased every shock. Elimination of the fast component had little effect on RI values (τ = 750 ms, Fig. 8L), although responses were transiently incremented at high frequencies. For small U values (of the slow component, in the absence of the fast component) responses were strongly incremented at frequencies around 10 Hz (not shown). The first few shocks at high frequencies were transiently incremented (U = 0.2) and caused strong discharges in the centre (U = 0.1).
Intrinsic currents.
Elimination of the calcium-activated potassium current IK(Ca) in PY cells enhanced incremental responses, especially at high frequencies (g_K(Ca) = 0; Fig. 8I). Results were similar when the high-threshold calcium current (ICa) responsible for calcium entry, or both ICa and IK(Ca), were eliminated. Stronger IK(Ca) in PY cells (g_K(Ca) = 1 mS cm−2) reduced RI values. Elimination of IK(Ca) in IN cells resulted in a weak reduction of RI values at frequencies between 5 and 10 Hz (not shown). However, in the network without short-term synaptic plasticity the weak incremental responses caused by hyperpolarization of IN cells (see Fig. 4A and E) were completely eliminated at all frequencies.
We tested the effects of three ionic currents typically involved in the generation of intrinsic resonances: a low-threshold calcium current (IT), a hyperpolarization-activated current (IH) and a persistent sodium current (INa,P). The PY model with strong IT (g_T = 0.3 mS cm−2) responded with a rebound burst carrying two spikes when injected with a constant negative current (200 ms, −85 mV). Incorporation of strong IT in PY cells enhanced plasticity-induced incremental responses (not shown). RI values increased to 125 % at 10 Hz and to a peak value of 178 % at 6 Hz, but IT did not affect RI values at frequencies ≥ 20 Hz. Addition of IH to the PY model (g_H = 0.05 mS cm−2) resulted in typical ‘sag’ responses with hyperpolarizing current injections, and addition of INa,P (g_Na,P = 0.07 mS cm−2) decreased the threshold for firing action potentials with depolarizing current injections. However, incorporation of IH or INa,P in PY cells did not significantly influence responses to electrical shocks and resulted in similar RI curves (not shown).
Other parameters.
The relative size of the dendritic compartment (ρ) of the PY cell influenced its responses to step current injections (see Methods) and the number of cells in the network responding to repetitive shocks (not shown). For large values of ρ (190, IB-type cells), fewer PY cells spiked compared with the original ρ (140, RS-type cells). However, at 10 Hz, more PY cells incremented from one to two spikes. RI values were enhanced at frequencies ≤ 20 Hz with a peak of 117 % at 10 Hz. For small values of ρ (50, FS-type cells), a larger number of PY cells fired spikes. Incremental responses were enhanced near the site of stimulation at all frequencies, but away from the stimulus, incremental responses were reduced. RI values were similar to those of the original ρ at all frequencies.
A reduction in the fraction x of intrinsic (IN-PY, PY-PY, PY-IN) synapses directly activated by the electrical stimulus reduced RI values at all frequencies (see Fig. 8K), as described above. Fractions x ≥ 0.1 resulted in similar RI curves. However, when x was large (x ≥ 0.5) RI values at frequencies ≥ 30 Hz could be high as a result of a lateral propagation of spike activity in response to one of the later shocks. This did not occur when PY-IN synapses exhibited depression (U = 0.3, τD = 750 ms).
Depression of extrinsic and inhibitory synapses.
As described above, parameters of depression for the extrinsic afferent synapses and the inhibitory synapses had a strong impact on incremental responses. Increased depression of extrinsic synapses or decreased depression of inhibitory synapses reduced incremental responses, and zero depression of extrinsic synapses strongly enhanced incremental responses at high frequencies. We investigated whether these reductions in size and frequency selectivity of incremental responses could be counteracted by ‘tweaking’ other parameters. Parameters were changed one by one to those values that most strongly increased (or decreased) RI (see Fig. 8).
Increased depression of extrinsic afferent synapses by a slower recovery time constant (τ = 200 ms) resulted in weak incremental responses (see Fig. 8G), with RI values of 53 % and 32 % at 5 and 10 Hz, respectively. The following parameter changes gave rise to significant increases in RI: reduction of PY-PY depression, increase in IN-PY depression, reduction of PY (or increase in IN) extrinsic afferent conductance and reduction of IK(Ca). These parameter changes resulted in RI values, at 5 and 10 Hz, respectively, of 171 % and 198 % (τPY-PY = 0), 118 %α and 59 % (τIN-PY = 1500 ms), 80 % and 59 % (g_ext-PY = 40 nS), 68 % and 48 % (g_ext-IN = 60 nS) and 78 % and 78 % (g_K(Ca) = 0). Responses at 5 Hz were strongly incremented for all parameter changes. Also, reduction of g_K(Ca) produced strong transient incremental responses at high frequencies. The changes in extrinsic afferent conductances resulted in a large number of cells responding to the later shocks in a 10 Hz train, but individual cells spiked only once per shock. When the extrinsic afferents depressed more strongly (τ = 400 ms), RI values at 5 and 10 Hz, respectively, were 141 % and 156 % (τPY-PY = 0), 82 % and 10 % (τIN-PY = 1500 ms), 45 % and 8 % (g_ext-PY = 40 nS), 40 % and 15 % (g_ext-IN = 60 nS), and 39 % and 25 % (g_K(Ca) = 0). When the extrinsic afferents depressed as strongly as the inhibitory synapses (τ = 750 ms), only reduction of PY-PY depression resulted in strong incremental responses. RI values were 104 % and 108 % at 5 and 10 Hz, respectively (τPY-PY = 0). These results indicate that incremental responses may still occur if depression of extrinsic afferents is strong, but the properties are different from those with relatively weak depression.
Without depression of extrinsic afferent synapses (τ = 0), responses were strongly incremented at frequencies ≥ 10 Hz (see Fig. 8G). Some parameter changes resulted in strong non-selective reductions of RI at all frequencies (g_ext-IN = 0; x = 0). Other changes reduced RI selectively at high frequencies, but only weakly, so that responses were still incremented (g_PY-IN = 20 nS; g_K(Ca) = 0). Alternatively, incremental responses were strongly reduced at frequencies > 10 Hz but RI values at frequencies ≤ 10 Hz were similar (g_IN-PY = 50 nS). All of the parameter changes gave rise to strong transient incremental responses. Thus, the frequency dependence of incremental responses is weak without depression of extrinsic afferent synapses, and this could not be counteracted by parameter changes.
Relatively weak depression of inhibitory synapses (τ = 250–500 ms) resulted in weak incremental responses (see Fig. 8E). When depression of the PY-PY synapse was matched to that of the IN-PY synapse, RI values were slightly increased (Fig. 8L) but responses at high frequencies were transiently incremented. Peak RI values were 34 % for τ = 250 ms and 61 % for τ = 500 ms. Next, other parameters were varied to determine whether the reduction of RI values at τ = 250 ms could be reversed. The only parameter changes that significantly increased RI were an increase in PY-PY conductance and a reduction of PY extrinsic afferent conductance. Peak RI values were 55 % (g_PY-PY = 40 nS) and 53 % (g_ext-PY = 40 nS) at a stimulation frequency of 10 Hz. Very strong transient incremental responses occurred at high frequencies for increases in g_PY-PY. The reduction of extrinsic afferent conductance resulted in a large number of cells responding to the later shocks in a 10 Hz train, but individual cells spiked only once per shock. These results indicate that incremental responses may still occur if depression of inhibitory synapses is relatively weak, but the properties are different from those with strong depression.
Reduced model
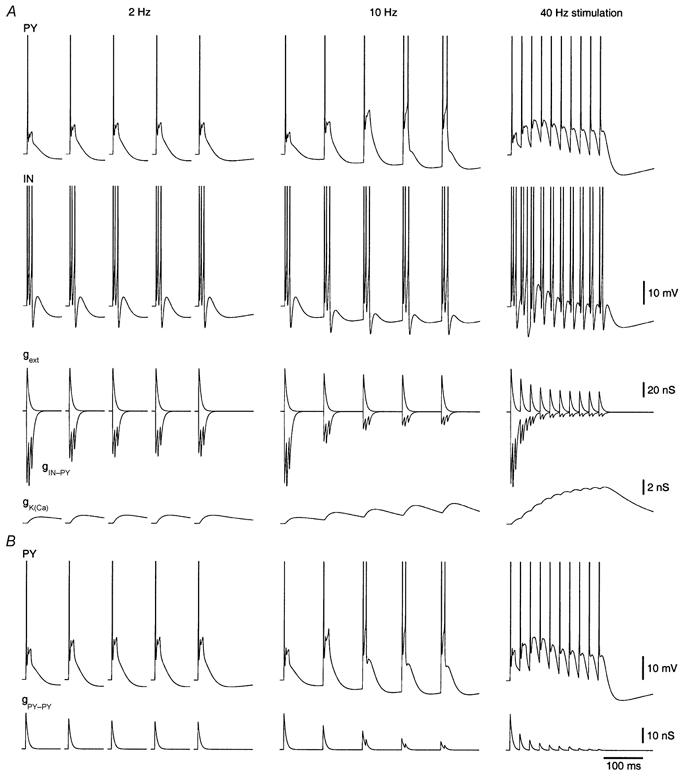
To investigate the mechanisms underlying incremental responses in the full network model, a simpler model was examined that included one PY cell, one IN cell, an inhibitory IN-PY connection with short-term depression, and extrinsic afferents without depression (Fig. 1C). In this model PY cell responses to shocks at ≥ 5 Hz incremented in depolarization and number of spikes during the train (not shown). When the extrinsic afferent synapses depressed (for the PY contact, or both PY and IN contacts), incremental responses disappeared at high frequencies of stimulation, but not at 10 Hz (PY; Fig. 9A). At 10 Hz, the inhibitory synapse depressed strongly (gIN-PY, Fig. 9A), whereas the extrinsic afferent synapse depressed only slightly (gext, Fig. 9A). At 2 Hz, the inhibitory synapse depressed considerably, but not as strongly as at 10 Hz, due to the longer recovery period between shocks (500 vs. 100 ms). At 40 Hz, the inhibitory synapse depressed more strongly than at 10 Hz, but the excitatory extrinsic afferent synapse depressed considerably too. Also, at high frequencies, internal [Ca2+ ] built up, which caused a strong activation of IK(Ca) (gK(Ca), Fig. 9A). Activation of the other intrinsic conductances was similar between different frequencies (not shown).
Figure 9.
Incremental responses in the reduced model
The reduced model consisted of a single PY-IN cell pair, an inhibitory IN-PY synapse and extrinsic afferent synapses (Fig. 1C). A, top: PY and IN cell responses to five shocks at 2 Hz (time between shocks is truncated) and 10 Hz, and ten shocks at 40 Hz. Synaptic conductance values were: g_ext-PY = 60 nS, g_ext-IN = 60 nS and g_IN-PY = 100 nS. Synaptic plasticity parameters were the same as in the full network model. All synapses were stimulated by the electrical stimulus. Bottom, synaptic conductance traces of the inhibitory and extrinsic afferent synapses onto the PY cell and the conductance of the calcium-activated potassium current in the PY cell. B, top: PY cell responses to five shocks at 2 Hz and 10 Hz, and ten shocks at 40 Hz when a self-excitatory synapse was included for the PY cell (g_PY-PY = 25 nS). Bottom, synaptic conductance trace of the self-excitatory PY-PY synapse. The time scale is identical for all plots.
We also added a self-connection for the PY cell to mimic recurrent connections. When the conductance was small and fixed (and the other synapses were dynamic), PY responses strongly incremented at 10 Hz but also transiently incremented at high frequencies (not shown). When short-term depression of the PY-PY synapse was included, incremental responses were reduced at high frequencies (Fig. 9B). The additional self-excitation resulted in a faster onset of incremental responses at 10 Hz (cf. Fig. 9A and B).
DISCUSSION
In vivo recordings demonstrate that augmenting responses are preserved in the deafferented cortical slab preparation (Fig. 2B and Fig. 3; see also Timofeev et al. 2002). Electrical stimulation at frequencies around 10 Hz evoked intracellular responses that grew in depolarization accompanied by an increase in spike number. The incremental nature and frequency dependence of these augmenting responses were reproduced in a simple cortical network model that included short-term depression of inhibitory and excitatory synapses. Both in the model and in vivo, augmenting responses required high stimulation intensities and a proximity of the recorded cell to the stimulating electrode. Decremental responses were observed at high frequencies, at locations away from the stimulating electrode, and at low intensities.
Incremental responses in the full network model were reproduced in a reduced network that consisted of a connected PY-IN cell pair. The PY cell response incremented because depression of the inhibitory synapse was much stronger than depression of the excitatory extrinsic afferent synapse. This difference in depression boosted the net excitatory drive to the PY cell at stimulation frequencies around 10 Hz. Incremental responses were reduced at other frequencies. At low frequencies, depression of the inhibitory synapse was relatively weak which only moderately enhanced excitation of the PY cell. At high frequencies, depression of the excitatory extrinsic afferent synapse and activation of a calcium-activated potassium current counteracted the summation of postsynaptic potentials. Addition of a self-excitatory synapse for the PY cell accelerated the onset of incremental responses, but was not essential for incremental responses to develop. Simulations suggest a similar mechanism underlies incremental responses in the full network model. The additional recurrent excitatory synapses between PY cells amplified excitatory potentials. Strong depression of these synapses, as observed experimentally, was necessary to reduce incremental responses at high frequencies. Short-term plasticity of PY-IN synapses had little effect on PY cell responses.
Incremental responses were found for a wide range of parameter values. Interestingly, some parameter values resulted in strong transient incremental responses at high stimulation frequencies. These were characterized by incremental responses to a few early shocks, but responses to later shocks that were similar to the first response. These transient incremental responses occurred when IN cells were strongly activated by the electrical stimulus, when the conductance of recurrent PY-PY synapses was large, or when the rate of depression at excitatory synapses was slow compared with that at inhibitory synapses. The degree of depression of extrinsic afferent (thalamocortical and intercortical) synapses strongly influenced incremental responses. Without depression, incremental responses also occurred at high frequencies. When these synapses depressed strongly, incremental responses were reduced and occurred at frequencies < 10 Hz. Strong incremental responses at frequencies around 10 Hz could be restored by weaker depression of recurrent excitatory synapses. However, recent experiments suggest a stronger or similar depression of recurrent excitatory synapses compared with inhibitory synapses (Galarreta & Hestrin, 1998; Varela et al. 1999). Incremental responses required a strong depression of inhibitory synapses. Weaker depression, also in conjunction with weaker depression of recurrent excitatory synapses, reduced incremental responses.
The models of incremental responses in cortical networks make several predictions that can be tested experimentally. Firstly, partial block of GABAA synapses should reduce augmenting responses. Reduction of the conductance of inhibitory synapses in the model increased responses to all shocks, but most strongly those to the first shock. This occurred because, if depression was unchanged, the absolute reduction in inhibitory current was largest for the first shock. Secondly, stimulation in the white matter (in cortical slabs or slices) should result in weaker augmenting responses than stimulation in the grey matter. Incremental responses in the model were reduced when only extrinsic afferents were stimulated compared with stimulation of both extrinsic and intrinsic synapses. Thirdly, the cortical component of augmenting responses should be reduced during active states in vivo. Responses to the first and later shocks in the model with spontaneous activity were similar to each other and to the responses to later shocks in the silent network. The observation that layer 5 cells, but not layer 3 cells, generated incremental responses in slices of rat motor cortex (Castro-Alamancos & Connors, 1996b) may be explained in the context of our model. In vivo recordings in the motor cortex revealed a current sink in layer 5 in response to single shocks to the thalamus (Castro-Alamancos & Connors, 1996a), which suggests that layer 5 cells are more strongly innervated by thalamic afferents than layer 3 cells. In the model, a decrease in the conductance values of extrinsic afferent synapses reduces the number of cells displaying incremental responses, as strongly depressing recurrent synapses now make up a larger fraction of excitatory inputs to PY cells. In addition, the presence of low-threshold calcium currents in neurones of the deep layers, but not the upper layers, could selectively boost augmenting responses in layer 5. The observation that repetitive low-intensity stimuli to layer 4 of different sensory cortices may result in the depression of PSPs is consistent with the model since augmenting responses in both experiment and model require relatively strong electrical stimulation, whereas decremental responses occur with low intensities.
A recent study suggested that intracortical augmenting responses may be generated by the activation of H-currents and deinactivation of T-currents by strong hyperpolarization in layer 5 cells (Castro-Alamancos & Connors, 1996b). This mechanism is similar to the mechanism underlying thalamically generated augmenting responses (Bazhenov et al. 1998a). Incorporation of strong IT in all PY cells of the model enhanced incremental responses at 10 Hz stimulation but only when short-term synaptic plasticity was included. With the addition of IT, incremental responses peaked at lower stimulation frequencies, as expected from the low frequency (2-6 Hz) resonance of neurones with IT (Puil et al. 1994). The contribution of IT to augmenting responses in the slab is probably weaker than that modelled here, as only a small fraction of cortical pyramidal cells displays low-threshold calcium spikes (Paré & Lang, 1998) and the low-threshold rebound in cat cortical cells is usually quite sluggish (I. Timofeev & M. Steriade, unpublished observations). Incorporation of IH in all PY cells did not enhance incremental responses.
Studies in the inferior olive (Llinás & Yarom, 1986) and the thalamus (Steriade et al. 1993) indicate that intrinsic resonances there may underlie network oscillations. Computational models of networks of neurones with intrinsic resonances may also generate synchronized oscillations around the resonant frequency (Bazhenov et al. 1999). In our study, short-term plasticity of cortical synapses caused a resonance at the network level even though the individual neurones were non-resonant. Other experimental (Fedirchuk et al. 1999) and theoretical (Carpenter & Grossberg, 1983; Nadim et al. 1999) studies have an active role for synaptic depression in rhythmogenesis. In addition, synchronization between neurones may depend on the strength of synaptic interactions (Huntsman et al. 1999; Tamás et al. 2000). Taken together, these results suggest that short-term plasticity of cortical synapses is involved in shaping the dynamics of large-scale synchronous oscillations, especially during sleep and pathological conditions.
Acknowledgments
This research was supported by the Sloan Center for Theoretical Neurobiology, National Institutes of Health of the USA, Howard Hughes Medical Institute, Canadian Institutes of Health Research, Fonds de la Recherche en Santé du Québec and Human Frontier Science Program.
REFERENCES
- Abbott LF, Varela JA, Sen K, Nelson SB. Synaptic depression and cortical gain control. Science. 1997;275:220–224. doi: 10.1126/science.275.5297.221. [DOI] [PubMed] [Google Scholar]
- Alzheimer C, Schwindt PC, Crill WE. Modal gating of Na+ channels as a mechanism of persistent Na+ current in pyramidal neurons from rat and cat sensorimotor cortex. Journal of Neuroscience. 1993;13:660–673. doi: 10.1523/JNEUROSCI.13-02-00660.1993. [DOI] [PMC free article] [PubMed] [Google Scholar]
- Bazhenov M, Timofeev I, Steriade M, Sejnowski TJ. Cellular and network models for intrathalamic augmenting responses during 10-Hz stimulation. Journal of Neurophysiology. 1998a;79:2730–2748. doi: 10.1152/jn.1998.79.5.2730. [DOI] [PubMed] [Google Scholar]
- Bazhenov M, Timofeev I, Steriade M, Sejnowski TJ. Computational models of thalamocortical augmenting responses. Journal of Neuroscience. 1998b;18:6444–6465. doi: 10.1523/JNEUROSCI.18-16-06444.1998. [DOI] [PMC free article] [PubMed] [Google Scholar]
- Bazhenov M, Timofeev I, Steriade M, Sejnowski TJ. Self-sustained rhythmic activity in the thalamic reticular nucleus mediated by depolarizing GABAA receptor potentials. Nature Neuroscience. 1999;2:168–174. doi: 10.1038/5729. [DOI] [PubMed] [Google Scholar]
- Buhl EH, Tamás G, Szilágyi T, Stricker C, Paulsen O, Somogyi P. Effect, number and location of synapses made by single pyramidal cells onto aspiny interneurones of cat visual cortex. Journal of Physiology. 1997;500:689–713. doi: 10.1113/jphysiol.1997.sp022053. [DOI] [PMC free article] [PubMed] [Google Scholar]
- Carpenter GA, Grossberg S. A neural theory of circadian rhythms: the gated pacemaker. Biological Cybernetics. 1983;48:35–59. [Google Scholar]
- Castro-Alamancos MA, Connors BW. Short-term plasticity of a thalamocortical pathway dynamically modulated by behavioral state. Science. 1996a;272:274–277. doi: 10.1126/science.272.5259.274. [DOI] [PubMed] [Google Scholar]
- Castro-Alamancos MA, Connors BW. Cellular mechanisms of the augmenting response: short-term plasticity in a thalamocortical pathway. Journal of Neuroscience. 1996b;16:7742–7756. doi: 10.1523/JNEUROSCI.16-23-07742.1996. [DOI] [PMC free article] [PubMed] [Google Scholar]
- Deisz RA, Prince DA. Frequency-dependent depression of inhibition in guinea-pig neocortex in vitro by GABAB receptor feed-back on GABA release. Journal of Physiology. 1989;412:513–541. doi: 10.1113/jphysiol.1989.sp017629. [DOI] [PMC free article] [PubMed] [Google Scholar]
- Destexhe A, Contreras D, Steriade M, Sejnowski TJ, Huguenard JR. In vivo, in vitro and computational analysis of dendritic calcium currents in thalamic reticular neurons. Journal of Neuroscience. 1996;16:169–185. doi: 10.1523/JNEUROSCI.16-01-00169.1996. [DOI] [PMC free article] [PubMed] [Google Scholar]
- Destexhe A, Mainen ZF, Sejnowski TJ. Kinetic models of synaptic transmission. In: Koch C, Segev I, editors. Methods in Neuronal Modeling. 2. Cambridge: MIT Press; 1997. pp. 1–25. [Google Scholar]
- Destexhe A, Sejnowski TJ. Thalamocortical Assemblies. New York: Oxford University Press; 2001. [Google Scholar]
- Fanselow EE, Sameshima K, Baccala LA, Nicolelis MA. Thalamic bursting in rats during different awake behavioral states. Proceedings of the National Academy of Sciences of the USA. 2001;98:15330–15335. doi: 10.1073/pnas.261273898. [DOI] [PMC free article] [PubMed] [Google Scholar]
- Fedirchuk B, Wenner P, Whelan PJ, Ho S, Tabak J, O'Donovan MJ. Spontaneous network activity transiently depresses synaptic transmission in the embryonic chick spinal cord. Journal of Neuroscience. 1999;19:2102–2112. doi: 10.1523/JNEUROSCI.19-06-02102.1999. [DOI] [PMC free article] [PubMed] [Google Scholar]
- Fellous JM, Houweling AR, Modi RH, Rao RP, Tiesinga PH, Sejnowski TJ. Frequency dependence of spike timing reliability in cortical pyramidal cells and interneurons. Journal of Neurophysiology. 2001;85:1782–1787. doi: 10.1152/jn.2001.85.4.1782. [DOI] [PubMed] [Google Scholar]
- Ferster D, Lindström S. Augmenting responses evoked in area 17 of the cat by intracortical axon collaterals of cortico-geniculate cells. Journal of Physiology. 1985;367:217–232. doi: 10.1113/jphysiol.1985.sp015821. [DOI] [PMC free article] [PubMed] [Google Scholar]
- Finnerty GT, Roberts LSE, Connors BW. Sensory experience modifies the short-term dynamics of neocortical synapses. Nature. 1999;400:367–371. doi: 10.1038/22553. [DOI] [PubMed] [Google Scholar]
- Galarreta M, Hestrin S. Frequency-dependent synaptic depression and the balance of excitation and inhibition in the neocortex. Nature Neuroscience. 1998;1:587–594. doi: 10.1038/2822. [DOI] [PubMed] [Google Scholar]
- Galarreta M, Hestrin S. A network of fast-spiking cells in the neocortex connected by electrical synapses. Nature. 1999;402:72–75. doi: 10.1038/47029. [DOI] [PubMed] [Google Scholar]
- Gibson JR, Beierlein M, Connors BW. Two networks of electrically coupled inhibitory neurons in neocortex. Nature. 1999;402:75–79. doi: 10.1038/47035. [DOI] [PubMed] [Google Scholar]
- Gil Z, Connors BW, Amitai Y. Differential regulation of neocortical synapses by neuromodulators and activity. Neuron. 1997;19:679–686. doi: 10.1016/s0896-6273(00)80380-3. [DOI] [PubMed] [Google Scholar]
- Gil Z, Connors BW, Amitai Y. Efficacy of thalamocortical and intracortical synaptic connections: quanta, innervation, and reliability. Neuron. 1999;23:385–397. doi: 10.1016/s0896-6273(00)80788-6. [DOI] [PubMed] [Google Scholar]
- Gupta A, Wang Y, Markram H. Organizing principles for a diversity of GABAergic interneurons and synapses in the neocortex. Science. 2000;287:273–278. doi: 10.1126/science.287.5451.273. [DOI] [PubMed] [Google Scholar]
- Gutfreund Y, Yarom Y, Segev I. Subthreshold oscillations and resonant frequency in guinea-pig cortical neurons: physiology and modelling. Journal of Physiology. 1995;483:621–640. doi: 10.1113/jphysiol.1995.sp020611. [DOI] [PMC free article] [PubMed] [Google Scholar]
- Hempel CM, Hartman KH, Wang XJ, Turrigiano GG, Nelson SB. Multiple forms of short-term plasticity at excitatory synapses in rat medial prefrontal cortex. Journal of Neurophysiology. 2000;83:3031–3041. doi: 10.1152/jn.2000.83.5.3031. [DOI] [PubMed] [Google Scholar]
- Hines ML, Carnevale NT. The NEURON simulation environment. Neural Computation. 1997;9:1179–1209. doi: 10.1162/neco.1997.9.6.1179. [DOI] [PubMed] [Google Scholar]
- Huntsman MM, Porcello DM, Homanics GE, Delorey TM, Huguenard JR. Reciprocal inhibitory connections and network synchrony in the mammalian thalamus. Science. 1999;283:541–543. doi: 10.1126/science.283.5401.541. [DOI] [PubMed] [Google Scholar]
- Hutcheon B, Miura RM, Puil E. Subthreshold membrane resonance in neocortical neurons. Journal of Neurophysiology. 1996;76:683–697. doi: 10.1152/jn.1996.76.2.683. [DOI] [PubMed] [Google Scholar]
- Hutcheon B, Yarom Y. Resonance, oscillation and the intrinsic frequency preferences of neurons. Trends in Neurosciences. 2000;23:216–222. doi: 10.1016/s0166-2236(00)01547-2. [DOI] [PubMed] [Google Scholar]
- Kandel A, Buzsáki G. Cellular-synaptic generation of sleep spindles, spike-and-wave discharges, and evoked thalamocortical responses in the neocortex of the rat. Journal of Neuroscience. 1997;17:6783–6797. doi: 10.1523/JNEUROSCI.17-17-06783.1997. [DOI] [PMC free article] [PubMed] [Google Scholar]
- Llinás R, Yarom Y. Oscillatory properties of guinea-pig inferior olivary neurones and their pharmacological modulation: an in vitro study. Journal of Physiology. 1986;376:163–182. doi: 10.1113/jphysiol.1986.sp016147. [DOI] [PMC free article] [PubMed] [Google Scholar]
- Mainen ZF, Sejnowski TJ. Influence of dendritic structure on firing pattern in model neocortical neurons. Nature. 1996;382:363–366. doi: 10.1038/382363a0. [DOI] [PubMed] [Google Scholar]
- Markram H, Wang Y, Tsodyks M. Differential signaling via the same axon of neocortical pyramidal neurons. Proceedings of the National Academy of Sciences of the USA. 1998;95:5323–5328. doi: 10.1073/pnas.95.9.5323. [DOI] [PMC free article] [PubMed] [Google Scholar]
- Metherate R, Ashe JH. Facilitation of an NMDA receptor-mediated EPSP by paired-pulse stimulation in rat neocortex via depression of GABAergic IPSPs. Journal of Physiology. 1994;481:331–348. doi: 10.1113/jphysiol.1994.sp020443. [DOI] [PMC free article] [PubMed] [Google Scholar]
- Morin D, Steriade M. Development from primary to augmenting responses in the somatosensory system. Brain Research. 1981;205:49–66. doi: 10.1016/0006-8993(81)90719-8. [DOI] [PubMed] [Google Scholar]
- Morison RS, Dempsey EW. Mechanism of thalamocortical augmentation and repetition. American Journal of Physiology. 1943;138:297–308. [Google Scholar]
- Nadim F, Manor Y, Kopell N, Marder E. Synaptic depression creates a switch that controls the frequency of an oscillatory circuit. Proceedings of the National Academy of Sciences of the USA. 1999;96:8206–8211. doi: 10.1073/pnas.96.14.8206. [DOI] [PMC free article] [PubMed] [Google Scholar]
- Nicolelis MA, Baccala LA, Lin RC, Chapin JK. Sensorimotor encoding by synchronous neural ensemble activity at multiple levels of the somatosensory system. Science. 1995;268:1353–1358. doi: 10.1126/science.7761855. [DOI] [PubMed] [Google Scholar]
- Nuñez A, Amzica F, Steriade M. Electrophysiology of cat association cortical cells in vivo: intrinsic properties and synaptic responses. Journal of Neurophysiology. 1993;70:418–430. doi: 10.1152/jn.1993.70.1.418. [DOI] [PubMed] [Google Scholar]
- Paré D, Lang EJ. Calcium electrogenesis in neocortical pyramidal neurons in vivo. European Journal of Neuroscience. 1998;10:3164–3170. doi: 10.1046/j.1460-9568.1998.00323.x. [DOI] [PubMed] [Google Scholar]
- Pike FG, Goddard RS, Suckling JM, Ganter P, Kasthuri N, Paulsen O. Distinct frequency preferences of different types of rat hippocampal neurones in response to oscillatory input currents. Journal of Physiology. 2000;529:205–213. doi: 10.1111/j.1469-7793.2000.00205.x. [DOI] [PMC free article] [PubMed] [Google Scholar]
- Puil E, Meiri H, Yarom Y. Resonant behavior and frequency preferences of thalamic neurons. Journal of Neurophysiology. 1994;71:575–582. doi: 10.1152/jn.1994.71.2.575. [DOI] [PubMed] [Google Scholar]
- Purpura DP, Shofer RJ, Musgrave FS. Cortical intracellular potentials during augmenting and recruiting responses. II. Patterns of synaptic activities in pyramidal and nonpyramidal tract neurons. Journal of Neurophysiology. 1964;27:133–151. doi: 10.1152/jn.1964.27.2.133. [DOI] [PubMed] [Google Scholar]
- Reyes A, Lujan R, Rozov A, Burnashev N, Somogyi P, Sakmann B. Target-cell-specific facilitation and depression in neocortical circuits. Nature Neuroscience. 1998;1:279–285. doi: 10.1038/1092. [DOI] [PubMed] [Google Scholar]
- Reyes A, Sakmann B. Developmental switch in the short-term modification of unitary EPSPs evoked in layer 2/3 and layer 5 pyramidal neurons of rat neocortex. Journal of Neuroscience. 1999;19:3827–3835. doi: 10.1523/JNEUROSCI.19-10-03827.1999. [DOI] [PMC free article] [PubMed] [Google Scholar]
- Rozov A, Jerecic J, Sakmann B, Burnashev N. AMPA receptor channels with long-lasting desensitization in bipolar interneurons contribute to synaptic depression in a novel feedback circuit in layer 2/3 of rat neocortex. Journal of Neuroscience. 2001;21:8062–8071. doi: 10.1523/JNEUROSCI.21-20-08062.2001. [DOI] [PMC free article] [PubMed] [Google Scholar]
- SancheZ-Vives MV, McCormick DA, Nowak LG. Is synaptic depression prevalent in vivo and does it contribute to contrast adaptation? Society for Neuroscience Abstracts. 1998;24:896. [Google Scholar]
- Steriade M, Iosif G, Apostol V. Responsiveness of thalamic and cortical motor relays during arousal and various stages of sleep. Journal of Neurophysiology. 1969;32:251–265. doi: 10.1152/jn.1969.32.2.251. [DOI] [PubMed] [Google Scholar]
- Steriade M, McCormick DA, Sejnowski TJ. Thalamocortical oscillations in the sleeping and aroused brain. Science. 1993;262:679–685. doi: 10.1126/science.8235588. [DOI] [PubMed] [Google Scholar]
- Steriade M, Timofeev I. Short-term plasticity during intrathalamic augmenting responses in decorticated cats. Journal of Neuroscience. 1997;17:3778–3795. doi: 10.1523/JNEUROSCI.17-10-03778.1997. [DOI] [PMC free article] [PubMed] [Google Scholar]
- Steriade M, Timofeev I. Corticothalamic operations through prevalent inhibition of thalamocortical neurons. Thalamus and Related Systems. 2001;1:225–236. [Google Scholar]
- Steriade M, Timofeev I, Grenier F, DÜRMÜLLER N. Role of thalamic and cortical neurons in augmenting responses and self-sustained activity: dual intracellular recordings in vivo. Journal of Neuroscience. 1998;18:6425–6443. doi: 10.1523/JNEUROSCI.18-16-06425.1998. [DOI] [PMC free article] [PubMed] [Google Scholar]
- Stratford KJ, Tarczy-Hornoch K, Martin KA, Bannister NJ, Jack JJ. Excitatory synaptic inputs to spiny stellate cells in cat visual cortex. Nature. 1996;382:258–261. doi: 10.1038/382258a0. [DOI] [PubMed] [Google Scholar]
- Tamás G, Buhl EH, LÖRINCz A, Somogyi P. Proximally targeted GABAergic synapses and gap junctions synchronize cortical interneurons. Nature Neuroscience. 2000;3:366–371. doi: 10.1038/73936. [DOI] [PubMed] [Google Scholar]
- Tarczy-Hornoch K, Martin KA, Jack JJ, Stratford KJ. Synaptic interactions between smooth and spiny neurones in layer 4 of cat visual cortex in vitro. Journal of Physiology. 1998;508:351–363. doi: 10.1111/j.1469-7793.1998.351bq.x. [DOI] [PMC free article] [PubMed] [Google Scholar]
- Thomson AM. Activity-dependent properties of synaptic transmission at two classes of connections made by rat neocortical pyramidal axons in vitro. Journal of Physiology. 1997;502:131–147. doi: 10.1111/j.1469-7793.1997.131bl.x. [DOI] [PMC free article] [PubMed] [Google Scholar]
- Thomson AM, Deuchars J, West DC. Single axon excitatory postsynaptic potentials in neocortical interneurons exhibit pronounced paired pulse facilitation. Neuroscience. 1993;54:347–360. doi: 10.1016/0306-4522(93)90257-g. [DOI] [PubMed] [Google Scholar]
- Timofeev I, Grenier F, Bazhenov M, Houweling AR, Sejnowski TJ, Steriade M. Short- and medium-term plasticity associated with augmenting responses in cortical slabs and spindles in intact cortex of cats in vivo. Journal of Physiology. 2002;542:583–598. doi: 10.1113/jphysiol.2001.013479. [DOI] [PMC free article] [PubMed] [Google Scholar]
- Timofeev I, Grenier F, Bazhenov M, Sejnowski TJ, Steriade M. Origin of slow cortical oscillations in deafferented cortical slabs. Cerebral Cortex. 2000;10:1185–1199. doi: 10.1093/cercor/10.12.1185. [DOI] [PubMed] [Google Scholar]
- Timofeev I, Steriade M. Cellular mechanisms underlying intrathalamic augmenting responses of reticular and relay neurons. Journal of Neurophysiology. 1998;79:2716–2729. doi: 10.1152/jn.1998.79.5.2716. [DOI] [PubMed] [Google Scholar]
- Tsodyks MV, Markram H. The neural code between neocortical pyramidal neurons depends on neurotransmitter release probability. Proceedings of the National Academy of Sciences of the USA. 1997;94:719–723. doi: 10.1073/pnas.94.2.719. [DOI] [PMC free article] [PubMed] [Google Scholar]
- Varela JA, Sen K, Gibson J, Fost J, Abbott LF, Nelson SB. A quantitative description of short-term plasticity at excitatory synapses in layer 2/3 of rat primary visual cortex. Journal of Neuroscience. 1997;17:7926–7940. doi: 10.1523/JNEUROSCI.17-20-07926.1997. [DOI] [PMC free article] [PubMed] [Google Scholar]
- Varela JA, Song S, Turrigiano GG, Nelson SB. Differential depression at excitatory and inhibitory synapses in visual cortex. Journal of Neuroscience. 1999;19:4293–4304. doi: 10.1523/JNEUROSCI.19-11-04293.1999. [DOI] [PMC free article] [PubMed] [Google Scholar]