Abstract
Detailed information regarding the contribution of individual γ-aminobutyric acid (GABA)-containing inhibitory neurons to the overall synaptic activity of single postsynaptic cells is essential to our understanding of fundamental elements of synaptic integration and operation of neuronal circuits. For example, GABA-containing cells in the thalamic reticular nucleus (nRt) provide major inhibitory innervation of thalamic relay nuclei that is critical to thalamocortical rhythm generation. To investigate the contribution of individual nRt neurons to the strength of this internuclear inhibition, we obtained whole-cell recordings of unitary inhibitory postsynaptic currents (IPSCs) evoked in ventrobasal thalamocortical (VB) neurons by stimulation of single nRt cells in rat thalamic slices, in conjunction with intracellular biocytin labeling. Two types of monosynaptic IPSCs could be distinguished. “Weak” inhibitory connections were characterized by a significant number of postsynaptic failures in response to presynaptic nRt action potentials and relatively small IPSCs. In contrast, “strong” inhibition was characterized by the absence of postsynaptic failures and significantly larger unitary IPSCs. By using miniature IPSC amplitudes to infer quantal size, we estimated that unitary IPSCs associated with weak inhibition resulted from activation of 1–3 release sites, whereas stronger inhibition would require simultaneous activation of 5–70 release sites. The inhibitory strengths were positively correlated with the density of axonal swellings of the presynaptic nRt neurons, an indicator that characterizes different nRt axonal arborization patterns. These results demonstrate that there is a heterogeneity of inhibitory interactions between nRt and VB neurons, and that variations in gross morphological features of axonal arbors in the central nervous system can be associated with significant differences in postsynaptic response characteristics.
Intrathalamic rhythmic activities that are prominent in sleep and certain pathophysiological conditions (reviewed in ref. 1) are a consequence of both the intrinsic properties of thalamic neurons and the reciprocal synaptic connectivity between excitatory cells in thalamic relay nuclei and inhibitory neurons in the thalamic reticular nucleus (nRt) (or analogous perigeniculate nucleus) (2–5). Most thalamic neurons are capable of firing action potentials in robust phasic bursts that are key elements in rhythm generation. Burst behavior, in turn, depends on the presence of a low-threshold transient Ca2+ current (6, 7) that is inactivated at resting membrane potentials and deinactivated by inhibitory postsynaptic potentials that hyperpolarize the involved neurons (2, 3, 8). The γ-aminobutyric acid (GABA)-ergic inhibitory innervation onto thalamocortical relay neurons from nRt (3, 9–13) thus forms a key element in the generation of oscillatory activities.
In this scheme of thalamic operation, it becomes critical to define the factors that regulate the inhibitory drive from nRt neurons onto relay cells. The spatial ramification of the nRt cells’ axonal arbors and the density of putative release sites will be factors that determine the intensity of inhibition in relay neurons. Axonal arborizations of nRt cells within the ventrobasal thalamus (VB) are anatomically heterogeneous, ranging from spatially diffuse structures with low densities of axonal swellings (presumed synaptic contacts) to those that are focal and have much higher densities of swellings (14–17). To test the range of inhibitory influences of single nRt neurons upon relay neurons, we obtained simultaneous whole-cell recordings from synaptically coupled nRt and VB neurons. Our results indicate that there is a heterogeneity of inhibitory interactions between nRt and VB cells. nRt contains subgroups of neurons with different axonal arborization patterns that give rise to functionally distinct forms of inhibitory activity.
MATERIALS AND METHODS
Rat thalamic slices were prepared as previously described (18). Young Sprague–Dawley rats were deeply anesthetized with pentobarbital sodium (55 mg/kg), decapitated, and the brains quickly removed and placed in cold, oxygenated slicing solution containing 2.5 mM KCl/1.25 mM NaH2PO4/10.0 mM MgCl2/0.5 mM CaCl2/26.0 mM NaHCO3/11.0 mM glucose/234.0 mM sucrose. Slices (300 μm) were cut in the horizontal plane with a vibratome and placed in a holding chamber (30°C) for >2 hr prior to recording. Individual slices were transferred to a submersion-type recording chamber maintained at room temperature (23°C) and continuously perfused with oxygenated physiological solution containing 126.0 mM NaCl/2.5 mM KCl/1.25 mM NaH2PO4/2.0 mM MgCl2/2.0 mM CaCl2/26.0 mM NaHCO3/10.0 mM glucose, pH 7.4.
Whole-cell recordings were obtained from neurons visualized within the slices (19, 20). A low-power (2.5×) objective was used to identify the thalamic nuclei, and high-power water-immersion objectives (40×, 63×) with Nomarski optics and infrared video were used to visualize individual neurons. The intracellular solution for nRt neuronal recordings contained 117.0 mM K-gluconate/11.0 mM KCl/1.0 mM MgCl2/1.0 mM CaCl2/11.0 mM EGTA/10.0 mM Hepes/0.5% biocytin. The solution for VB recordings was similar except that Cs-gluconate and CsCl were substituted for K-gluconate and KCl, respectively. Inclusion of Cs+ in the recording pipette blocked the late GABAB receptor-mediated inhibitory postsynaptic current (IPSC) (21). Miniature IPSCs (mIPSCs) were recorded with Cs+-containing pipettes and in the presence of 1 μM tetrodotoxin. The solutions were adjusted to a final pH of 7.3 and osmolality of 280 mosmol.
An Axoclamp 2A amplifier (Axon Instruments, Foster City, CA) was used in continuous single-electrode voltage-clamp mode for current recordings (VB neurons) and bridge mode for voltage recordings (nRt neurons). The access resistance during the voltage-clamp recordings was monitored throughout the experiment and never exceeded 15 MΩ. A liquid junction potential of 10 mV was subtracted off-line. Synaptic responses were temporally aligned using the peak of the action potential in the nRt neuron (Fig. 1A). The onset latency of the IPSCs was determined from the average response. In the majority of pairs (6/8), the IPSC conductance of the VB neuron was calculated from the slope of the current/membrane potential relationship over a voltage range of −70 to −10 mV. For the two remaining neurons, the conductance was calculated using the average reversal potential of the IPSC.
Figure 1.
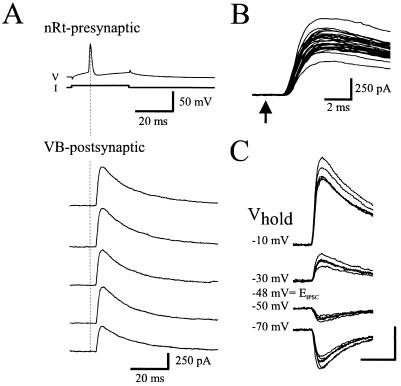
Unitary IPSCs recorded from the VB neuron of a synaptically connected pair of nRt and VB cells. (A) Single action potentials from a presynaptic nRt neuron (nRt-presynaptic, V) evoked by intracellular depolarizing current pulses (I) elicit unitary IPSCs in the postsynaptic VB neuron (VB-postsynaptic). Dotted line marks the peak of action potential in presynaptic neuron. (B) Expanded traces of 35 responses that illustrate the constant IPSC onset latency of 1.5 ms. Arrow, presynaptic action potential peak. (C) Five consecutive responses are superimposed at each indicated holding potential. Reversal potential of the evoked IPSC was −48 mV. Calculated ECl = −55 mV. Calibration: 250 pA, 10 ms.
Following recordings, slices were removed from the chamber and fixed overnight in 4% paraformaldehyde and 0.5% glutaraldehyde in 0.1 M phosphate buffer. Slices were freeze-thawed three times, resectioned at 75–100 μM on a vibratome, and processed for biocytin as previously described (17), except that Triton X-100 was omitted and a cobalt–nickel intensification of the reaction product was used. Slices were embedded in Durcapan resin (Fluka), and following polymerization the cells were analyzed at the light-microscopic level. Camera-lucida reconstructions of the labeled neurons were made using either a 50× water-immersion or 100× oil-immersion objective. The density of axonal swellings was determined by counting the number of swellings in a series of 30 μM × 30 μM grids extending across the entire axonal arborization (17).
RESULTS
Paired intracellular recordings from nRt and VB neurons were used to unambiguously identify unitary IPSCs in slices of rat somatosensory thalamus maintained in vitro. A total of 98 dual nRt-VB recordings were obtained, and unitary IPSCs were evoked by nRt APs in 8 of these. In these pairs, single APs evoked in presynaptic nRt neurons by short-duration depolarizing current pulses (100–300 pA, 10–50 ms) elicited monosynaptic IPSCs in the VB neurons (Fig. 1A). The average IPSC amplitude across the eight pairs was highly variable ranging from 18.5 to 514.0 pA. Under our recording conditions, these IPSCs contained only GABAA receptor-mediated components (see Materials and Methods). Latency from presynaptic spike to IPSC onset was fixed for a given pair, suggesting a monosynaptic connection (Fig. 1B), whereas across pairs the average IPSC latency ranged from 1.5 to 3.1 ms. There was no relationship between the latency in a given pair and the somatic area or extent of arborization of the presynaptic nRt neuron. To determine whether larger-amplitude IPSCs may have been due to activation of more proximal synapses, we also measured other IPSC attributes such as rise time, decay time constant, and reversal potential. The 10–90% rise time of the IPSCs ranged from 1.5 to 5.1 ms, and decays could be well fitted by single- or double-exponential functions. The average IPSC reversal potential (−54.2 ± 7.1 mV; n = 6; e.g., Fig. 1C) was near the calculated chloride equilibrium potential of −58 mV under these recording conditions. IPSC amplitude was not correlated with rise time, decay time constant, or reversal potential, suggesting that IPSC variance across pairs was not due solely to different sites of origin along the somatic-dendritic membrane.
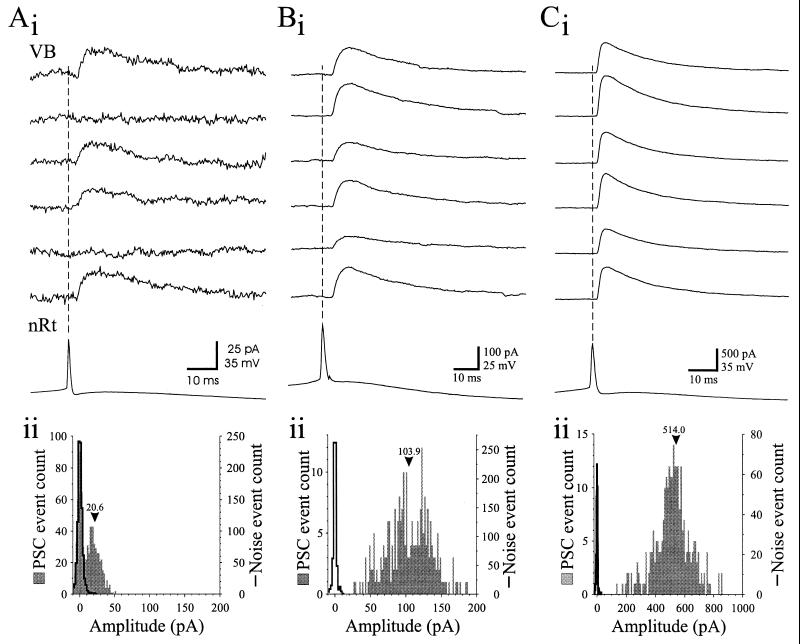
There were large differences in synaptic failure rate among paired recordings. In three of the eight pairs, postsynaptic failures occurred in a significant percent of trials (43.5, 71.5, and 74.5%). For example, in the pair illustrated in Fig. 2A, single nRt APs failed to evoke a postsynaptic response in 43.5% (350/804) of trials (e.g., second and fifth traces of Fig. 2A, i). The amplitude distribution of unitary postsynaptic responses in such pairs (Fig. 2A, ii, shaded bars) typically consisted of two peaks: the smaller overlapped with the noise measurements (Fig. 2A, ii, solid), indicative of postsynaptic failures; the second peak corresponded to the small, evoked IPSC that had an average amplitude of 20.6 ± 9.6 pA (n = 454; Fig. 2A, ii, shaded bars). The peak of the unitary IPSC averaged 22.1 ± 4.6 pA in the failure pairs (n = 3), and the mean IPSC conductance was 0.46 ± 0.14 nS (range 0.35–0.61 nS).
Figure 2.
Postsynaptic failure rate and IPSC amplitude vary among different nRt-VB pairs. (A, i) Recordings from a pair of neurons in which postsynaptic failures occurred. Single nRt APs evoked small amplitude IPSCs but could also result in postsynaptic failures (traces 2 and 5). (ii) Distribution of postsynaptic current (PSC) peak amplitudes (shaded bars) and noise (solid line) for 804 trials. The PSC distribution consists of two peaks; the first overlaps with the noise and indicates failures, and the second peak corresponds to evoked IPSCs. Bin size = 2 pA. (B, i) Recordings from a pair of neurons that lacked unitary IPSC failures in response to single nRt APs. (ii) Amplitude distribution of PSCs (shaded bars) and noise (solid line) for the neuron of B, i. Note the broad distribution and lack of overlap with the noise measurements. Bin size = 2 pA. (C, i) Recordings from a different “nonfailure” pair with a larger amplitude unitary IPSC than in the cell of B, i. Note the different calibration scales for amplitudes in A–C. Bin size = 10 pA. Vertical dashed lines in A, i; B, i; and C, i mark peaks of nRt APs. Numbers above bars in A, ii; B, ii; and C, ii are mean PSC amplitude.
By contrast, in five of eight pairs presynaptic nRt APs evoked robust IPSCs that never failed (Figs. 2 B, i and C, i). Average IPSC amplitude in the VB neuron of these five “nonfailure” pairs was large and highly variable between pairs (188.0 ± 184.9 pA, range 56.6–514.0 pA, n = 5), and the largest single response had a peak amplitude of 858 pA. The associated IPSC conductances (4.5 ± 4.6 nS: range 1.85–12.7 nS) were significantly larger than for the “failure” pairs (P < 0.05, Mann–Whitney U test), and the IPSC amplitude distributions were typically more widespread and multipeaked (Figs. 2 B, ii and C, ii). The response latency, rise time, and decay time constant did not differ significantly between the “failure” and “nonfailure” pairs.
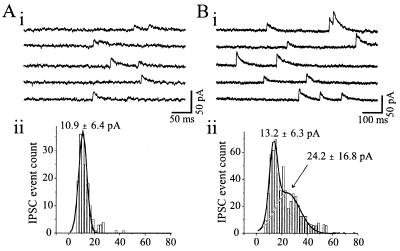
Previous studies involving paired recordings and anatomical reconstruction in hippocampus have indicated that unitary postsynaptic inhibitory responses result from activation of 2 to 17 synaptic contacts onto a single pyramidal neuron (22–24). To estimate the number of release sites required for the unitary IPSC amplitudes that we observed, mIPSCs were recorded from another group of eight VB neurons (Fig. 3). Virtually all IPSCs in VB arise from nRt innervation because this relay nucleus is virtually devoid of inhibitory interneurons in the rodent (10, 25). In six of eight cells, the amplitude distributions of the mIPSCs were unimodal and slightly skewed toward larger amplitudes but reasonably well fitted by a single Gaussian distribution (e.g., Fig. 3A, ii). The remaining two distributions were more skewed and best fitted by two Gaussians of similar integral unitary sizes (e.g., Fig. 3B, ii). The mIPSC amplitude for the first peak was quite consistent among the eight cells and averaged 12.2 ± 1.3 pA with variance of 7.1 ± 1.0 pA. Assuming that the first peak of mIPSC distribution reflects the postsynaptic action produced by a single synapse or release site, our data suggest that the unitary IPSCs observed following single nRt APs (range, 5.1 to 858 pA) result from the activation of approximately 1–70 release sites. With a mean amplitude of about 22 pA, the unitary IPSCs in “failure” pairs would result from activation of approximately two release sites (Fig. 2A), whereas the larger IPSCs associated with the “nonfailure” pairs would require synchronized activation of more than a 10-fold greater number of sites (Figs. 2 B and C).
Figure 3.
Miniature IPSCs recorded from VB neurons in presence of TTX (1 μM) and excitatory amino acid antagonists [6-cyano-7-nitroquinoxaline-2,3-dione (CNQX), 20 μM; D-3-(2-carboxypiperazine-4-yl)-1-propenyl-1-phosphonic acid (d-CPPene), 10 μM]. (A, i and B, i) mIPSCs recorded in five continuous segments from two different VB neurons. (A, ii) The amplitude distribution of mIPSCs for the cell of A, i is slightly skewed and is fitted by a single Gaussian distribution (solid line) with a mean and variance of 10.9 ± 6.4 pA. (B, ii) The amplitude distribution of mIPSCs for the neuron of B, i is more skewed than A, ii, and is better fit by two Gaussians of similar integral unitary size (solid line). The means and variance of these two Gaussians are 13.2 ± 6.3 and 24.2 ± 16.8 pA.
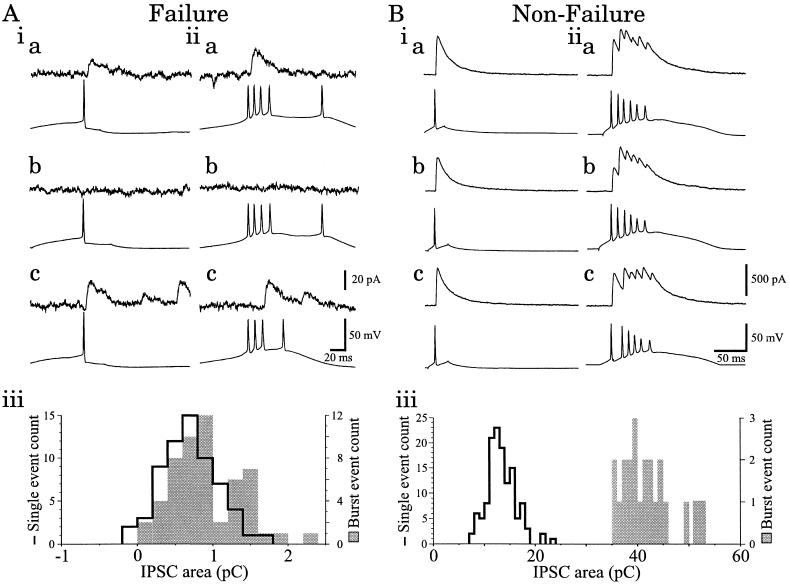
Because the burst-firing pattern of VB and nRt neurons is critical for generating intrathalamic rhythms (2, 3, 7, 8, 26), we were interested in examining the effects of single spikes versus burst discharges in nRt neurons on the resulting unitary GABAA receptor-mediated IPSC. As discussed above, single presynaptic APs evoked small IPSCs and frequent failures in some neurons (Fig. 4A, i). In such pairs, IPSCs that followed AP bursts in the presynaptic nRt neuron had amplitudes and durations similar to those of IPSCs evoked by single APs (c.f. Fig. 4A, i, b and c vs. ii, b and c). Although bursts of multiple presynaptic APs could still fail to evoke IPSCs (Fig. 4A, ii, b), the failure rate was decreased (e.g., there were 14% failures following bursts versus 42% following single presynaptic APs in the pair of Fig. 3A. The IPSCs evoked by a nRt AP burst usually consisted of a single peak and could occur in response to any of the individual APs within the burst (Fig. 4A, ii, a and c). Comparisons of the IPSC charge (integrated area) of successful responses in pairs with failures indicated that there was little difference between IPSCs evoked in the VB neuron by single spikes versus bursts of APs in the presynaptic cell (Fig. 4A, iii).
Figure 4.
Effects of presynaptic firing mode upon unitary IPSCs. (A) A pair with high incidence of failures. (i) Range of IPSCs, including failures (Upper), evoked by single presynaptic nRt action potential (Lower). (ii) Upon membrane hyperpolarization, the nRt neuron generates bursts of action potentials in response to an intracellular current pulse. (b) Illustrates a response failure. (a and c) Single-peaked IPSCs are evoked by first (a) or third (c) spikes of the presynaptic volley, but other presynaptic spikes fail to elicit responses. Late IPSCs in i, c and ii, c are spontaneous events. (iii) Distribution of the integrated area (charge) of IPSCs evoked by single nRt APs (solid line) and nRt burst discharges (shaded bars). Bin size = 0.2 pC. (B) Recordings obtained from a “nonfailure” pair. (i) IPSCs (Upper) evoked by single nRt APs (Lower) are larger than those of A, i. (ii) Burst discharge from nRt neuron evokes multipeaked IPSCs. The individual peaks correspond to each presynaptic AP. (iii) Distribution of IPSC charge reveals that the burst-evoked response (shaded bars) is more than 3-fold greater than the single-spike evoked response (solid line). Bin size = 1 pC.
As shown above (Fig. 2 B and C), in the “nonfailure” pairs, single nRt APs evoked larger amplitude IPSCs (Fig. 4B, i). In such pairs, burst discharge in the presynaptic nRt neuron gave rise to IPSCs containing multiple peaks of overlapping IPSCs, each corresponding to a single presynaptic AP (Fig. 4B, ii). Individual IPSC peaks within burst-triggered events were almost always smaller for secondary compared with primary presynaptic spikes, suggesting a rapid use-dependent depression. In spite of this, the nRt AP bursts produced an average 270% increase in the IPSC charge over that following single spikes (Fig. 4B, iii; n = 3). By contrast, IPSC charge in the “failure” pairs was not influenced by the firing mode of the nRt neuron; the charge of burst-generated IPSCs was 90% of that evoked by single spikes (n = 3; compare Fig. 4A, iii with B, iii). Thus, the presynaptic firing mode had a robust influence on the magnitude of inhibition, but only in strongly coupled pairs.
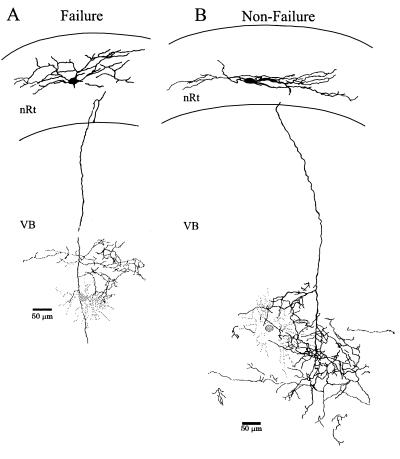
We have previously shown that nRt neurons give rise to distinct axonal arborization patterns ranging from a multibranched, complex, clustered structure containing a high density of axonal swellings (“cluster” or “intermediate” type), to a “diffuse” branching pattern with significantly fewer axonal swellings (17). The average density of axonal swellings differed among the three different types of arborizations (17). Individual biocytin-filled nRt neurons were recovered in six of eight pairs, and in three pairs both nRt and VB cells were recovered (e.g., Fig. 5). The arborizations of nRt neurons associated with the “nonfailure” pairs had a complex axonal branching pattern similar to the intermediate or cluster-type arbor (Fig. 5B; n = 4). In contrast, the nRt neurons associated with “failure” pairs had less branching and simpler arborizations, similar to the diffuse projection type (Fig. 5A; n = 2). Because the density of axonal swellings (presumed boutons) is correlated with arborization type (17), we determined the densities of swellings in four well labeled nRt neurons. The average density in two “nonfailure” nRt neurons was 15.7 (neuron in Fig. 5B) and 16.2 swellings/900 μM2, similar to the mean density of the intermediate axonal arborization (15.7 swellings/900 μM2) (17). In contrast, the average densities in the two nRt neurons that produced postsynaptic failures were 4.8 (neuron in Fig. 5A) and 11.3 swellings/900 μM2, values consistent with those described for diffuse arborizations (8.7 swellings/900 μM2) (17).
Figure 5.
Camera-lucida reconstructions of biocytin-filled neurons in nRt and VB. (A) Reconstruction of nRt (black) and VB neuron (gray) in which postsynaptic failures occurred. Electrophysiological responses of this pair are illustrated in Fig. 2A, i. (B) This nonfailure-type pair has increased density of the nRt axonal branching compared with A. The shaded circle marks the location of the incompletely recovered VB neuron soma. Physiological responses of this pair are illustrated in Fig. 2C.
DISCUSSION
This study investigated the inhibitory influence of individual nRt neurons upon somatosensory thalamic relay neurons. These data indicate that nRt neurons mediate at least two distinct types of inhibitory response distinguishable by the rate of successful transmission and magnitude of the unitary postsynaptic current. One group of presynaptic cells with diffuse axonal arbors fails to faithfully produce an IPSC for every presynaptic AP, whereas in nRt neurons with more compact arbors each AP evokes an IPSC. In addition, these “failure” and “nonfailure” groups are associated with small and large amplitude unitary IPSCs, respectively. Furthermore, presynaptic bursts increase IPSC magnitude in nonfailure pairs but produce no change in IPSC magnitude for failure-type connections. Results are based on a relatively small number of synaptically coupled pairs, and it is possible that intermediate forms of unitary responses will be found in future experiments. Nonetheless, the association of these four variables in particular pairs occurred without exception, making it likely that the results are due to the existence of functional subclasses of nRt neurons rather than an experimental artifact such as differences due to the slice procedure itself.
One possible explanation for the differences in IPSC amplitudes and failure rates between these two groups of nRt neurons is variations in the number of synaptic contacts. Assuming that transmitter release conforms to binomial statistics, that individual synapses release one quantum, and that the mIPSC amplitudes (i.e., 12 pA) are indicative of the postsynaptic effects of single quanta (q), we have estimated the release probability (P) and number of quanta (n) required to produce IPSC amplitude distributions similar to those obtained experimentally. To account for the failure rates and amplitudes observed in the three “failure”-type neurons (43.5, 71.5, and 74.5%), P would have to be low (0.05–0.2) and n (i.e., number of contacts) would range from 5 to 10.* If all axon terminals of nRt neurons have a similar low release probability, approximately 25–450 synaptic contacts onto each postsynaptic cell would be required to account for the larger IPSC amplitudes observed in “nonfailure” pairs. Further, we have likely underestimated the number of contacts required because our calculations do not take nonlinear summation into account (27, 28). An alternative explanation for this large difference in amplitude of unitary IPSCs in “failure” versus “nonfailure” pairs might be that the release probability in denser axonal terminal arbors (i.e., nonfailure pairs) is greater than in diffuse arbors (i.e., failure pairs). Additional neuroanatomic data on the numbers of synapses made onto VB neurons by single nRt cells will help resolve this issue.
In the hippocampus, a single presynaptic inhibitory neuron, through its divergent output, produces similar inhibitory postsynaptic potentials in multiple nearby postsynaptic cells (29). If this type of divergence is also present within thalamus, the “nonfailure” neurons, whose inhibitory output is significantly increased during burst firing (Fig. 4B), would generate a focal region of powerful inhibition in VB that could be important in initiating or perpetuating oscillatory activity. This robust output should occur during periods of rhythmic activity such as during sleep spindles when the thalamic neurons are in a burst-discharge mode (2, 30–32). This conjecture is partially supported by the demonstration that burst discharge in a single GABAergic perigeniculate neuron of a thalamic slice can initiate rhythmic spindle activity in the network (33). During nonsleep periods, nRt neurons with strong postsynaptic inhibitory effects may be influential in shaping receptive fields of VB relay cells (34) and providing the proper priming actions on these neurons (membrane hyperpolarization) to induce burst discharge in the awake animal (35).
By contrast, the function of the weaker inhibitory innervation that produces much smaller IPSCs may be to sculpt the shape of nearby excitatory potentials on the dendritic tree, thus serving an important role in synaptic integration (e.g., refs. 24 and 36). The “failure” type of coupling we observed (e.g., Fig. 2A) contrasts with that reported in other structures where activation of presynaptic inhibitory neurons rarely produces postsynaptic failures (37, 38).
We speculate that the differences in postsynaptic efficacy of nRt neurons with different axonal arbors shown here could have important implications for operation of circuits in many parts of the brain. For example, individual central nervous system neurons, such as cortical interneurons (39–42) and thalamic cells (16, 43) have both dense and diffuse regions of axonal arborization. Assuming that the entire arbor is invaded by an action potential, our data imply that such anatomic arrangements could allow a presynaptic neuron to give rise to significantly different outputs onto two (or more) sets of targets, depending on both the pattern of axonal ramification and, perhaps, the physiological properties of individual axon terminals.
Acknowledgments
We thank I. Parada for assistance in preparing and analyzing biocytin-filled thalamic neurons and B. D. Bennett for his comments on the manuscript. This work was supported by National Institutes of Health Grants NS06477 and NS07280 and the Pimley Research Fund.
ABBREVIATIONS
- GABA
γ-aminobutyric acid
- nRt
thalamic reticular nucleus
- VB
ventrobasal thalamus
- IPSC
inhibitory postsynaptic current
- AP
action potential
- mIPSC
miniature IPSC
Footnotes
According to binomial theory, the probability of failure (P0 or Pfailure) is equal to (1 − p)n. For example, with Pfailure of 72%, p would be equal to 0.28, 0.15, and 0.06 for n = 1, 2, and 5, respectively. Given the range of observed evoked IPSC amplitudes, n must be at least 4 or 5 (e.g., see Fig. 2a, ii), and p must be low, approximately 6%.
References
- 1.Steriade M, McCormick D A, Sejnowski T J. Science. 1993;262:679–685. doi: 10.1126/science.8235588. [DOI] [PubMed] [Google Scholar]
- 2.von Krosigk M, Bal T, McCormick D A. Science. 1993;261:361–364. doi: 10.1126/science.8392750. [DOI] [PubMed] [Google Scholar]
- 3.Huguenard J R, Prince D A. J Neurosci. 1994;14:5485–5502. doi: 10.1523/JNEUROSCI.14-09-05485.1994. [DOI] [PMC free article] [PubMed] [Google Scholar]
- 4.Warren R A, Agmon A, Jones E G. J Neurophysiol. 1994;72:1993–2003. doi: 10.1152/jn.1994.72.4.1993. [DOI] [PubMed] [Google Scholar]
- 5.Steriade M, Deschênes M, Domich L, Mulle C. J Neurophysiol. 1985;54:1473–1497. doi: 10.1152/jn.1985.54.6.1473. [DOI] [PubMed] [Google Scholar]
- 6.Deschênes M, Paradis M, Roy J P, Steriade M. J Neurophysiol. 1984;51:1196–1219. doi: 10.1152/jn.1984.51.6.1196. [DOI] [PubMed] [Google Scholar]
- 7.Jahnsen H, Llinás R. J Physiol (London) 1984;349:227–247. doi: 10.1113/jphysiol.1984.sp015154. [DOI] [PMC free article] [PubMed] [Google Scholar]
- 8.Steriade M, Deschênes M. Brain Res Rev. 1984;8:1–63. doi: 10.1016/0165-0173(84)90017-1. [DOI] [PubMed] [Google Scholar]
- 9.Houser C R, Vaughn J E, Barber R P, Roberts E. Brain Res. 1980;200:341–354. doi: 10.1016/0006-8993(80)90925-7. [DOI] [PubMed] [Google Scholar]
- 10.Jones E G. The Thalamus. New York: Plenum; 1985. [Google Scholar]
- 11.Hirsch J C, Burnod J. Neurosci. 1987;23:457–468. doi: 10.1016/0306-4522(87)90069-8. [DOI] [PubMed] [Google Scholar]
- 12.Crunelli V, Haby M, Jassik-Gerschenfeld D, Leresche N, Pirchio M. J Physiol (London) 1988;399:153–176. doi: 10.1113/jphysiol.1988.sp017073. [DOI] [PMC free article] [PubMed] [Google Scholar]
- 13.Thomson A M. Neurosci. 1988;25:491–502. doi: 10.1016/0306-4522(88)90253-9. [DOI] [PubMed] [Google Scholar]
- 14.Scheibel M E, Scheibel A B. Brain Res. 1966;1:43–62. doi: 10.1016/0006-8993(66)90104-1. [DOI] [PubMed] [Google Scholar]
- 15.Yen C T, Conley M, Hendry S H C, Jones E G. J Neurosci. 1985;5:2254–2268. doi: 10.1523/JNEUROSCI.05-08-02254.1985. [DOI] [PMC free article] [PubMed] [Google Scholar]
- 16.Pinault D, Bourassa J, Deschênes M. Eur J Neurosci. 1995;7:31–40. doi: 10.1111/j.1460-9568.1995.tb01017.x. [DOI] [PubMed] [Google Scholar]
- 17.Cox C L, Huguenard J R, Prince D A. J Comp Neurol. 1996;366:416–430. doi: 10.1002/(SICI)1096-9861(19960311)366:3<416::AID-CNE4>3.0.CO;2-7. [DOI] [PubMed] [Google Scholar]
- 18.Cox C L, Huguenard J R, Prince D A. J Neurophysiol. 1995;74:990–1000. doi: 10.1152/jn.1995.74.3.990. [DOI] [PubMed] [Google Scholar]
- 19.Edwards F A, Konnerth A, Sakmann B, Takahashi T. Pflügers Arch. 1989;414:600–612. doi: 10.1007/BF00580998. [DOI] [PubMed] [Google Scholar]
- 20.Stuart G J, Dodt H U, Sakmann B. Eur J Physiol. 1993;423:511–518. doi: 10.1007/BF00374949. [DOI] [PubMed] [Google Scholar]
- 21.Okada T, Horiguchi H, Tachibana M. Neurosci Res. 1995;23:297–303. doi: 10.1016/0168-0102(95)00955-8. [DOI] [PubMed] [Google Scholar]
- 22.Buhl E H, Halasy K, Somogyi P. Nature (London) 1994;368:823–828. doi: 10.1038/368823a0. [DOI] [PubMed] [Google Scholar]
- 23.Buhl E H, Cobb S R, Halasy K, Somogyi P. Eur J Neurosci. 1995;7:1989–2004. doi: 10.1111/j.1460-9568.1995.tb00721.x. [DOI] [PubMed] [Google Scholar]
- 24.Miles R, Tóth K, Gulyás A I, Hájos N, Freund T F. Neuron. 1996;16:815–823. doi: 10.1016/s0896-6273(00)80101-4. [DOI] [PubMed] [Google Scholar]
- 25.Harris R M, Hendrickson A E. Neuroscience. 1987;21:229–236. doi: 10.1016/0306-4522(87)90335-6. [DOI] [PubMed] [Google Scholar]
- 26.Steriade M, Llinás R. Physiol Rev. 1988;68:649–742. doi: 10.1152/physrev.1988.68.3.649. [DOI] [PubMed] [Google Scholar]
- 27.Martin A R. Physiol Rev. 1966;46:51–66. [Google Scholar]
- 28.Otis T S, Wu Y C, Trussell L O. J Neurosci. 1996;16:1634–1644. doi: 10.1523/JNEUROSCI.16-05-01634.1996. [DOI] [PMC free article] [PubMed] [Google Scholar]
- 29.Miles R. J Physiol (London) 1990;431:659–676. doi: 10.1113/jphysiol.1990.sp018353. [DOI] [PMC free article] [PubMed] [Google Scholar]
- 30.Bal T, von Krosigk M, McCormick D A. J Physiol (London) 1995;483:641–663. doi: 10.1113/jphysiol.1995.sp020612. [DOI] [PMC free article] [PubMed] [Google Scholar]
- 31.Cox C L, Huguenard J R, Prince D A. J Neurosci. 1997;17:70–82. doi: 10.1523/JNEUROSCI.17-01-00070.1997. [DOI] [PMC free article] [PubMed] [Google Scholar]
- 32.Steriade M, Domich L, Oakson G. J Neurosci. 1986;6:68–81. doi: 10.1523/JNEUROSCI.06-01-00068.1986. [DOI] [PMC free article] [PubMed] [Google Scholar]
- 33.Kim U, Bal T, McCormick D A. J Neurophysiol. 1995;74:1301–1323. doi: 10.1152/jn.1995.74.3.1301. [DOI] [PubMed] [Google Scholar]
- 34.Lee S M, Friedberg M H, Ebner F F. J Neurophysiol. 1994;71:1702–1715. doi: 10.1152/jn.1994.71.5.1702. [DOI] [PubMed] [Google Scholar]
- 35.Guido W, Weyand T. J Neurophysiol. 1995;74:1782–1786. doi: 10.1152/jn.1995.74.4.1782. [DOI] [PubMed] [Google Scholar]
- 36.Llinás R, Nicholson C. J Neurophysiol. 1971;34:532–551. doi: 10.1152/jn.1971.34.4.532. [DOI] [PubMed] [Google Scholar]
- 37.Miles R, Wong R K S. J Physiol (London) 1984;356:97–113. doi: 10.1113/jphysiol.1984.sp015455. [DOI] [PMC free article] [PubMed] [Google Scholar]
- 38.Deuchars J, Thomson A M. Neuroscience. 1995;65:935–942. doi: 10.1016/0306-4522(95)00020-j. [DOI] [PubMed] [Google Scholar]
- 39.Somogyi P, Kisvárday Z F, Martin K A C, Whitteridge D. Neuroscience. 1983;10:261–294. doi: 10.1016/0306-4522(83)90133-1. [DOI] [PubMed] [Google Scholar]
- 40.Gulyás A I, Miles R, Sik A, Tóth K, Tamamaki N, Freund T F. Nature (London) 1993;366:683–687. doi: 10.1038/366683a0. [DOI] [PubMed] [Google Scholar]
- 41.Kawaguchi Y. J Neurosci. 1995;15:2638–2655. doi: 10.1523/JNEUROSCI.15-04-02638.1995. [DOI] [PMC free article] [PubMed] [Google Scholar]
- 42.Kawaguchi Y, Kubota Y. J Neurosci. 1996;16:2701–2715. doi: 10.1523/JNEUROSCI.16-08-02701.1996. [DOI] [PMC free article] [PubMed] [Google Scholar]
- 43.Uhlrich D J, Cucchiaro J B, Humphrey A L, Sherman S M. J Neurophysiol. 1991;65:1528–1541. doi: 10.1152/jn.1991.65.6.1528. [DOI] [PubMed] [Google Scholar]


