Abstract
The major gibberellin (GA) controlling stem elongation in pea (Pisum sativum L.) is GA1, which is formed from GA20 by 3β-hydroxylation. This step, which limits GA1 biosynthesis in pea, is controlled by the Le locus, one of the original Mendelian loci. Mutations in this locus result in dwarfism. We have isolated cDNAs encoding a GA 3β-hydroxylase from lines of pea carrying the Le, le, le-3, and led alleles. The cDNA sequences from le and le-3 each contain a base substitution resulting in single amino acid changes relative to the sequence from Le. The cDNA sequence from led, a mutant derived from an le line, contains both the le “mutation” and a single-base deletion, which causes a shift in reading frame and presumably a null mutation. cDNAs from each line were expressed in Escherichia coli. The expression product for the clone from Le converted GA9 to GA4, and GA20 to GA1, with Km values of 1.5 μM and 13 μM, respectively. The amino acid substitution in the clone from le increased Km for GA9 100-fold and reduced conversion of GA20 to almost nil. Expression products from le and le-3 possessed similar levels of 3β-hydroxylase activity, and the expression product from led was inactive. Our results suggest that the 3β-hydroxylase cDNA is encoded by Le. Le transcript is expressed in roots, shoots, and cotyledons of germinating pea seedlings, in internodes and leaves of established seedlings, and in developing seeds.
Keywords: 2-oxoglutarate-dependent dioxygenase, gibberellin 3β-hydroxylase, Pisum
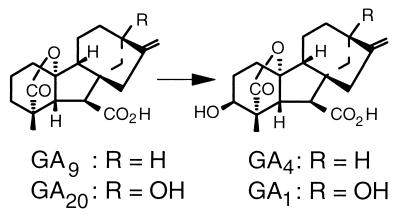
In his experiments on plant hybridization, Gregor Mendel (1) examined seven pairs of traits in pea. One of these traits was “difference in the length of the stem,” and Mendel demonstrated the dominance of tall over dwarf. White (2) noted that this pair of alleles represented “the presence and absence of a factor for tallness” and introduced the gene symbol Le (length). The factor for tallness in peas was first associated with gibberellins (GAs) by Brian and Hemming (3), who stimulated stem elongation in dwarf peas by applying GA3 to the seedlings. Brian (4) proposed that tall peas normally produce a similar, endogenous substance. Subsequently, GA-like substances were detected in pea shoots by bioassay (5), and identity was confirmed by GC-MS (6). In GA biosynthesis, the biologically active compounds GA1 and GA4 are formed from GA20 and GA9, respectively, by 3β-hydroxylation (Fig. 1) (7–11). The connection between Le and the conversion of GA20 to GA1 was established by Ingram et al. (7), who showed that radiolabeled GA20 was converted to GA1 in Le plants (tall), and that this conversion was greatly reduced in le (dwarf). In addition, the content of endogenous GA1 in shoots was much greater in Le than in le, where GA20 content was highly elevated (12, 13). It is, therefore, generally assumed that Le encodes a GA 3β-hydroxylase (14), the activity of which is impaired in le plants.
Figure 1.
GA 3β-hydroxylation.
Recently, several genes encoding GA-biosynthetic enzymes have been cloned, including a GA 3β-hydroxylase from arabidopsis (Arabidopsis thaliana) (15) and the related enzyme GA 20-oxidase from several species (16–22). We report here the isolation of a GA 3β-hydroxylase cDNA using PCR and provide evidence to show that it is encoded by the Le locus of pea.
MATERIALS AND METHODS
Plant Material.
Seedlings of pea (Pisum sativum L.) were grown as described previously (19). Pea lines (genotype) used in this study were B686–67-(3) (naLe) and I3 (NaLe; a selection of ‘Alaska’) from the late G. A. Marx (New York Agricultural Experiment Station, Geneva, NY); line 58 (Nale) from I. C. Murfet (Department of Plant Science, Univ. of Tasmania, Hobart, Australia); NGB 105839 (le-3; ref. 23) from the Nordic Gene Bank (Alnarp, Sweden); and JI 3013/Gottschalk’s line M66A (led) from Michael Ambrose (John Innes Centre, Norwich, U.K.).
Reverse Transcription–PCR.
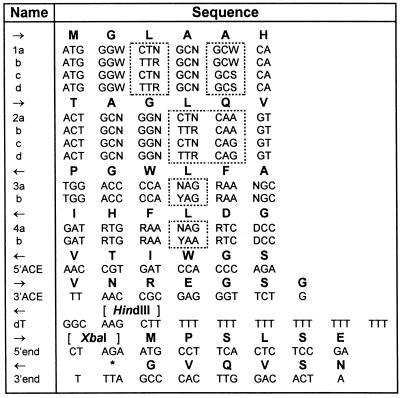
By examining regions that are conserved within groups of dioxygenases, we were able to infer which regions of the arabidopsis GA 3β-hydroxylase sequence (15) might also be conserved. The design of redundant primers for PCR (Table 1) was based on these regions and on the conserved residues of 2-oxoglutarate-dependent dioxygenases (24). Poly(A)+ RNA was isolated from plant samples using PolyATtract System 1000 (Promega) with 2.5 ml streptavidin-paramagnetic particles and 200 pmol biotinylated oligo(dT) (Ransom Hill Bioscience, Ramona, CA) per 0.8 g tissue. RNA was reverse transcribed at 45°C with SuperScript II Reverse Transcriptase (BRL) using the dT primer, and cDNA was stored at −75°C between uses. All PCRs included 5 μl 10× buffer (with 15 mM MgCl2; supplied with enzyme), 0.2 μl Taq polymerase (5 units/μl; Promega), and 1 μl dNTPs (each 10 mM; Promega) in a reaction volume of 50 μl. All primer stocks were 50 μM.
Table 1.
Primers used in the PCR experiments
Peptide sequences are shown in bold above nucleotide sequences. Arrows indicate forward/reverse primers. Significant differences within a primer group are boxed. Redundancies are in standerd IUPAC code: D = A,G,T; N = AGCT; R = AG; S = GC; W = AT; Y = CT.
Nested PCR.
The first reaction of nested PCR experiments included 1 μl reverse transcription reaction as template and 2 μM forward and reverse primers. Cycle parameters: denature 5 min at 94°C; 5×, denature 30 s at 94°C, anneal 3 min at 50°C, extend 1 min at 72°C; 35×, denature 30 s at 94°C, anneal 30 s at 50°C, extend 1 min at 72°C; extend 10 min at 72°C; soak 4°C. Ten microliters first-reaction products were separated on a mini-gel, 2% NuSieve GTG agarose in 1× TBE buffer, for 3.5 h at 50 V. To minimize interference by EDTA in subsequent reactions, gels were stained and destained 30 min and 10 min, respectively, in ca. 10 volumes of water. Gel was excised from the region of the anticipated product, chopped into small pieces, and eluted in water overnight at 4°C. The second reaction of nested PCR included 0.2 μl eluate as template and 2 μM forward and reverse primers. Cycle parameters: denature 5 min at 94°C; 40×, denature 30 s at 94°C, anneal 30 s at 50°C, extend 1 min at 72°C; extend 10 min at 72°C; soak 4°C.
PCR of 3′ end of cDNA.
In addition to components listed above, PCR included 0.5 μl reverse transcription reaction as template and 0.5 μl each 3′ ACE and dT primers. Cycle parameters: denature 5 min at 94°C; 40×, denature 30 s at 94°C, anneal 30 s at 60°C, extend 1 min at 72°C; extend 10 min at 72°C; soak 4°C.
PCR of 5′ end of cDNA (modification of ref. 25).
Reverse transcription was performed as described above, substituting 3′ end primer for dT primer. Excess primer was removed from reverse transcription reaction prior to poly(A)-tailing. Sample was diluted to 500 μl with 10 mM Tris, pH 8, and concentrated on a Microcon-100 microconcentration unit (Amicon) three times according to the manufacturer’s instructions. This reduced the concentration of filterable components 5,000- to 10,000-fold. Final volume was 12 μl. Sample was poly(A)-tailed with 0.5 μl terminal transferase (20 units/μL; BRL), 4 μl 5× reaction buffer (supplied with enzyme), 0.4 μl dATP (10 mM; Sigma) in 20 μl volume, 5 min at 37°C. Reaction was stopped by heating 15 min at 70°C. Tailed cDNA was amplified by PCR. In addition to components listed above, PCR included 1 μl tailed products as template and 0.5 μl each of 5′ ACE and dT primers. Cycle parameters: denature 5 min at 94°C; 40×, denature 30 s at 94°C, anneal 30 s at 45°C, extend 1 min at 72°C; extend 10 min at 72°C; soak 4°C.
PCR of full-length cDNAs.
In addition to components listed above, PCR included 0.5 μl reverse transcription reaction as template and 0.5 μl each 5′ end and 3′ end primers. Cycle parameters: denature 5 min at 94°C; 5×, denature 30 s at 94°C, anneal 3 min at 52°C, extend 1 min at 72°C; 35×, denature 30 s at 94°C, anneal 30 s at 62°C, extend 1 min at 72°C; extend 10 min at 72°C; soak 4°C.
Cloning of PCR Products.
Standard cloning procedures were used (26). Primary PCR products were purified on 2% NuSieve GTG agarose gels in 1× TBE before cloning. To minimize interference by EDTA in subsequent reactions, gels were stained and destained 30 min and 10 min, respectively, in ca. 10 volumes of water. Gel bands (<250 mg) were excised over longwave UV light, digested overnight with 0.5 units Gelase (Epicentre Technologies, Madison, WI), and precipitated according to the manufacturer’s instructions. Pellets were dissolved in 10 mM Tris, pH 8, cloned into Bluescript T-vector (Stratagene), and transformed in E. coli DH5α (BRL).
Full-length products were added without purification directly to ligation mix: 1 μl PCR products, 0.5 μl T-vector (100 ng/μl), 0.5 μl T4 DNA ligase (400,000 units/ml; New England Biolabs), and 2 μl 10× buffer (with 10 mM ATP, included with enzyme) in a volume of 20 μl, overnight at 16°C. Clones were sequenced and checked against sequences of partial clones for spurious mutations. The ca. 1.2-kb XbaI fragment of bona fide clones was subcloned into the NheI site of expression vector pET23a. This manipulation added 3 codons (met⋅ala⋅arg) to the beginning of the coding sequence. The beginning of selected clones was sequenced to verify insertion into proper reading frame. Purified plasmid from DH5α clones was used to transform E. coli expression hosts HMS174(DE3) or BL21(DE3) (Novagen).
Sequence Analysis.
DNA was sequenced at the Center for Gene Research and Biotechnology at Oregon State University (Corvallis) on Applied Biosystems Model 370/373A machines using dye-primer/dye-terminator chemistry. Plasmid for sequencing was prepared with QIAprep Spin Miniprep and Plasmid Mini Kits (Qiagen). Sequences were analyzed with wisconsin sequence analysis package 8 software from Genetics Computer Group, Madison. Figures of aligned sequences were produced by boxshade shareware (K. Hofman, Swiss Institute for Experimental Cancer Research, Epalings, and M. D. Baron, Institute for Animal Health, Pirbright, U.K.).
Expression in E. coli and Enzyme Assays.
Clones for expression analysis were grown on plates at 37°C for 24 h the day before culturing. Flasks (250 ml) containing 50 ml prewarmed (30°C) medium (2YT + 50 mg/L ampicillin) were inoculated with one to two large (2- to 3-mm) colonies. Cultures were grown at 30°C, 300 rpm (2 cm eccentric). Expression was induced at OD600 0.6–0.65 by addition of 0.2 ml isopropyl β-d-thiogalctoside (0.1 M), and cultures were harvested 2 to 3 h later. After cooling on ice, cells were collected by centrifugation for 5 min at 5,000 × g, 4°C, and washed twice in cold, freshly prepared buffer (100 mM Tris, pH 7.6/20 mM DTT). Cells were resuspended in 0.95 ml buffer, mixed with 50 μl lysozyme (20 mg/ml in water; Sigma), and incubated 45 min on ice. After freezing in liquid nitrogen and thawing in water at room temperature, lysates were centrifuged 30 min at 50,000 × g, 4°C, and supernatants were stored in aliquots at −75°C.
General assays for enzyme activity contained [17-14C]GA9 (170 Bq, 2.1 Tbq/mol) or [17-14C]GA20 (170 Bq, 1.84 Tbq/mol), prepared as described (22) and added in methanol (5 μl), supernatant (10 μl), cofactors (4 mM 2-oxoglutarate, 4 mM ascorbate, 4 mM DTT, 0.5 mM FeSO4, 2 mg/ml BSA, 1 mg/ml catalase), and 0.1 M Tris⋅HCl, pH 7.5, in a total volume of 0.1 ml. Samples were incubated overnight at 20°C. Products were separated by HPLC and identified by GC-MS (12, 15).
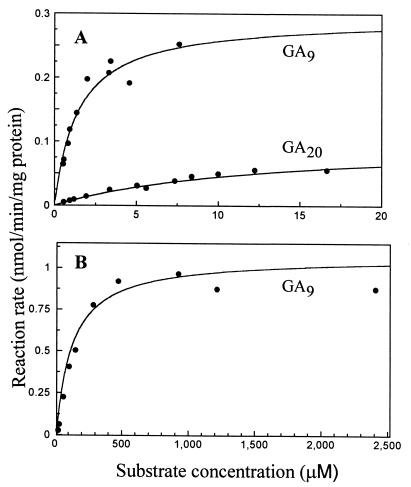
For kinetic studies with the expression product from Le cDNA, different concentrations of [14C]GA9 (0.5–8 μM) or [14C]GA20 (0.5–17 μM) were incubated for 15 min at 30°C with cofactors and, respectively, 2 μl cell extract in 0.2 ml or 20 μl cell extract in 0.1 ml. In corresponding incubations with the le product, [14C]GA9 (4.7 μM–2.3 mM) was incubated with 25 μl cell extract in 0.1 ml total volume. To achieve the higher concentrations necessary for the latter study, substrate was diluted with unlabeled GA9. Reaction rates were based on the separation of products by HPLC with online radiomonitoring (27). Michaelis–Menten curves and Km values were obtained by nonlinear regression using Enzfitter (Biosoft, Milltown, NJ).
Southern and Northern Blot Analysis.
DNA was electrophoresed in LE agarose (FMC) and transferred to Hybond-N nylon membranes (Amersham) (26). Poly(A)+ RNA was either electrophoresed in formaldehyde gels and transferred to nylon membranes (26) or applied directly to nylon membranes using a Bio-Dot SF slot blot apparatus (Bio-Rad). Probe was prepared from 1.2 kb cloned 3β-hydroxylase (Le) template by random priming with Ready-To-Go beads (−dCTP) (Pharmacia). Unincorporated nucleotides were removed by spin column through Sephadex G-50 (Pharmacia). Blots were hybridized overnight at 42°C in hybridization solution (50% formamide/0.25 M NaCl/7% SDS/0.12 M sodium phosphate, pH 6.5), washed once each in 5×, 1×, and 0.2× SSC at 42°C, washed twice in 0.1× SSC at 42°C (60°C for RNA blots), and autoradiographed.
RESULTS
A GA 3β-hydroxylase cDNA from Le Pea.
We used cDNA from stems of GA-deficient line B686–67-(3) (naLe) as template for our PCR experiments. In this mutant, GA biosynthesis is blocked at a step prior to that in le (28). Choice of template was based on the knowledge that 3β-hydroxylase activity is relatively high in internodes (29) and the possibility that 3β-hydroxylase transcript in pea, like arabidopsis (15), would be more abundant in a GA-deficient mutant.
Nested PCR using primers 1c and 3ab, followed by 2d and 4ab (Table 1) generated a single product of ca. 100 bp. Its length and derived amino acid sequence were similar to the corresponding region of the arabidopsis clone, and we proceeded to clone the 5′ and 3′ ends of the message. The full-length cDNA had an open reading frame of 1122 bp, encoding a protein of 374 amino acids. The sequence exhibited 60% identity and 75% similarity with that of the arabidopsis GA 3β-hydroxylase (Fig. 2).
Figure 2.
Alignment of deduced GA 3β-hydroxylase amino acid sequences from pea (Le; accession no. AF001219) and arabidopsis (accession no. L37126), indicating the substitutions in sequences from le, le-3, and led pea lines. Light/dark shading indicates similar/identical residues. Bar, initial PCR product; asterisks, conserved residues that in isopenicillin N synthase bind iron.
Heterologous expression in E. coli confirmed the nature of the cDNA. We cloned the coding sequence of the cDNA in expression vector pET23a and expressed it in E. coli HMS174(DE3). Cell lysate converted [14C]GA20 and [14C]GA9 to the expected products GA1 and GA4, respectively. The identity of the products was confirmed by GC-MS.
Southern and Northern Blot Analysis.
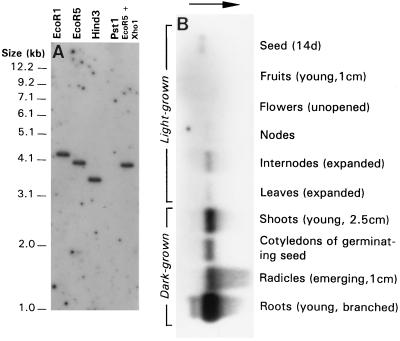
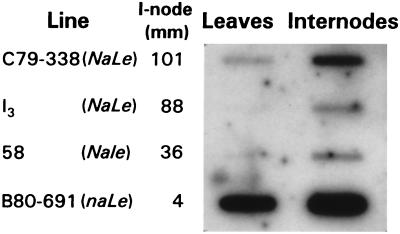
The clone was characterized further by Southern and Northern blotting at high stringency, using the cloned coding sequence as a probe. The single-band pattern produced by restriction of genomic DNA from line I3 showed that the cDNA did not hydridize to any other closely related sequences (Fig. 3A). On Northern blots, transcript was more abundant in etiolated, germinating seedlings than in older, light-grown plants grown to node 6 (Fig. 3B). It was particularly abundant in radicles and roots of young seedlings. In light-grown plants, transcript was more abundant in internodes than in other organs and was not detectable in flowers or young fruit. Transcript content also varied among lines representing a range of internode lengths (Fig. 4). As anticipated, internodes and leaves of the naLe line used to isolate the 3β-hydroxylase cDNA contained more transcript than those of any Na line. Excluding the na genotype, transcript was more abundant in the line with the longest internodes, C79–338 (NaLe), than in I3 (NaLe) and 58 (Nale), which had similar contents.
Figure 3.
Analysis of line I3 (Le). (A) Southern blot of genomic DNA (30 μg per lane). PstI cut poorly, and signal was not detected in this lane. (B) Northern blot of poly(A)+ RNA isolated from different organs (3 μg per lane; overnight exposure). Signal was not detected in flowers and fruits even after 1-week exposure. Arrow indicates direction of electrophoresis.
Figure 4.
Variation in expression of the GA 3β-hydroxylase gene among pea lines (1 μg poly(A)+ RNA per slot). Average length of internode (i-node) 5–6 is given for reference.
Homologous Clones from le, led, and le-3 Lines.
Homologous 3β-hydroxylase cDNA clones were isolated from le, led, and le-3 lines by PCR, and their sequences were compared with that from Le (Fig. 2). In sequences from le and led lines, substitution of A for G at base position 685, relative to the start codon, converts alanine-229 to threonine. Additionally in the led line, deletion of base G376 produces a shift in reading frame. In the le-3 line, substitution of T for C at base position 826 converts histidine-276 to tyrosine.
When expressed in E. coli, enzyme activity of clones from le, led, and le-3 lines was lower than that from the Le line. Based on the conversion of 14C-labeled GA9 and GA20 by crude cell lysates in overnight incubations, their relative activities were Le > le-3 ≈ le > led for both substrates (Table 2). Kinetic parameters for the 3β-hydroxylases from the Le and le lines were determined (Fig. 5). The expression product from Le gave Km values of 1.5 μM (Vmax = 0.29 nmol/min per mg protein) and 13 μM (Vmax = 0.10 nmol/min per mg protein) for GA9 and GA20, respectively. A much higher Km value for GA9 (118 μM; Vmax = 1.06 nmol/min per mg protein) was obtained for the le expression product. Enzyme activity with GA20 was too low in this case to measure reaction rates. The relative abundance of the expressed protein in E. coli, as determined by SDS/polyacrylamide electrophoresis, was very low and was similar for both the Le and le clones.
Table 2.
Conversion of [14C]GA9 and [14C]GA20 to products [14C]GA4 and [14C]GA1, respectively, by lysate of E. coli expressing GA 3β-hydroxylase clones
Values are percent of total counts in substrate and product fractions after overnight incubations at 20°C. Cultures were grown simultaneously and adjusted to approximately equal cell numbers prior to lysis.
Products were identified by comparison of their mass spectra with published spectra (30): [17-14C]GA4 mass/charge (% relative abundance), 420(23), 392(12), 388(14), 360(10), 330(22), 298(20), 291(48), 286(100), 263(26), 235(42), 227(84), 225(84), 203(37), 129(59); [17-14C]GA1, 508(100), 493(10), 450(18), 435(5), 418(5), 378(15), 359(5), 315(10), 237(9), 209(32).
Figure 5.
Michaelis–Menten plots for GA 3β-hydroxylation by cell lysates from E. coli expressing cDNA clones from Le (A) or le (B) lines. [14C]GA9 or [14C]GA20 was incubated for 15 min at 30°C with lysate and cofactors. The amount of lysate used in A was 2 μl (19 μg protein) and 20 μl (192 μg protein) with GA9 and GA20, respectively; in B, 25 μl (240 μg protein) was used with GA9. Lysate of the clone from le had no activity on GA20.
DISCUSSION
Because the arabidopsis GA 3β-hydroxylase sequence (15) was the only one of its kind available, we relied on regions of the amino acid sequence that are conserved within groups of plant 2-oxoglutarate-dependent dioxygenases, as well as on regions conserved across the dioxygenases, when designing primers for PCR (24). We selected primers to limit redundancy and to take advantage of nested PCR (Table 1). Systematic screening of primer combinations yielded a product that led to the isolation of a GA 3β-hydroxylase cDNA clone from Le pea.
We investigated the possibility that the enzyme was encoded by Le, one of the original Mendelian loci. Four alleles at this locus are known: Le, le (1, 2), led (31), and le-3 (23). They affect internode length differentially, Le > le-3 > le > led. The stature of Le mutants can be restored by application of GA1, but not by GA20 (31, 32). This and other observations discussed in the Introduction led to the proposal that Le encoded a 3β-hydroxylase (7, 14).
Sequences of clones isolated from pea lines homozygous for mutant alleles differed slightly from that of our original 3β-hydroxylase clone. However, we could not be sure whether these differences were significant or simply coincidental, because the clones came from lines with different genetic backgrounds. The sequence of the clone isolated from led suggested that these differences were significant. Because the led mutant had originated from an le line, it was likely to be a more severe, double mutant. Consistent with the origin of the allele, the 3β-hydroxylase clone isolated from led contained two changes. One was the same as that found in the clone from le; the other was a single-base deletion that shifted reading frame.
An additional indication of a link between Le and the 3β-hydroxylase clones came from in vitro enzyme assays. Activity of the recombinant enzymes under our conditions reflected the effects of the Le alleles on stem elongation and GA1 content (12, 13, 23, 33). Their relative enzyme activities were Le > le-3 ≈ le > led for both substrates, GA9 and GA20. Supporting this result was the high Km for GA9 with the recombinant enzyme from le, nearly 100-fold higher than the corresponding value for the enzyme from Le. Km values are independent of variations in enzyme concentration inherent in heterologous gene expression systems.
Based on this evidence, we propose that Le encodes the GA 3β-hydroxylase. Le transcript is found in highest amounts in germinating seedlings, in which GA20, stored in the mature seed or produced de novo, would be converted to GA1 to promote rapid stem elongation. Indeed, in seeds of the slender mutant sln, which contain abnormally large amounts of GA20, conversion to GA1 on germination results in hyperelongation (34). Much less transcript is found in shoots of established plants and in developing seeds. Although GA1 is also found in young seeds, conversion of GA20 to GA1 in this tissue has not been demonstrated (35). In pea as in arabidopsis (15), transcript is more abundant in GA-deficient mutants, suggesting that expression of the GA 3β-hydroxylase gene, like that of the GA 20-oxidase (17, 18, 21), is subject to feedback regulation.
The effect of le and le-3 mutations may be due to their proximity to the active site of the enzyme. The le mutation is near his-231 and asp-233, residues that are conserved in 2-oxo-acid-dependent oxygenases and that, in isopenicillin N synthase, are involved in binding iron (36). The mutation, in which an alanine residue is replaced by threonine, appears to reduce affinity for the GA substrate. Although it is not possible to compare Vmax values between impure preparations, the high value obtained for le suggests that, apart from substrate affinity, enzyme function is not adversely affected.
The discovery that led is a null mutation was unexpected. The small amount of GA1 found in these plants (37) suggests that other 3β-hydroxylases may exist. The led mutant should be a very useful tool for studying the role of GA1 in plant growth and development.
In summary, the cloned 3β-hydroxylase fits the description of Le. Our assertion is based on several pieces of evidence. Mutations in the 3β-hydroxylase are found in cDNAs isolated from lines carrying recessive Le alleles. Furthermore, the cDNA from led, purportedly a double-mutant, has two mutations. The effect of the mutations on the 3β-hydroxylase activity of recombinant enzymes reflects the relative effects of the Le alleles on plant growth and GA1 content. On the basis of this evidence, we conclude that Le encodes the 3β-hydroxylase.
Acknowledgments
We thank D. A. Ward for technical assistance and P. Gaskin for GC-MS analysis. This project was supported in part by the Oregon State University Research Council. IACR receives grant-aided support from the Biotechnology and Biological Science Research Council of the United Kingdom. This paper is Oregon Agricultural Experiment Station Technical Paper No. 11,164.
ABBREVIATION
- GA
gibberellin
Footnotes
Data deposition: The sequence reported in this paper has been deposited in the GenBank database (accession no. AF001219).
References
- 1.Mendel, G. (1866) Royal Horticultural Society of London, trans. (1938) (Harvard Univ. Press, Cambridge, MA).
- 2.White O E. Proc Am Philos Soc. 1917;56:487–588. [Google Scholar]
- 3.Brian P W, Hemming H G. Physiol Plant. 1955;8:669–681. [Google Scholar]
- 4.Brian P W. Symp Soc Exp Biol. 1957;11:166–181. [PubMed] [Google Scholar]
- 5.Radley M. Nature (London) 1956;178:1070–1071. [Google Scholar]
- 6.Davies P J, Emshwiller E, Gianfagna T J, Proebsting W M, Noma M, Pharis R P. Planta. 1982;154:266–272. doi: 10.1007/BF00387873. [DOI] [PubMed] [Google Scholar]
- 7.Ingram T J, Reid J B, Murfet I C, Gaskin P, Willis C L, MacMillan J. Planta. 1984;160:455–463. doi: 10.1007/BF00429763. [DOI] [PubMed] [Google Scholar]
- 8.Kobayashi M, Sakurai A, Saka H, Takahashi N. Plant Cell Physiol. 1989;30:963–969. [Google Scholar]
- 9.Spray C, Phinney B O, Gaskin P, Gilmour S J, MacMillan J. Planta. 1984;160:464–468. doi: 10.1007/BF00429764. [DOI] [PubMed] [Google Scholar]
- 10.Spray C R, Kobayashi M, Suzuki Y, Phinney B O, Gaskin P, MacMillan J. Proc Natl Acad Sci USA. 1996;93:10515–10518. doi: 10.1073/pnas.93.19.10515. [DOI] [PMC free article] [PubMed] [Google Scholar]
- 11.Talon M, Koorneef M, Zeevaart J A D. Proc Natl Acad Sci USA. 1990;87:7983–7987. doi: 10.1073/pnas.87.20.7983. [DOI] [PMC free article] [PubMed] [Google Scholar]
- 12.Ross J J, Reid J B, Gaskin P, MacMillan J. Physiol Plant. 1989;76:173–176. [Google Scholar]
- 13.Proebsting W M, Hedden P, Lewis M J, Croker S J, Proebsting L N. Plant Physiol. 1992;100:1354–1360. doi: 10.1104/pp.100.3.1354. [DOI] [PMC free article] [PubMed] [Google Scholar]
- 14.Ross J J, Reid J B, Dungey H S. Planta. 1992;186:166–171. doi: 10.1007/BF00196245. [DOI] [PubMed] [Google Scholar]
- 15.Chiang H-H, Hwang I, Goodman H M. Plant Cell. 1995;7:195–201. doi: 10.1105/tpc.7.2.195. [DOI] [PMC free article] [PubMed] [Google Scholar]
- 16.Lange T, Hedden P, Graebe J E. Proc Natl Acad Sci USA. 1994;91:8552–8556. doi: 10.1073/pnas.91.18.8552. [DOI] [PMC free article] [PubMed] [Google Scholar]
- 17.Phillips A L, Ward D A, Uknes S, Appleford N E J, Lange T, Huttly A K, Gaskin P, Graebe J E, Hedden P. Plant Physiol. 1995;108:1049–1057. doi: 10.1104/pp.108.3.1049. [DOI] [PMC free article] [PubMed] [Google Scholar]
- 18.Xu Y-L, Li L, Wu K, Peeters A J M, Gage D A, Zeevaart J A D. Proc Natl Acad Sci USA. 1995;92:6640–6644. doi: 10.1073/pnas.92.14.6640. [DOI] [PMC free article] [PubMed] [Google Scholar]
- 19.Martin D N, Proebsting W M, Parks T D, Dougherty W G, Lange T, Lewis M J, Gaskin P, Hedden P. Planta. 1996;200:159–166. doi: 10.1007/BF00208304. [DOI] [PubMed] [Google Scholar]
- 20.Wu K, Li L, Gage D A, Zeevaart J A D. Plant Physiol. 1996;110:547–554. doi: 10.1104/pp.110.2.547. [DOI] [PMC free article] [PubMed] [Google Scholar]
- 21.Toyomasu T, Kawaide H, Sekimoto H, von Numers C, Phillips A L, Hedden P, Kamiya Y. Physiol Plant. 1997;99:111–118. [Google Scholar]
- 22.MacMillan J, Ward D A, Phillips A L, Sánchez-Beltrán A J, Gaskin P, Lange T, Hedden P. Plant Physiol. 1997;113:1369–1377. doi: 10.1104/pp.113.4.1369. [DOI] [PMC free article] [PubMed] [Google Scholar]
- 23.Reid J B, Hasan O, Ross J J. J Plant Physiol. 1990;137:46–52. [Google Scholar]
- 24.Prescott A G. J Exp Bot. 1993;44:849–861. [Google Scholar]
- 25.Frohman M A. In: PCR Protocols: A Guide to Methods and Applications. Innis M A, Gelfand D H, Sninsky J J, White T J, editors. San Diego: Academic; 1990. pp. 28–38. [Google Scholar]
- 26.Sambrook J, Fritsch E F, Maniatis T. Molecular Cloning: A Laboratory Manual. 2nd Ed. Cold Spring Harbor, NY: Cold Spring Harbor Lab. Press; 1989. [Google Scholar]
- 27.Lange T, Schweimer A, Ward D A, Hedden P, Graebe J E. Planta. 1995;195:98–107. [Google Scholar]
- 28.Ingram T J, Reid J B. Plant Physiol. 1987;83:1048–1053. doi: 10.1104/pp.83.4.1048. [DOI] [PMC free article] [PubMed] [Google Scholar]
- 29.Smith V A. Plant Physiol. 1992;99:372–377. doi: 10.1104/pp.99.2.372. [DOI] [PMC free article] [PubMed] [Google Scholar]
- 30.Gaskin P, MacMillan J. GC-MS of the Gibberellins and Related Compounds: Methodology and a Library of Spectra. Bristol, U.K.: Cantock’s Enterprises; 1992. [Google Scholar]
- 31.Ross J J, Reid J B. Ann Bot. 1987;59:107–109. [Google Scholar]
- 32.Ingram T J, Reid J B, Potts W C, Murfet I C. Physiol Plant. 1983;59:607–616. [Google Scholar]
- 33.Ross J J, Reid J B. Pisum Genet. 1991;23:29–34. [Google Scholar]
- 34.Ross J J, Reid J B, Swain S M, Hasan O, Poole A T, Hedden P, Willis C L. Plant J. 1995;7:513–523. [Google Scholar]
- 35.Rodrigo M J, García-Martínez J L, Santes C M, Gaskin P, Hedden P. Planta. 1997;201:446–455. [Google Scholar]
- 36.Roach P L, Clifton I J, Fülop V, Harlos K, Barton G J, Hajdu J, Andersson I, Schofield C J, Baldwin J E. Nature (London) 1995;375:700–704. doi: 10.1038/375700a0. [DOI] [PubMed] [Google Scholar]
- 37.Ingram T J, Reid J B, MacMillan J. Planta. 1986;168:414–420. doi: 10.1007/BF00392370. [DOI] [PubMed] [Google Scholar]


