

Abstract
Previous studies have reported that high concentrations of homocysteine and lower concentrations of vitamin B6, B12, and folate increase the risk for cognitive decline and pathology in aging populations. In this cross-sectional study, high-resolution magnetic resonance imaging (MRI) scans and a 3-day food diary were collected on 32 community-dwelling adults between the ages of 59 and 79. We examined the relation between vitamin B6, B12, and folate intake on cortical volume using an optimized voxel-based morphometry (VBM) method and global gray and white matter volume after correcting for age, sex, body mass index, calorie intake, and education. All participants met or surpassed the recommended daily intake for these vitamins. In the VBM analysis, we found that adults with greater vitamin B6 intake had greater gray matter volume along the medial wall, anterior cingulate cortex, medial parietal cortex, middle temporal gyrus, and superior frontal gyrus, whereas people with greater B12 intake had greater volume in the left and right superior parietal sulcus. These effects were driven by vitamin supplementation and were negated when only examining vitamin intake from diet. Folate had no effect on brain volume. Furthermore, there was no relationship between vitamin B6, B12, or folate intake on global brain volume measures, indicating that VBM methods are more sensitive for detecting localized differences in gray matter volume than global measures. These results are discussed in relation to a growing literature on vitamin intake on age-related neurocognitive deterioration.
Keywords: homocysteine, VBM, aging, brain, MRI, vitamin B6, vitamin B12
1. Introduction
Elderly individuals are susceptible to neurodegenerative diseases that are characterized by cognitive and emotional dysfunction, and severe cortical and subcortical deterioration. Research into risk factors and interventions for dementia has suggested that certain lifestyle factors such as physical activity and a diet higher in B vitamins and anti-oxidants could reduce the risk of developing neuropathological conditions (Kramer et al., 2004; Obeid and Herrman, 2006). For example, intake of vitamin B6, B12, and folate is inversely related to circulating total homocysteine levels (tHcy), a non-essential amino-acid derived from methionine metabolism. In vitro studies have shown that homocysteine damages vascular endothelial cells, causing an increase risk of stroke (Bostom et al., 1999; Bots et al., 1999) and has a direct excitotoxicity effect on the brain by binding to n-methyl-d-aspartate (NMDA) receptors (Lipton et al., 1997). Homocysteine also increases oxidative stress and amyloid-β-induced apoptosis (Ho et al., 2001), which can be prevented by folate supplementation (Ho et al., 2003). People with neurodegenerative diseases have higher levels of circulating tHcy and people with Alzheimer’s disease (AD) that have higher baseline levels of tHcy show a more rapid progression of the disease over a three year period (Clarke et al., 1998). In addition, serum folate levels are negatively correlated with severity of post-mortem cerebral atrophy in AD patients (Snowdon et al., 2000). These effects have prompted speculation that greater intake of B vitamins may reduce the risk or reverse some of the deleterious symptoms associated with high tHcy and dementia. Recent clinical trials suggest that B vitamin supplementation reliably reduces tHcy levels in pathological populations, but only some have found that this reliably improves cognitive performance (Abyad et al., 2002; Eastley et al., 2000). It is possible that vitamin supplementation or higher intake should be initiated earlier in life and well before a prognosis of dementia is made (Obeid and Herrman, 2006).
The effects of vitamin intake and tHcy are also evident in non-pathological aging. Older adults are susceptible to hyperhomocysteinemia due to either less dietary intake or reduced gastrointestinal absorption of the B vitamins (Selhub et al., 1993; Selhub et al., 2000). Goodwin et al. (1983) demonstrated that low levels of folate and vitamin B12 were related to poorer neurocognitive function in community-dwelling elderly. Others have replicated this for a variety of tasks in both older men and women (e.g. Budge et al., 2002, however, see Kang et al., 2006). In a longitudinal study of 841 elderly people higher tHcy levels were related to greater cognitive decline over a 4-year period (Dufouil et al., 2003). However, a recent randomized clinical trial of 24 weeks of vitamin B12 and folic acid supplementation in older adults with mild vitamin B12 deficiency showed no differences on any cognitive measures between placebo and treatment groups (Eussen et al., 2006). This effect replicates others that have also failed to find positive effects on cognition in clinically randomized trials (Hvas et al., 2004; McMahon et al., 2006). Some authors have argued that neural deterioration may be too severe in some circumstances for short-term supplementation to reverse or inhibit age-related cognitive decline (Obeid and Herrman, 2006). Therefore, it remains questionable whether lower B vitamin intake and higher tHcy are simply markers of cognitive decline and pathology or whether they represent a significant causal risk factor associated with neurocognitive deterioration (Seshadri, 2006).
Neuroimaging methods that allow for a non-invasive investigation of brain morphology and function provide another means to study the effects of B vitamin intake and tHcy in aged individuals. For example, higher levels of tHcy is related to more advanced atrophy of the medial temporal lobe in people with AD, and the rate of atrophy over a three year period is more rapid in those with higher tHcy levels at the initial assessment (Snowdon et al., 2000). Both hippocampal width (Williams et al., 2002) and volume (Bleich et al., 2003), and anterior lateral ventricle-brain ratios (Sachdev et al., 2002), are inversely related to tHcy levels. In addition, two studies have reported that higher tHcy levels are associated with greater global cortical atrophy (Whalley et al., 2003).
Other studies, however, have failed to find any relationships between tHcy, or vitamin B levels, and brain volume or atrophy measures. For example, in a study of 385 community-dwelling older adults (Sachdev, 2004), there was no relationship between tHcy levels and cortical or subcortical brain atrophy indices. Other studies have also failed to find an association between tHcy levels and global measures of cortical atrophy (Sachdev et al., 2002; Longstreth et al., 2004).
One potential explanation for this discrepancy is that different methods employed for examining brain volume or atrophy (e.g. ventricle-brain ratios, global gray matter volume, manual tracing), differ in their sensitivity for detecting localized differences in brain volume. It is possible that the effects of tHcy and vitamin intake affect certain brain regions and not others and that measures of global or central atrophy may be insensitive to localized effects.
Given that tHcy levels are inversely related to B vitamin intake, we examined the influence that vitamin B6, B12, and folate intake have on gray and white matter volume in a community-dwelling elderly population. To this end, we used (a) an optimized voxel-based morphometry (VBM) technique (Ashburner and Friston, 2000) that examines volumetric differences throughout the brain on a voxel-by-voxel basis and provides spatially specific conclusions about brain volume, and (b) global measures of gray and white matter volume that lack regional spatial specificity. We were then able to compare the ability of each technique to detect differences in brain volume as a function of B6, B12, and folate intake.
2. Results
2.1 VBM
We assessed whether there was an association between vitamin B6, B12, and folate intake on brain volume measures (partial volume estimates) via a multiple regression model with each of the vitamins as a separate independent variable of interest and age, sex, years of education, and total calorie consumption as covariates of no interest.
We found a significant positive association between gray matter volume and intake of vitamin B6 after controlling for age, body mass index (BMI), sex, calorie intake, and years of education (all voxels exceeding a statistical threshold of Z=3.1 (p<.001)). These effects were found along the anterior medial wall including the anterior cingulate cortex and supplementary motor area (mean Z-score = 3.31, p<.0005; peak Z-score = 3.77, p<.0001) and a separate cluster along the posterior cingulate cortex and medial parietal cortex (mean Z-score = 3.37, p<.0004; peak Z-score = 3.95, p<.0001). In addition, we found greater volume in the left parietal lobule (mean Z-score = 3.37, p<.0004; peak Z-score = 4.39, p<.0001), bilateral superior frontal gyrus (mean Z-score = 3.19, p<.001; peak Z-score = 3.35, p<.0004), and bilateral middle temporal gyrus (mean Z-score =3.27, p<.0005; peak Z-score = 3.53, p<.0002) with greater intake of B6 (see Figure 1 and Table 2). These effects can be considered robust and statistically independent of age, sex, years of education, and total calorie consumption.
Figure 1.
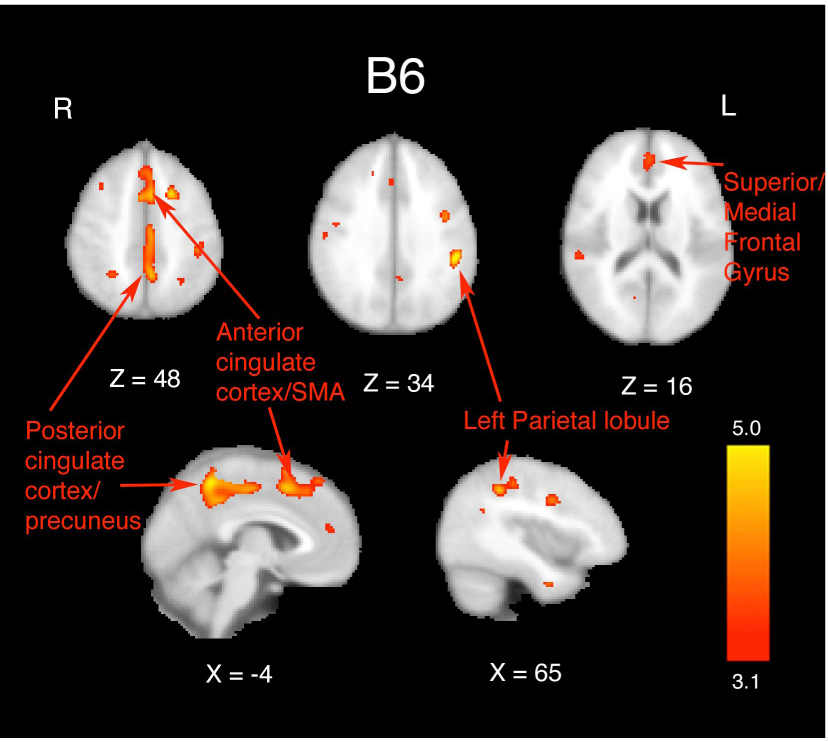
Results from the multiple regression analysis of total (both dietary intake and supplementation) vitamin B6 on gray matter volume as assessed by VBM. Statistical maps were thresholded at a voxel-wise Z-score of 3.1 (p<.001). Images are displayed in radiological (R=L) orientation. Effects were seen along the medial wall, anterior cingulate cortex/supplementary motor area, left parietal lobule, and bilateral middle temporal gyrus. X and Z values represent slice coordinates. These effects were negated when examining vitamin B6 intake only from the diet.
Table 2.
Regions, cluster sizes (in number of voxels), peak Z-scores within each cluster, and the x,y,z coordinates for the location of each peak in MNI space for effects of total B6 intake and B12 intake (both diet and supplementation).
| Cluster and peak report table. | |||||
|---|---|---|---|---|---|
| Region | Cluster size (voxels) | Z-score peak | X | Y | Z |
| B6: | |||||
| Anterior cingulate cortex/SMA | 705 | 3.77 | −4 | 12 | 50 |
| Posterior cingulate cortex/precuneus | 888 | 3.95 | −4 | −50 | 54 |
| Left parietal lobule | 416 | 4.39 | −50 | −34 | 32 |
| Superior frontal gyrus | 132 | 3.35 | 0 | 48 | 14 |
| B12: | |||||
| Left parietal lobule | 60 | 3.85 | −36 | −60 | 24 |
| Right parietal lobule | 27 | 3.65 | 44 | −52 | 34 |
We examined whether the regions showing a positive relation between intake of B6 and volume was driven by B6 obtained from the diet versus that obtained from supplementation (see Experimental Procedure). We found that the positive effect of vitamin B6 on brain volume was negated when only examining intake obtained from the diet. In other words, there were no voxels that reached statistical criterion when only examining B6 intake from the diet. Intake from supplementation was driving the observed effects of B6 on the volume measurements in all regions. This effect was interesting since every participant either met or surpassed the recommended Dietary Reference Intake for B6 for this age group (1.5–1.7 mg/day) from their diet alone (see Table 1). For example, in the regions that were found to vary as function of total vitamin B6 intake, the anterior cingulate and pre-supplementary motor area had a mean Z-score of −1.19 and a peak Z-score of .12 when assessing vitamin B6 intake from the diet. Similarly, the mean Z-score in the posterior cingulate cortex when examining the effects of vitamin B6 obtained from the diet was −.37 and the peak Z-score in this region was .87. These values were far removed from the Z-scores obtained when combining dietary intake with supplementation and demonstrates that the effects of vitamin B intake on brain volume measures were driven by supplementation and not through dietary intake from food.
Table 1.
Demographics and daily vitamin intake for the 32 participants in the sample. Note that the Recommended Daily Intake for this age group for Vitamin B6 (Males: 1.7 mg; Females: 1.5 mg), Vitamin B12 (2.4 µg), and Folate (400 µg) have all been met or surpassed by the participants in our sample. Total amounts represent the sum of vitamin intake from both the diet and supplementation. Diet values represent the vitamin intake from the diet and not from supplementation. The Supplement values represent the intake from supplementation and not from the diet. The averages from the Supplementation rows are only from those people who reported taking supplementation.
| Demographics table. | |
|---|---|
| Variable | Mean (SD) |
| Age | 68 (6) |
| Years of education | 15.3 (3.0) |
| Sex | 19 female; 13 male |
| BMI | 28.6 (3.8) |
| Daily calorie intake | 1770 (461) |
| Total folate | 1927 µg (1068) |
| Total B6 | 27.0 mg (57.7) |
| Total B12 | 63.2 µg (73.6) |
| Diet folate | 934 µg (517) |
| Diet B6 | 4.2 mg (2.2) |
| Diet B12 | 12.2 µg (8.3) |
| Supplement folate | 994 µg (947) |
| Supplement B6 | 22.9 mg (59.4) |
| Supplement B12 | 51.0 µg (71.6) |
We also found a positive association between gray matter volume and intake of vitamin B12 after controlling for age, BMI, sex, calorie intake, and years of education. These effects were found in the posterior parietal lobule (left mean Z-score = 3.36, p<.0004; left peak Z-score = 3.85, p<.0001; right mean Z-score = 3.33, p<.0004; right peak Z-score = 3.65, p<.0001), bilaterally (see Figure 2). Similar to B6, these effects were negated when only examining intake from the diet and were therefore, being driven by supplementation (see Table 2 for coordinates and locations). As with B6, every participant either met or surpassed the recommended Dietary Reference Intake for B12 for this age group (2.4 µg/day) from their diet alone. For example, when examining the effects of dietary vitamin B12 levels in both the left and right parietal lobule we found that the mean Z-scores were substantially reduced (left mean Z-score = .10; right mean Z-score = .08).
Figure 2.
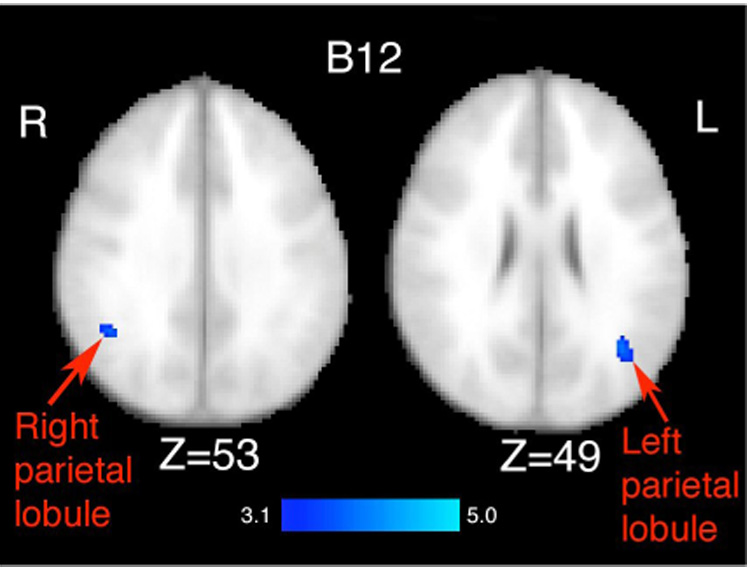
Results from the multiple regression analysis of total (both dietary intake and supplementation) vitamin B12 on gray matter volume as assessed by VBM. Statistical maps were thresholded at a Z-score of 3.1 (p<.001). Images are displayed in radiological (R=L) orientation. Effects were observed in the bilateral superior parietal lobule. The Z values represent the slice coordinates. These effects were negated when examining vitamin B12 intake only from the diet.
There were no effects of folate intake from either the diet or from supplementation on any region of the brain, and no white matter effects for any of the variables. Furthermore, there were no areas that showed a negative relationship between intake and brain volume.
For the factors that we treated as covariates of no interest, age had a significant negative correlation with gray matter volume throughout much of the cortex including prefrontal, parietal, and temporal cortices. Similar age effects have been reported previously (Kramer et al., 2004; Erickson et al., 2005). There were no main effects for years of education, sex, total calorie consumption, or BMI.
As an additional analysis, we included total gray matter volume for each subject as a covariate in the statistical analysis (Mechelli et al., 2005). The addition of this covariate did not alter the B6 or B12 results as reported above.
2.2 Global gray and white matter
We failed to find any association between either total gray matter or total white matter with either total, dietary, or supplemental intakes of B6, B12, or folate after adjusting for variance associated with age, BMI, sex, calorie intake, and years of education (see Table 3 for adjusted correlation coefficients).
Table 3.
Global gray matter and white matter volume for the entire sample represented in mm3. Adjusted correlation coefficients and probability values associated with total intake, dietary intake, and supplement intake for vitamin B6, B12, and folate after adjustment for age, sex, BMI, calorie intake, and years of education. The Supplement rows were calculated by only using the participants who reported supplementation use. There were no significant relationships between any of the variables and global measures of brain volume.
| Gray | White | ||
|---|---|---|---|
| Global value | 588552 mm3 | 537640 mm3 | |
| B6 | Total | r= .26 (p<.15) | r=.18 (p<.33) |
| Diet | r=−.10 (p<.57) | r=−.19 (p<.31) | |
| Supplement | r=.15 (p<.40) | r=.17 (p<.36) | |
| B12 | Total | r= .11 (p<.55) | r= −.02 (p<.89) |
| Diet | r=−.19 (p<.28) | r=−.25 (p<.17) | |
| Supplement | r=.10 (p<.57) | r=−.02 (p<.91) | |
| Folate | Total | r= −.02 (p<.90) | r= −.10 (p<.57) |
| Diet | r=.07 (p<.68) | r=−.23 (p<.20) | |
| Supplement | r=−.11 (p<.55) | r=−.10 (p<.58) |
3. Discussion
In this study, we examined the influence of vitamin B6, B12, and folate intake on brain volume in a sample of community-dwelling older adults. We found that although all participants met or surpassed the recommended Dietary Reference Intake for each of the B vitamins, greater intake of vitamin B6 and B12 were reliably associated with greater gray matter volume in specific cortical regions. Interestingly, this effect was driven by vitamin supplementation, such that the positive association of vitamin B6 and B12 was negated when only examining dietary intake. In short, our results provide the first evidence that intake, and specifically supplementation of B6 and B12, is positively related to brain volume in older adults.
Previous studies have related circulating tHcy levels to cortical and subcortical atrophy measures and have reported contradictory findings (e.g. Snowdon et al., 2000; Sachdev, 2004). We suggested that the discrepant findings might be partially accounted for by differences in the sensitivity of the techniques employed to examine brain volume. For example, some of the studies that failed to find a relationship between tHcy and brain volume employed global cortical measures that may be insensitive for detecting isolated effects in the brain (Sachdev et al., 2002; Longstreth et al., 2004). The results from our study suggest that vitamin intake is related to the volume of tissue in some brain regions and not others, and VBM methods, or measures that are able to assess volume in particular regions of the brain, may be more sensitive for detecting these effects. This suggests that methodological differences could account for some of the variability between previous studies.
The brain areas that varied with intake have been linked to memory and executive processes. Aging has been associated with volume loss in these regions with concomitant loss in cognitive functioning (Rodrigue and Raz, 2004). Therefore, spared tissue in these regions with greater B vitamin intake may have consequences for cognitive functioning in older adults. However, since we did not collect cognitive measures we could not determine the relationship between brain volume indices and cognitive function. Because of this, the clinical significance of our findings is unknown.
Levels of vitamin B6, B12, and folate are often inversely related with tHcy levels. Due to reduced gastrointestinal absorption of the B vitamins, older adults have a higher risk for developing hyperhomocysteinemia, which may increase the risk for stroke (Bostom et al., 1999) and Alzheimer’s disease (Snowdon et al., 2000). In this study, we assessed daily intake of the B vitamins and vitamin supplementation and did not directly measure tHcy. Therefore, we cannot determine whether the brain regions we found to be positively related with B vitamin supplementation were inversely related to tHcy. It will be important for future research to relate the volume of these brain areas to circulating levels of B vitamins and/or tHcy.
Our findings should be interpreted in the context of a few limitations. First, although a 3-day food diary has frequently been used to study nutrient intake in older adults (Melanson et al., 2006), and similar assessments have been validated (e.g. Luhrmann et al., 1999), it is more subjective and prone to error than other more objective measures (e.g. blood). Participants often misreport their daily intake or underestimate portion sizes in food diaries. In this study, all participants met with a registered dietitian in order to clarify portion sizes and correct misrepresentations in the diet, however there remains a possibility of error associated with this form of assessment. Despite this limitation we were still able to detect volume differences as a function of vitamin B6 and B12 intake from a 3-day food diary with a high probability (p<.001). A second limitation in this study is that our sample size only consisted of 32 participants. Although we were still able to detect effects with this sample size, a larger sample is optimal for VBM comparisons. Finally, this study was cross-sectional and therefore we cannot conclude that greater intake of vitamin B6 and B12 causes less tissue deterioration with age. It is possible that our participants who had more gray matter volume in these regions chose to eat healthier and make use of vitamin supplements. Despite these limitations, our study provides intriguing results for the use of B vitamin intake on brain volume and adds to a growing literature on the inverse relationship between vitamin B6, B12, and folate on tHcy levels and the risks and effects of tHcy and vitamin intake on cognition and the brain in both pathological and non-pathological aging populations.
In sum, we report the first evidence that greater intake of vitamin B6 and B12 in a community-dwelling, non-pathological aging population is associated with greater gray matter volume. It is likely that cognitive tasks that rely on these brain regions will be the most susceptible to B vitamin deficiency and measures of global cortical atrophy may not be sensitive enough to detect the specificity of these effects.
4. Experimental Procedures
4.1 Participants
Thirty-two community-dwelling older adults between the ages of 59 and 79 participated in the study and signed an informed consent approved by the University of Illinois (see Table 1 for demographic information). The participants were screened and excluded if they reported claustrophobia, any previous head trauma or head surgery, or if they scored below 51 on the revised and modified Mini-Mental Status Examination (high of 57). In addition, all participants reported no known prior neurological conditions, no prior substance abuse, no current use of any psychiatric medication, and no metallic implants. In addition, all MR images were visually inspected for abnormalities or evidence for stroke or tumors.
4.2 MRI measures
High-resolution T1 MRI scans (1 mm × 1 mm × 1.3 mm) were collected on a Siemens 3-Tesla Allegra magnet on all participants.
4.3 VBM analyses
VBM is a method that can assess tissue atrophy on a voxel-wise basis throughout the brain with high resolution. Detailed methods for this technique have been published elsewhere (Ashburner and Friston, 2000; Erickson et al., 2005; Erickson et al., 2007).
In short, non-brain tissue was extracted from each image (Smith, 2002). The images were then segmented into gray, white, and cerebrospinal fluid maps and registered into a stereotaxic space (Jenkinson et al., 2002). A 12 mm FWHM Gaussian kernel was applied to each voxel. These maps were then used as tissue priors to seed the re-segmentation of the original images. After resegmentation, the images were registered into stereotaxic space (MNI) and smoothed with a 10 mm FWHM Gaussian kernel. A study-specific template was used for second-level registration. Finally, the Jacobian determinant was calculated for the transformation into standard space and multiplied to the images in order to preserve volumetric information at each voxel (Mechelli et al., 2005).
4.4 Global volume measures
We assessed total gray and white matter volume by first applying a brain extraction technique to remove non-brain tissue (Smith, 2002). These images were then segmented into separate gray and white matter maps and then total gray and white matter volumes were calculated as mm3 to provide a total volume estimate for each tissue type.
4.5 Nutrition measures
Three-day food records are commonly employed to study food consumption and diet in a variety of populations, including older adults (e.g. Melanson et al., 2006). In fact, 3-day food diaries are considered to be one of the standards by which other assessments, such as foodfrequency questionnaires, are compared (e.g. Paalanen et al., 2006). Three-day food diaries have also been validated by comparisons with blood nutrient levels (Luhrmann et al., 1999).
At the MRI sessions, participants were given a 3-day food record. Participants were encouraged to read the packet and record two weekdays and one weekend day of detailed food intake in the week immediately following the MRI session. The packet contained instructions on how to accurately record food intake and portion sizes. Participants also met with a registered dietitian (B.L.S.) within one week of receiving and completing the food record. The registered dietitian reviewed the food record with the participants to get an accurate assessment of food intake, dietary supplement use and portion sizes. To help participants with portion sizes, we utilized food models and pictures. Any corrections to portion sizes or misrepresentations of the diet were recorded and modified at this session.
The 3-day food record was analyzed using The Food Processor® Nutrition Analysis Software Version 8.3 (ESHA Research, Salem, Oregon). Mean daily intake of the B vitamins from the diet was calculated separately from the intake from vitamin supplementation. Sixty-five percent of the sample reported taking vitamin supplementation. The amounts from the diet and supplementation were then summed to obtain a total vitamin intake value for each of the B vitamins examined. The three B vitamins of interest in this study were measured as follows: vitamin B12 and folate in µg/day and vitamin B6 in mg/day.
4.6 Statistical analyses
The gray and white matter partial volume maps resulting from the VBM analysis were interrogated on a voxel-by-voxel basis for variation in gray matter and white matter as a function of B6, B12, and folate intake. Total amounts (from both the diet and supplementation) of B6, B12, and folate intake were entered separately as continuous independent variables within a multiple regression model. Age, years of education, BMI, total calorie consumption, and sex were included as covariates of no interest. Statistical maps were thresholded at a voxel-wise threshold of Z > 3.1 (p<.001) uncorrected for multiple comparisons. FSL3.3 was used for all analyses.
To examine whether effects of B vitamins on brain volume were driven by dietary intake or supplementation we performed the same analysis as described above except with vitamin amounts obtained exclusively from the diet. Dietary amounts of B6, B12, and folate intake from the diet were entered separately as continuous independent variables within a multiple regression model. Similar to the analyses for total amounts of the B vitamins, age, years of education, BMI, total calorie consumption, and sex were included as covariates of no interest. Any observed differences between the results from dietary intake of the B vitamins and the results from the total amount of B vitamin intake can be attributed to supplement levels of each of the B vitamins. Therefore, this analysis isolates the effects for not only dietary intake of the B vitamins, but also for the effects of supplementation.
We also examined whether global measures of gray and white matter volume was related to vitamin B6, B12, and folate intake levels. Similar to the voxel-by-voxel approach for VBM as described above, we conducted a multiple regression analysis with vitamin B6, B12, and folate intake entered separately as continuous independent variables while controlling for age, sex, BMI, calorie intake, and years of education. SPSS for the Mac was used for these multiple regression analyses.
It is worthwhile to note that the multiple regression analysis allows us to assess the linear effects of different levels of B vitamins on predicting brain volume values. However, the term “greater” vitamin intake should only be interpreted within the context of the current sample (given the mean and standard deviations represented in Table 1). It is very likely that other amounts of B vitamins that are either higher or less than the amounts reported in this study may have no effect or detrimental effects associated with them. Therefore, we stress again that the term “greater” B vitamin intake should only be interpreted within the range of B vitamin intake with this sample.
Acknowledgements
We would like to thank Michelle Voss, Maritza Alvarado, Jenny Kim, Edward Malkowski, Steven Marek, Nancy Dodge, and Holly Tracy for help with data collection. This research was supported by a grant from the National Institute on Aging (RO1 AG025667).
Footnotes
Publisher's Disclaimer: This is a PDF file of an unedited manuscript that has been accepted for publication. As a service to our customers we are providing this early version of the manuscript. The manuscript will undergo copyediting, typesetting, and review of the resulting proof before it is published in its final citable form. Please note that during the production process errors may be discovered which could affect the content, and all legal disclaimers that apply to the journal pertain.
References
- Abyad A. Prevalence of vitamin B12 deficiency among demented patients and cognitive recovery with cobalamin replacement. J. Nutr. Health Aging. 2002;6:254–260. [PubMed] [Google Scholar]
- Ashburner JA, Friston KJ. Voxel-based morphometry – the methods. NeuroImage. 2000;11:805–821. doi: 10.1006/nimg.2000.0582. [DOI] [PubMed] [Google Scholar]
- Bleich S, Bandelow B, Javaheripour K, Muller A, Degner D, Wilhelm J, Havemann-Reinecke U, Sperling W, Ruther E, Kornhuber J. Hyperhomocysteinemia as a new risk factor for brain shrinkage in patients with alcoholism. Neuroscience Letters. 2003;335:179–182. doi: 10.1016/s0304-3940(02)01194-1. [DOI] [PubMed] [Google Scholar]
- Bostom AG, Rosenberg IH, Silbershatz H, Jacques PF, Selhub J, D'Agostino RB, Wilson PW, Wolf PA. Nonfasting plasma total homocysteine levels and stroke incidence in elderly persons: the Framingham Study. Ann. Intern. Med. 1999;131:352–355. doi: 10.7326/0003-4819-131-5-199909070-00006. [DOI] [PubMed] [Google Scholar]
- Bots ML, Launer LJ, Lindemans J, Hoes AW, Hofman A, Witteman JC, Koudstaal PJ, Grobbee DE. Homocysteine and short-term risk of myocardial infarction and stroke in the elderly: the Rotterdam Study. Arch. Intern. Med. 1999;159:38–44. doi: 10.1001/archinte.159.1.38. [DOI] [PubMed] [Google Scholar]
- Budge MM, de Jager C, Hogervorst E, Smith AD. Total plasma homocysteine, age, systolic blood pressure, and cognitive performance in older people: Oxford Project To Investigate Memory and Ageing (OPTIMA) J. Am. Geriatr. Soc. 2002;50:2014–2018. doi: 10.1046/j.1532-5415.2002.50614.x. [DOI] [PubMed] [Google Scholar]
- Clarke R, Smith AD, Jobst KA, Refsum H, Sutton L, Ueland PM. Folate, vitamin B12, and serum total homocysteine levels in confirmed Alzheimer disease. Arch. Neurol. 1998;55:1449–1455. doi: 10.1001/archneur.55.11.1449. [DOI] [PubMed] [Google Scholar]
- Dufouil C, Alpérovitch A, Ducros V, Tqourio C. Homocysteine, white matter hyperintensities, and cognition in healthy elderly people. Ann. Neurol. 2003;53:214–221. doi: 10.1002/ana.10440. [DOI] [PubMed] [Google Scholar]
- Eastley R, Wilcock GK, Bucks RS. Vitamin B12 deficiency in dementia and cognitive impairment: the effects of treatment on neuropsychological function. Int. J. Geriatr. Psychiatry. 2000;15:226–233. doi: 10.1002/(sici)1099-1166(200003)15:3<226::aid-gps98>3.0.co;2-k. [DOI] [PubMed] [Google Scholar]
- Erickson KI, Colcombe SJ, Raz N, Korol DL, Scalf P, Webb A, Cohen NJ, McAuley E, Kramer AF. Selective sparing of brain tissue in postmenopausal women receiving hormone replacement therapy. Neurobiol. Aging. 2005;26:1205–1213. doi: 10.1016/j.neurobiolaging.2004.11.009. [DOI] [PubMed] [Google Scholar]
- Erickson KI, Colcombe SJ, Elavsky S, McAuley E, Korol DL, Scalf PE, Kramer AF. Interactive effects of fitness and hormone treatment on brain health in postmenopausal women. Neurobiol. Aging. 2007;28:179–185. doi: 10.1016/j.neurobiolaging.2005.11.016. [DOI] [PubMed] [Google Scholar]
- Eussen SJ, de Groot LC, Joosten LW, Bloo RJ, Clarke R, Ueland PM, Schneede J, Blom HJ, Hoefnagels WH, van Staveren WA. Effect of oral vitamin B-12 with or without folic acid on cognitive function in older people with mild vitamin B-12 deficiency: a randomized, placebo-controlled trial. Am. J. Clin. Nutr. 2006;84:361–370. doi: 10.1093/ajcn/84.1.361. [DOI] [PubMed] [Google Scholar]
- Goodwin JS, Goodwin JM, Garry PJ. Association between nutritional status and cognitive status and cognitive functioning in a healthy elderly population. J.A.M.A. 1983;249:2917–2921. [PubMed] [Google Scholar]
- Ho PI, Collins SC, Dhitavat S, Ortiz D, Ashline D, Rogers E, Shea TB. Homocysteine potentiates beta-amyloid neurotoxicity: role of oxidative stress. J. Neurochem. 2001;78:249–253. doi: 10.1046/j.1471-4159.2001.00384.x. [DOI] [PubMed] [Google Scholar]
- Ho PI, Ashline D, Dhitavat S, Ortiz D, Collins SC, Shea TB, Rogers E. Folate deprivation induces neurodegeneration: roles of oxidative stress and increased homocysteine. Neurobiol. Dis. 2003;14:32–42. doi: 10.1016/s0969-9961(03)00070-6. [DOI] [PubMed] [Google Scholar]
- Hvas AM, Juul S, Lauritzen L, Nexo E, Ellegaard J. No effect of vitamin B-12 treatment on cognitive function and depression: a randomized placebo controlled study. J. Affect. Disord. 2004;81:269–273. doi: 10.1016/S0165-0327(03)00169-1. [DOI] [PubMed] [Google Scholar]
- Jenkinson M, Bannister PR, Brady JM, Smith SM. Improved optimization for the robust and accurate linear registration and motion correction of brain images. NeuroImage. 2002;17:825–841. doi: 10.1016/s1053-8119(02)91132-8. [DOI] [PubMed] [Google Scholar]
- Kang JH, Irizarry MC, Grodstein F. Prospective study of plasma folate, vitamin B12, and cognitive function and decline. Epidemiology. 2006;17:650–657. doi: 10.1097/01.ede.0000239727.59575.da. [DOI] [PubMed] [Google Scholar]
- Kramer AF, Bherer L, Colcombe SJ, Dong W, Greenough WT. Environmental influences on cognitive and brain plasticity during aging. J. Gerontol. A. Biol. Sci. Med. Sci. 2004;59:940–957. doi: 10.1093/gerona/59.9.m940. [DOI] [PubMed] [Google Scholar]
- Lipton SA, Kim WK, Choi YB, Kumar S, D’Emilia DM, Rayudu PV, Arnelle DR, Stamler JS. Neurotoxicity associated with dual actions of homocysteine at the N-methyl-D-aspartate receptor. Proc. Natl. Acad. Sci. U. S. A. 1997;94:5923–5928. doi: 10.1073/pnas.94.11.5923. [DOI] [PMC free article] [PubMed] [Google Scholar]
- Longstreth WT, Jr, Katz R, Olsen J, Bernick C, Carr JJ, Malinow MR, Hess DL, Cushman M, Schwartz SM. Plasma total homocysteine levels and cranial magnetic resonance imaging findings in elderly persons: the Cardiovascular Health Study. Arch. Neurol. 2004;61:67–72. doi: 10.1001/archneur.61.1.67. [DOI] [PubMed] [Google Scholar]
- Luhrmann PM, Herbert BM, Gaster C, Neuhauser-Berthold M. Validation of a self-administered 3-day estimated dietary record for use in the elderly. Eur. J. Nutr. 1999;38:235–240. doi: 10.1007/s003940050066. [DOI] [PubMed] [Google Scholar]
- McMahon JA, Green TJ, Skeaff CM, Knight RG, Mann JI, Williams SM. A controlled trial of homocysteine lowering and cognitive performance. N. Engl. J. Med. 2006;354:2764–2772. doi: 10.1056/NEJMoa054025. [DOI] [PubMed] [Google Scholar]
- Melanson KJ, Angelopoulos TJ, Nguyen VT, Martini M, Zukley L, Lowndes J, Dube TJ, Fiutem JJ, Yount BW, Rippe JM. Consumption of whole-grain cereals during weight loss: effects on dietary quality, dietary fiber, magnesium, vitamin B-6, and obesity. J. Am. Diet. Assoc. 2006;106:1380–1388. doi: 10.1016/j.jada.2006.06.003. [DOI] [PubMed] [Google Scholar]
- Mechelli A, Price CJ, Friston KJ, Ashburner J. Voxel-based morphometry of the human brain: methods and applications. Current Medical Imaging Reviews. 2005;1:105–113. [Google Scholar]
- Obeid R, Herrman W. Mechanisms of homocysteine neurotoxicity in neurodegenerative diseases with special reference to dementia. F.E.B.S. Lett. 2006;580:2994–3005. doi: 10.1016/j.febslet.2006.04.088. [DOI] [PubMed] [Google Scholar]
- Paalanen L, Mannisto S, Virtanen MJ, Knekt P, Rasanen L, Montonen J, Pietinen P. Validity of a food frequency questionnaire varied by age and body mass index. J. Clin. Epidemiol. 2006;59:994–1001. doi: 10.1016/j.jclinepi.2006.01.002. [DOI] [PubMed] [Google Scholar]
- Rodrigue KM, Raz N. Shrinkage of the entorhinal cortex over five years predicts memory performance in healthy adults. J. Neurosci. 2004;24:956–963. doi: 10.1523/JNEUROSCI.4166-03.2004. [DOI] [PMC free article] [PubMed] [Google Scholar]
- Sachdev PS, Valenzuela M, Wang XL, Looi JCL, Brodaty H. Relationship between plasma homocysteine levels and brain atrophy in healthy elderly individuals. Neurology. 2002;58:1539–1541. doi: 10.1212/wnl.58.10.1539. [DOI] [PubMed] [Google Scholar]
- Sachdev PS. Homocysteine, cerebrovascular disease and brain atrophy. J. Neurological Sciences. 2004;226:25–29. doi: 10.1016/j.jns.2004.09.006. [DOI] [PubMed] [Google Scholar]
- Selhub J, Jacques PF, Wilson PW, Rush D, Rosenberg IH. Vitamin status and intake as primary determinants of homocysteinemia in an elderly population. J.A.M.A. 1993;270:2693–2698. doi: 10.1001/jama.1993.03510220049033. [DOI] [PubMed] [Google Scholar]
- Selhub J, Bagley LC, Miller J, Rosenberg IH. B vitamins, homocysteine, and neurocognitive function in the elderly. Am. J. Clin. Nutr. 2000;71:614S–620S. doi: 10.1093/ajcn/71.2.614s. [DOI] [PubMed] [Google Scholar]
- Seshadri S. Elevated plasma homocysteine levels: risk factor or risk marker for the development of dementia and Alzheimer's disease? J. Alzheimers Dis. 2006;9:393–398. doi: 10.3233/jad-2006-9404. [DOI] [PubMed] [Google Scholar]
- Smith SM. Fast robust automated brain extraction. Hum. Brain Mapp. 2002;17:143–155. doi: 10.1002/hbm.10062. [DOI] [PMC free article] [PubMed] [Google Scholar]
- Snowdon DA, Tully CL, Smith CD, Riley KP, Markesbery WR. Serum folate and the severity of atrophy of the neocortex in Alzheimer’s disease: findings from the Nun study. Am. J. Clin. Nutr. 2000;71:993–998. doi: 10.1093/ajcn/71.4.993. [DOI] [PubMed] [Google Scholar]
- Whalley LJ, Staff RT, Murray AD, Duthie SJ, Collins AR, Lemmon HA, Starr JM, Deary IJ. Plasma vitamin C, cholesterol and homocysteine are associated with grey matter volume determined by MRI in non-demented old people. Neuroscience Letters. 2003;341:173–176. doi: 10.1016/s0304-3940(02)01452-0. [DOI] [PubMed] [Google Scholar]
- Williams JH, Pereira AC, Budge MM, Bradley KM. Minimal hippocampal width relates to plasma homocysteine in community-dwelling older people. Age and Aging. 2002;31:440–444. doi: 10.1093/ageing/31.6.440. [DOI] [PubMed] [Google Scholar]