

Abstract
The main sites of longitudinal growth in skeletal muscle are the ends of the fibers. This study tests the hypothesis that satellite cells (SCs) are at a greater frequency (#SC nuclei/all nuclei within basal laminae) and concentration (closer together) within growing fiber ends of posthatch chicken pectoralis. SCs were localized by their Pax7 expression, and fiber ends were identified by their retention of neonatal myosin heavy chains and small cross-sectional profiles. Whereas SC frequency decreased from about 20% at 9 days posthatch to <5% at 115 days, fiber ends retained a frequency of ∼16%. Calculated mean area of sarcolemma per SC revealed higher concentrations of SCs at fiber ends. There was also a strong inverse correlation between SC frequency and fiber profile cross-sectional size throughout development. This study suggests that SCs at fiber ends play a key role in the longitudinal growth of muscle fibers, and that fiber profile size may impact SC distribution. (J Histochem Cytochem 56:77–87, 2008)
Keywords: muscle fibers, muscle growth, myosin, satellite cells, myonuclei, Pax7, fiber ends
Satellite cells (SCs) are mononuclear myogenic stem cells located between the basal lamina and plasmalemma of the skeletal muscle fiber (Mauro 1961; Schultz and McCormick 1994; Zammit et al. 2006). They contribute to skeletal muscle growth, regeneration, and repair (Lemischka 1999; Charge and Rudnicki 2004). Under proper stimuli such as injury to the muscle fiber or exercise, SCs can become active, proliferate, and fuse with the fiber to become new myonuclei (Moss and Leblond 1971; Seale and Rudnicki 2000; Hawke and Garry 2001). Whereas earlier studies required the electron microscope to identify SCs, there are currently a variety of molecular markers that can be used to label SCs for study with the light microscope (Hawke and Garry 2001; Wozniak et al. 2005). The paired box transcription factor seven (Pax7) is probably the most useful marker due to its specificity in muscle for SCs and the availability of effective antibodies against Pax7 (Zammit et al. 2006; Day et al. 2007). Pax7 is expressed by quiescent, active, and proliferating SCs, but not by myonuclei (Seale et al. 2000; Collins et al. 2005; Relaix et al. 2005; Shefer et al. 2006). In a previous study we demonstrated the specific expression of Pax7 by all SCs in the pectoralis muscle of chicken (Halevy et al. 2004).
The ends of skeletal muscle fibers have been shown to be highly active sites of postnatal growth and the main sites for the longitudinal growth of muscle. New sarcomeres are added in series to the ends of existing myofibrils during normal longitudinal growth of the muscles of mammals (Williams and Goldspink 1971; Goldspink 2003) and fish (Ennion et al. 1999). In those mouse muscles in which fibers are arranged in series, overlapping one another from origin to insertion of the muscle, longitudinal growth of the fibers also produces an increase in diameter of the muscle (Paul and Rosenthal 2002). Nuclei are preferentially added to the ends of growing myotubes in rats (Zhang and McLennan 1995). In experimentally induced lengthening of immature leg muscle of rabbits, a greater proportion of SCs expressing proliferating cell nuclear antigen were located at the musculotendinous junction than in other regions of the muscle (Tsujimura et al. 2006).
The pectoralis muscle of the chicken is composed of overlapping fibers arranged in series (Gaunt and Gans 1992; Trotter 1993). Consequently, a transverse section anywhere through the belly of the muscle will include the profiles of many fiber ends (Rosser et al. 1995,2000,2002). Distinct myosin heavy chain (MyHC) isoforms are sequentially expressed within the fibers of developing chicken pectoralis (Bandman and Rosser 2000). Embryonic isoforms are supplanted by a neonatal isoform that is in turn replaced by an adult isoform. In each muscle fiber, replacement of neonatal by adult MyHC isoform progresses from the centrally located motor end plate towards the tapered ends of the fiber (Rosser et al. 2000). Fiber end profiles invariably have the smaller diameters and retain densities of neonatal myosin comparable to those observed in neonatal muscle (Rosser et al. 1995,2000). We have previously shown that myonuclei are more concentrated (located closer to one another) at the ends of maturing fibers of posthatch chicken pectoralis (Rosser et al. 2002).
Questions remain concerning the distribution of SCs within skeletal muscles. SCs tend to be more concentrated near specific anatomic structures such as blood capillaries and motor end plates (Schultz and McCormick 1994; Christov et al. 2007). Along the rest of the length of individual muscle fibers, SCs have been described as either evenly (Snow 1981) or randomly (Novotova and Uhrik 1992) distributed. The frequency of SCs and number of SC nuclei divided by the sum of myonuclei and SC nuclei has been commonly used to study the distribution of SCs (Schmalbruch and Hellhammer 1977; Gibson and Schultz 1983; Hikida et al. 1998; Roth et al. 2000; Sajko et al. 2002). This frequency was found to vary among species (Castillo de Maruenda and Franzini-Armstrong 1978; Novotova and Uhrik 1992), muscles, and different fiber types (Schmalbruch and Hellhammer 1977; Schultz and McCormick 1994). The trend in temporal distribution for most species and muscles studied showed a decrease in SC frequency and number with age (Snow 1977; Gibson and Schultz 1983; Hawke and Garry 2001; Shefer et al. 2006).
This article elucidates temporal and spatial patterns of SC distribution in the posthatch chicken pectoralis. We test the hypothesis that there is a greater frequency and concentration of SCs at the ends of growing posthatch muscle fibers. We examine some of the same chicken pectoralis samples used in our previous studies (Rosser et al. 2000,2002). Using immunocytochemical techniques that include an antibody against Pax7, we detected SCs among different regions of the muscle fibers during maturation. Whereas the frequency of SCs is significantly reduced with age, it remains high at the ends of the fibers where SCs are also located closer to one another. Some of these findings have been presented as a conference abstract (Allouh and Rosser 2006).
Materials and Methods
Animals and Tissue Preparation
Female White Leghorn chickens (Gallus gallus; Hy-Line W-36, Clark Hy-Line, Brandon, Canada) were hatched at the same time and raised under identical conditions at the University of Saskatchewan, Department of Animal and Poultry Science, as described in our previous studies (Rosser et al. 2000,2002). Following the Canadian Council on Animal Care Guidelines and with the approval of the University of Saskatchewan Committee on Animal Care and Supply, three birds were killed by cervical dislocation at each of the following ages: 9, 23, 30, 49, 62, 79, and 115 days posthatch.
Muscle samples were excised from superficial regions of the cranial half of the main part of the left pectoralis muscle (M. pectoralis pars sternobrachialis; Vanden Berge and Zweers 1993) of each bird. Each sample was approximately 0.5 × 0.5 × 1–2 cm. The long axis of each sample was parallel to the direction of the muscle fibers. Each sample was then coated with OCT compound (Miles Inc.; Elkhart, IN), immediately frozen in 2-methylbutane cooled via liquid nitrogen (Sewry and Dubowitz 2001), and then stored at −80C. Serial cross-sections of samples were cut at 10-μm thickness at −20C using a cryostat. Every two serial sections were picked up on a ProbeOn Plus microscopic slide (Fisher Scientific Ltd.; Toronto, Canada). Serial slides bearing sections were numbered and stored at −20C. Using these same methods, some longitudinal sections were also obtained from each animal.
Antibodies, Nuclear Labeling, and Immunocytochemical Techniques
Three previously characterized primary antibodies were each diluted in blocking solution (see following). Anti-Pax7 (Developmental Studies Hybridoma Bank; Iowa City, IA) (Berggren et al. 2001) is a mouse monoclonal used at 1:100 to label SC nuclei. Anti-laminin (L9393; Sigma, St Louis, MO) (Tisay and Key 1999) is a rabbit polyclonal used at 1:200 to detect basal laminae. Anti-neonatal MyHC (2E9; gift from Dr. E. Bandman) is a mouse monoclonal used at 1:500 to label the neonatal MyHC isoform of the chicken (Bandman 1985; Moore et al. 1992). Fluorescein isothiocyanate-conjugated anti-mouse and tetramethylrhodamine anti-rabbit secondary antibodies (A-11010 and A-11001; Molecular Probes, Eugene, OR) were used, respectively, to label anti-Pax7 green and anti-laminin red when viewed with epifluorescent microscopy. Each of these secondary antibodies was prepared at 1:200 in PBS (see following). Hoechst 33258 (Bisbenzimide; Sigma) was applied at 1:1,500,000 in PBS to label the DNA in nuclei blue under epifluorescent microscopy. Biotin-conjugated anti-mouse secondary antibody (B-9904; Sigma) was used at 1:500 to visualize labeling of neonatal myosin by the anti-neonatal MyHC antibody when viewed under brightfield microscopy.
Serial numbered slides of muscle cross-sections were removed from the freezer and air dried for 15 min. Sections were treated for 30 min with blocking solution, which consisted of 5 mM EDTA in PBS (0.02 M sodium phosphate buffer, 0.15 M sodium chloride, pH 7.2), 5% goat serum, and 1% BSA. Slides were then alternatively treated either with the anti-neonatal MyHC antibody for brightfield microscopy or with anti-Pax7, anti-laminin, and Hoechst for epifluorescent microscopy. Using this approach, the type of fiber profile (neonatal, transforming, or adult) can be identified on one slide, whereas SC nuclei and myonuclei within the same fiber can be located in the serial sections on the adjacent slide. Appropriate controls included slides with blocking solution in place of primary antibody.
Anti-neonatal MyHC was applied over sections for 70 min and biotinylated goat anti-mouse secondary antibody for 30 min. The related immunocytochemical protocol followed our earlier studies (Rosser et al. 2000,2002). Briefly, the Avidin ABC kit (Vector Laboratories; Burlingame, CA) diluted in PBS was applied over the sections that were then kept in the dark for 60 min. To obtain a specific color reaction visible under the brightfield microscope, slides were immersed in 0.05% DAB in PB for 5 min.
Anti-Pax7 and anti-laminin primary antibodies were placed together over the serial sections for 12–16 hr at 4C in the dark, and a cocktail containing the fluorescein and tetramethyl secondary antibodies was then applied at room temperature for 30 min. Hoechst was used for 5 min. Slides were then fixed with 4% formaldehyde in PBS and mounted in Geltol (Thermo Shandon; Pittsburgh, PA). The related methodology followed our previous work (Halevy et al. 2004). Appropriate controls included slides with PBS in place of secondary antibody.
Image Analysis and Data Collection
Images were captured from each immunofluorescent slide using a Zeiss Axioskop 20 microscope (Carl Zeiss GmbH; Jena, Germany) equipped for epifluorescence and a Sony S70 (Sony Corporation; Tokyo, Japan) digital still camera. Depending on fiber size, three to six different fields of view were obtained from each slide. Three epifluorescent images, each viewed through a different wavelength filter, were acquired from each field. The resultant images were all nuclei in blue, SC nuclei in green, and basal laminae in red (Figure 1). Images were subsequently transferred to a Macintosh G4 computer (Apple Computers; Cupertino, CA), and the three images for each field of view were superimposed and their contrast improved using Adobe Photoshop (Adobe Systems; San Jose, CA).
Figure 1.

Immunocytochemical labeling of serial cross-sections of developing chicken pectoralis. Muscles were from birds aged 9 (A–C), 49 (D–F), and 79 (G–I) days posthatch. (A,D,G) Viewed by brightfield and labeled by the anti-neonatal MyHC antibody to distinguish the type of fiber profile (neonatal, n; transforming, t; adult, a). (B,E,H) Viewed under epifluorescence and sections are cut serially, respectively, to A,D,G. All nuclei appear blue due to labeling by Hoescht, and basal laminae appear red with labeling by anti-laminin. (C,F,I) Same sections as B,E,H, respectively, showing satellite cell (SC) nuclei in green labeled by anti-Pax7 and the basal laminae in red with anti-laminin.
Images of the anti-neonatal MyHC antibody-labeled slides were taken using brightfield microscopy from sections serial to those used for epifluorescence and included the same fields of view that were photographed under epifluorescence (Figure 1). Scion imaging program (developed by the U.S. National Institutes of Health and available on the internet by anonymous FTP from Zippy.nimh.nih.gov) was then used to set the images to gray scale for measuring the optical density (OD) and the ellipse minor axis of individual fibers. Pectoralis tissue from 9-day-old chicks was used as a neonatal density control, and larger fiber profiles of pectoralis tissue from 115-day-old chickens were used as a control for the absence of neonatal myosin. OD and ellipse minor axis of at least 200 contiguous fiber profiles from each animal were measured. OD measurements were used to classify fiber profiles as neonatal, transforming, or adult as per our earlier works (Rosser et al. 2000,2002). Briefly, white and black were automatically assigned OD values of 0 and 255, respectively, at the ends of a perfect arithmetic linear regression. All fiber profiles quantified at 9 days of age had ODs of >110, whereas control adult profiles at age 115 days had values of <80. Thus, in all sections studied, fiber profiles with a density of >110 were classified as neonatal, profiles <80 were classified as adult, and profiles ≥80 and ≤110 were classified as transforming. Ellipse minor axis was used to assess the size of fiber cross-sectional profiles from the pectoralis of birds aged 9, 49, and 62 days. These fiber profiles were then arranged into groups according to size by 10-μm increments.
The numbers of satellite cell nuclei (SCN) and myonuclei (MN) within each of the 200+ fibers of each animal were totaled. The frequency of SCs was then calculated for each animal, for each fiber profile type, and for each fiber size range group using the formula that frequency = (SCN/SCN + MN) × 100% (Schmalbruch and Hellhammer 1977). Mean values for SC frequency per fiber type and size group were obtained from three animals at each age using the means from each animal.
Longitudinal sections were used to measure the lengths of SC nuclei. The same methods outlined in the preceding to study cross-sections using epifluorescent microscopy were utilized to study longitudinal sections. The lengths of 15–22 SC nuclei were measured from longitudinal sections of the pectoralis of each of three animals at each of the following ages: 9, 30, 49, 62, and 115 days.
Concentration of SCs was determined by calculating the mean area of sarcolemma per SC. First, the number of SCs per unit length of fiber was calculated for each type of fiber profile (neonatal, transforming, and adult) using a formula from Castillo de Maruenda and Franzini-Armstrong (1978). This formula is N = A/(Ln + M), where N is the number of SCs per unit length of fiber, A is the mean number of SC nuclei per fiber profile, Ln is the average length of SC nucleus, and M is the thickness of tissue section. The surface area of sarcolemma per unit length of the fiber was then measured for different profiles using the formula S = πEU, where S is the surface area of the sarcolemma per unit length of fiber, E is the ellipse minor axis, and U is the unit length of the fiber (1 mm). Finally, the area of muscle fiber sarcolemma per each SC was determined by dividing the surface area measurements (S) by the number of SCs (N) in each type of fiber profile. SCs were deemed to be more concentrated when the mean area of sarcolemma per SC was less.
Statistics
After determining the homogeneity of variance, data were evaluated by one-way and univariate analysis of variance (ANOVA) at 5% level of significance. Samples were blocked into different age groups and randomized complete block design analysis was applied. If a significant (p<0.05) difference was found, Scheffe's post hoc analysis test was applied to examine statistical differences between groups. Kruskal–Wallis non-parametric test was used to evaluate surface area per SC data, and t-test for two independent samples was further applied to compare the neonatal group along with transforming or adult group. Data were plotted, and linear regression or curve fits were calculated. All statistical tests were performed using SPSS program (standard version 12.0.0; SPSS Inc., Chicago, IL).
Results
Expression of Pax7 by SC Nuclei
Locations of Pax7-labeled (+) nuclei relative to basal laminae (Figure 1) were determined from three animals at each of four different developmental ages: 9, 49, 62, and 115 days posthatch (Table 1). We found that ∼97–98% of the Pax7+ nuclei were located beneath the basal laminae of the muscle fibers. Consequently, these nuclei were classified as SC nuclei. The remaining 2–3% were nuclei located outside the basal laminae in the surrounding endomysium and perimysium (Figure 2).
Table 1.
Percent of Pax7+ nuclei that are satellite cell (SC) nuclei
| Age (days) | 9 | 49 | 62 | 115 |
| Number of fibers | 1500 | 1680 | 1650 | 1485 |
| Pax7+ nuclei within basal laminae | 159 | 161 | 144 | 103 |
| Pax7+ nuclei outside basal laminae | 3 | 5 | 4 | 2 |
| % of Pax7+ SC nuclei | 98.15 | 96.99 | 97.30 | 98.10 |
| % of Pax7+ non-SC nuclei | 1.85 | 3.01 | 2.70 | 1.90 |
“Number of fibers” for each age listed represents total number of fibers analyzed from three birds. Each bird contributed about one-third of the fibers. The percent of Pax7+ nuclei that are in a position characteristic of SC nuclei (located beneath the basal laminae) was calculated. At each age a small percentage of the Pax7+ nuclei were found in locations not characteristic of SCs.
Figure 2.
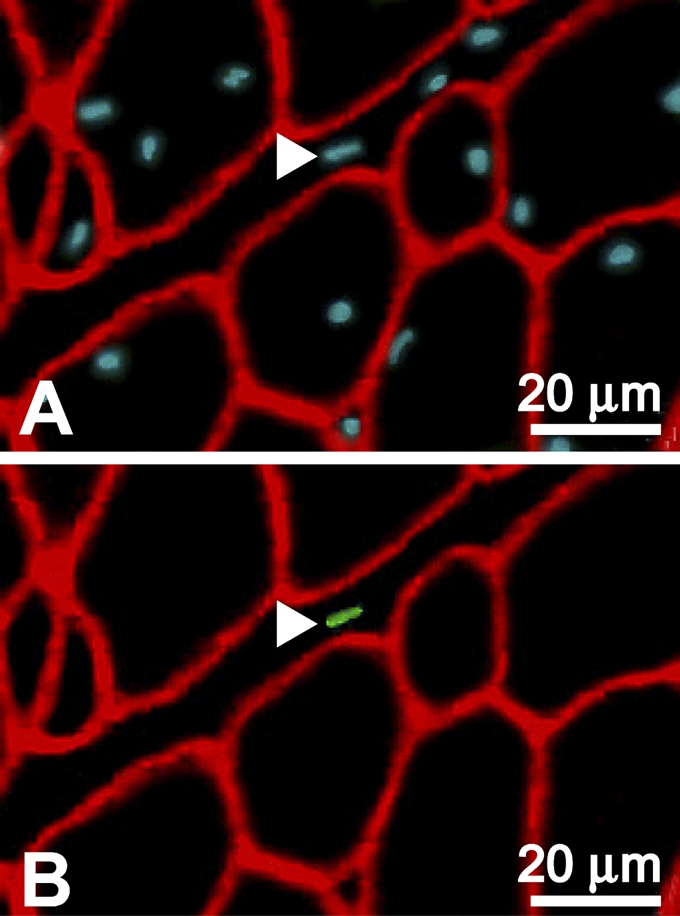
Pax7+ nucleus outside the basal laminae. A cross-section prepared from pectoralis muscle of a 49-day-old chicken and labeled for immunofluorescence by Hoescht in blue (A), anti-Pax7 in green (B), and anti-laminin in red (A,B). Arrowheads indicate a Pax7+ nucleus located within the interstitial tissue of the muscle outside the basal laminae of the fibers.
Length of SC Nuclei
Mean length of SC nuclei was determined on longitudinal sections obtained from three animals at each of the following ages: 9, 30, 49, 62, and 115 days posthatch (Table 2). There were no significant (p>0.05) differences in the mean length of SC nuclei either within or among these ages. Thus, there is a uniform length for SC nuclei in chicken pectoralis during development. Overall mean length was 10.28 μm ± 0.10 (±SD), and this value was used in our calculations of the number of SCs per unit length of fiber (see Materials and Methods). This length is comparable to those found in previous studies of other species and muscles (Muir 1970; Schmalbruch 1977).
Table 2.
Lengths of SC nuclei
| Age (days) | 9 | 30 | 49 | 62 | 115 |
| Mean length of SC nuclei (μm) ± SD | 10.30 ± 0.10 | 10.17 ± 0.06 | 10.33 ± 0.12 | 10.40 ± 0.10 | 10.18 ± 0.15 |
Longitudinal sections were cut from three birds at each of the five ages. The lengths of 15 to 22 SC nuclei were measured from each bird. Each value represents the average of the means from three birds at each age ± SE. There was no significant (p>0.05) difference in the lengths of SC nuclei among the different aged birds studied. The mean length of SC nuclei in the five ages was 10.28 μm ± 0.04 (SE).
Frequency of SCs and Fiber Size With Age
The mean frequency of SCs decreased significantly (p<0.01) with age. As illustrated in Figure 3A, the mean frequency declined from 20.04% at age 9 days posthatch to 4.86% at 115 days. These findings were consistent with our previous results, which included two of the same data points (Halevy et al. 2004) and reflect observations from studies of other species (Hawke and Garry 2001). Furthermore, our new expanded data showed that the declining pattern of SC frequency with age is a curvilinear regression [SC frequency = −5.808Ln(age) + 33.051, r = −0.971, p<0.001]. Mean fiber size increased significantly (p<0.001) with age. As shown in Figure 3B, fiber size increased from a mean ellipse minor axis of 12.21 μm at age 9 days posthatch to 35.9 μm at 115 days. Increase in muscle fiber diameter during postnatal growth is fairly ubiquitous among vertebrates (Swatland 1994; Goldspink and Yang 1999; MacIntosh et al. 2006). Our data showed that within chicken pectoralis the increase of fiber size with age is a curvilinear regression [fiber size = 10.454Ln(age) − 12.256, r = 0.969, p=0.006]. Further analysis also revealed a strong inverse correlation (r = −0.984, p<0.001) between mean fiber size and mean SC frequency [SC frequency= −0.545(fiber size) + 25.974], as illustrated in Figure 3C.
Figure 3.

Fiber profile size and SC frequency during development. Each symbol represents mean ± standard error (SE). (A) Mean frequency of SCs in the pectoralis was determined from at least 200 contiguous fiber profiles from the pectoralis of each of three chickens at each of the following ages: 9, 23, 30, 49, 62, 79, and 115 days posthatch. Frequency = (SCN/SCN + MN) − 100%, where SCN and MN are, respectively, the numbers of SC nuclei and myonuclei. SC frequency is significantly (p<0.01) decreased with age. (B) Mean fiber profile size, quantified by mean ellipse minor axis (in microns), was obtained using the same animals as in A. Fiber profile size is significantly (p<0.01) increased with age. (C) Linear regression showing a strong (r = −0.984, p<0.001) inverse correlation between mean SC frequency (A) and mean fiber profile size (B).
Frequency of SCs With Type of Fiber Profile
OD measurements were used to classify fiber profiles as neonatal, transforming, or adult as per our earlier works (Rosser et al. 2000,2002). Transforming profiles had ODs between those of neonatal and adult profiles. Neonatal profiles had the highest frequencies of SCs, ranging from 13.65% to 20.04% during development. The frequency of SCs was dramatically (p<0.001) decreased with repression of neonatal MyHC isoform expression (Figure 4A). There was no significant difference (p>0.05) in SC frequency between transforming and adult profiles. Overall, the mean frequency of SCs in transforming and adult profiles never reached 10%. All fiber profiles at ages 9 and 23 days were neonatal, whereas most of the profiles at age 115 days were adult. Transforming profiles appear somewhere between 23 and 30 days of age (see Rosser et al. 2000). These findings support our hypothesis that there is a greater frequency of SCs at the ends of muscle fibers because after 23 days of age, neonatal profiles are in fact the tapered ends of the fibers (Rosser et al. 2000).
Figure 4.

SC frequency and surface area of sarcolemma per SC during development in neonatal, transforming, and adult fiber profiles. (A) Each column represents mean SC frequency (%) ± SE. The frequency is significantly (p<0.001) greater in neonatal profiles than in either transforming or adult profiles. After 23 days of age, neonatal profiles are the ends of more mature transforming and adult profiles (Rosser et al. 2000). (B) Each column represents mean surface area of sarcolemma × 103 μm2 ± SE. There is significantly (p<0.05) less surface area per SC in neonatal profiles than in transforming or adult profiles.
Surface Area of Sarcolemma per SC
The surface area of muscle fiber sarcolemma per SC was calculated for each different type of fiber profile at each of the following ages: 9, 23, 30, 49, 62, 79, and 115 days posthatch. There was less area of sarcolemma per SC in neonatal profiles than in other profiles (Figure 4B). The difference was statistically significant (p<0.05) between neonatal and either transforming or adult profiles, but not between transforming and adult profiles (p=0.38). These results show that there is a greater concentration of SCs at fiber ends, represented by neonatal profiles, than in other regions of the muscle fibers.
Frequency of SCs With Fiber Profile Size
The mean frequency of SCs decreased with increasing fiber profile size. The ellipse minor axis of the largest profiles at age 9 days did not exceed 20 μm. At this age, although fibers ranging from 0 to 10 μm had on average a numerically greater frequency of SCs than those ranging from 10.01 to 20 μm, this difference was not statistically significant (p=0.12, Figure 5A). At both age 49 and 62 days, there was a significant (p<0.01) decrease in the mean frequency of SCs as the ellipse minor axis increased (Figures 5B and 5C). This decrease was most prominent as the ellipse minor axis increased from the range of 0.0–10.00 μm to 10.01–20 μm. These findings strongly support our hypothesis that the tapered fiber ends have a higher frequency of SCs because the smaller fiber profiles seen at 49 and 62 days of age are the tapered ends of muscle fibers (see Rosser et al. 2000).
Figure 5.

SC frequency according to fiber profile size. Three birds were studied at each of three different ages: (A) 9 days, (B) 49 days, and (C) 62 days. Between 200 and 250 fiber profiles from each pectoralis studied were arranged into different groups according to their ellipse minor axes values. Each column represents mean SC frequency (%) ± SE. The frequency of SCs in ages 49 and 62 days is significantly (p<0.01) reduced with increasing fiber size. The smaller fiber profiles are the tapered ends of larger profiles (Rosser et al. 2000).
Discussion
It is now well established that in skeletal muscle the nuclei of all resident satellite cells express Pax7 (Seale et al. 2000; Zammit et al. 2006; Day et al. 2007). Studies of humans, other mammals, birds, and amphibians have established that Pax7 is expressed by quiescent SCs and their proliferating progeny, that expression declines upon myogenic differentiation, and that Pax7 is typically not expressed within myonuclei (Halevy et al. 2004; Zammit et al. 2004; Morrison et al. 2006; Shefer et al. 2006; Verdijk et al. 2007). In the present study we used this characteristic Pax7 expression by resident satellite cells to investigate their distribution along the lengths of muscle fibers within the growing fibers of the posthatch chicken pectoralis. We find that ∼97–98% of Pax7+ nuclei are localized in positions characteristic of SCs, immediately beneath the basal laminae of muscle fibers. Hence, it is inferred that these Pax7+ nuclei are SC nuclei. The remaining 2–3% Pax7+ nuclei were located in the interstitial spaces outside the basal laminae of the muscle fibers and were not included in our calculations of SCs along fiber lengths. We also found at all ages of posthatch growth that myonuclei (Pax7−) were located throughout the sarcoplasm of individual fibers. Whereas the peripheral location of myonuclei is characteristic of normal postnatal mammalian muscle fibers (Sewry and Dubowitz 2001; Yablonka-Reuveni and Anderson 2006), myonuclei are also normally located in large numbers throughout the sarcoplasm of fibers within healthy posthatch chicken pectoralis muscle (George and Berger 1966; Rosser et al. 2002).
This is the first study to demonstrate that throughout growth and maturation there is both a greater frequency and a higher concentration of SCs at the terminal tips of skeletal muscle fibers. Our earlier studies showed that the ends of maturing skeletal muscle fibers in the posthatch pectoralis of the chicken (Rosser et al. 2000) and pigeon (Bartnik et al. 1999) retain high densities of neonatal MyHC isoform. We also demonstrated with previously published, but preliminary, data that SC frequency in the chicken pectoralis decreased during posthatch development (Halevy et al. 2004). Here we correlate our much expanded and more exact data on SC frequency with fiber size (see subsequent Discussion). The current study also finds that while SC frequency decreases during development with repression of neonatal MyHC isoform expression along the fiber lengths, the tapered fiber ends retain both neonatal myosin and a high frequency of SCs. To further validate these results, the frequency of SCs for different sizes of fiber profiles was obtained, and a higher frequency of SCs was found in smaller fiber profiles. This corroborates our results, as the smaller fiber profiles are the tapered ends of skeletal muscle fibers (Rosser et al. 2000). In addition, a greater concentration of SCs at the ends of skeletal muscle fibers was shown by significantly less sarcolemma per SC nucleus in those fiber regions expressing neonatal myosin.
Our results suggest that SCs at fiber ends play a key role in the longitudinal growth of muscle fibers. Developing skeletal muscle fibers grow in both length and width (Zhang and McLennan 1995; Paul and Rosenthal 2002). It has been established that the terminal ends of maturing muscle fibers are the regions for longitudinal growth within muscles (Swatland 1994; Goldspink 2003). Our earlier study showed that smaller myonuclear domains are present at the tapered ends of the fibers in the posthatch chicken pectoralis (Rosser et al. 2002). Myonuclear domain is the estimated volume of sarcoplasm associated with a single myonucleus, and each myonucleus is responsible for protein synthesis within its domain (Hall and Ralston 1989; Allen et al. 1999). Smaller myonuclear domains are an indication of greater protein synthesis because myonuclei tend to be more concentrated in regions of active protein synthesis (Edgerton and Roy 1991; Winchester and Gonyea 1992; Allen et al. 1999; Ohira et al. 2001). Myonuclei are postmitotic. SCs supply myonuclei to growing myofibers before becoming mitotically quiescent in maturing muscle. SCs can then be activated from this quiescent state for the maintenance, hypertrophy, and repair of mature muscle (Zammit et al. 2006). The higher frequency and concentration of SCs now observed at the fiber ends are presumably correlated with the demand for more myonuclei there due to greater protein synthesis required for longitudinal growth. Higher SC numbers are also associated with higher myonuclear numbers elsewhere in the muscle fiber. Studies have shown that SC nuclei tend to be more concentrated near capillaries and motor end plates (Schultz and McCormick 1994; Christov et al. 2007). Another study has shown the same for myonuclei (Ralston et al. 2006).
A recent study using immunocytochemical techniques to study rat soleus muscle indicated that equal numbers of SCs were distributed per unit length along the fibers (Wang et al. 2006). However, this was an experimental and not ontogenetic study, and neither SC frequencies nor SC concentrations were calculated. Also, whereas central, proximal, and distal regions of the fibers were compared, it was unclear how much of each fiber was encompassed by those regions designated as proximal and distal. Moreover, unlike chicken pectoralis, which is composed of overlapping fast-twitch fibers arranged in series (Gaunt and Gans 1993), rat soleus consists primarily of slow-twitch fibers (Golding et al. 2006) that extend the entire length of the muscle (Wang et al. 2006). Thus, it is difficult to compare the results of our study to those of Wang et al. (2006). Nonetheless, whereas unloading the soleus reduced myonuclear numbers uniformly along fiber lengths, SC numbers were reduced only in the central regions of the fibers. This indicates that high numbers of SCs are maintained at the end regions of unloaded muscle fibers and suggests that there are regional differences in the regulation of SCs along fiber lengths. Some additional support for our findings may be provided by an earlier study. Castillo de Maruenda and Franzini-Armstrong (1978) studied a fast-twitch muscle, the sartorius of adult frogs. It was indicated that the distal region of the belly of the muscle was tapered, as fibers gradually terminated into the distal tendon. Using the light microscope with phase and/or differential interference contrast, there were more SCs/fiber profile in the distal third of the belly of the muscle in four of five muscles examined. However, using the electron microscope, results on SC distribution were more variable.
We found that 2–3% of the Pax7+ nuclei were located in the interstitial spaces outside the basal laminae of the muscle fibers. Neither the role nor the source of myogenic cells in the interstitium is fully understood (Kuang et al. 2006; Schultz et al. 2006). Their presence is consistent with the theories that myogenic cells arise from non-muscle sources (Asakura et al. 2002; Shi and Garry 2006), that satellite cells migrate between muscle fibers in postnatal muscle (Lipton and Schultz 1979; Hughes and Blau 1990; Morgan et al. 1993), and that myogenic cells of alternate origins reside in the interstitium (Kuang et al. 2006). Myogenic cells in the interstitium have been described as either expressing (Schultz et al. 2006) or not expressing (Kuang et al. 2006) Pax7.
We demonstrate a strong inverse correlation between fiber profile diameter and SC frequency throughout development. To the best of our knowledge, this correlation has not been demonstrated by any other researcher(s). Another parameter showing strong inverse correlations with fiber cross-sectional size is oxidative capacity, as revealed by quantitative biochemical or microdensitometric analyses of mammalian muscle fibers (Rosser et al. 1992; Sieck et al. 1995; Quiroz-Rothe and Rivero 2004). It is thought that fibers relying upon oxidative metabolism may require smaller diameters to reduce the diffusion distance of oxygen to mitochondria for oxidative metabolism (Rosser et al. 1992; Sieck et al. 1995). Although comparable quantitative analyses of fibers within the posthatch chicken pectoralis have not been undertaken, qualitative histochemical studies of this muscle have revealed that the smaller fiber profiles are more oxidative than the larger profiles (George and Berger 1966; Rosser and George 1986). As the smaller fiber profiles are fiber ends, it can be deduced that fiber ends in the chicken pectoralis are probably more oxidative than the other regions of the fibers. Studies of mammalian muscle fibers have shown a direct correlation between oxidative capacity and capillary density (number of capillaries/fiber area) (Quiroz-Rothe and Rivero 2004). In chicken muscle, smaller diameter fibers have higher capillary densities (Snyder 1995; Hoving-Bolink et al. 2000). SC nuclei tend to be more concentrated near capillaries (Schultz and McCormick 1994; Christov et al. 2007). Thus, our results showing a strong inverse correlation between fiber diameter and SC frequency throughout development of the chicken pectoralis could be related to higher capillary densities associated with smaller diameter, more oxidative fiber profiles. Greater capillary density at fiber ends should result in greater numbers of SCs. Christov et al. (2007) demonstrated that endothelial cells of capillaries specifically enhanced SC growth through a variety of growth factors.
Further study is required to address questions arising from our findings. Are a greater proportion of SCs active at the ends than elsewhere along the fibers? To ascertain this, active SCs could be identified by immunolabeling with antibodies against antigens associated with SC proliferation such as proliferating cell nuclear antigen or the myogenic regulatory factor MyoD, or by experimentally introducing bromodeoxyuridine to the live animals to label DNA of proliferating cells (Yablonka-Reuveni and Rivera 1994; Yablonka-Reuveni et al. 1999; Zammit et al. 2006). Can our findings of high SC numbers at the ends of fibers in posthatch chicken pectoralis be extrapolated to muscles of postnatal mammals? Studies showing that sarcomeres or newly synthesized proteins are added to the ends of growing postnatal muscle fibers have utilized primarily mammalian models (Goldspink 2003). Thus, one would anticipate higher concentrations of satellite cells at the ends of mammalian muscle fibers. However, the majority of studies of muscle development utilize mice or rats as experimental models. The fibers within the muscles of these small laboratory rodents generally extend for most of the short muscle length and are attached to the tendon at each end (Burkholder et al. 1994; Sheard et al. 1999). These may not be the best models for studying longitudinal growth in muscle fibers, as most fiber ends are confined to relatively narrow zones near the myotendinous junctions. In comparison, better models may be found within the less frequently studied muscles of larger mammals in which fibers are also relatively short but with the majority arranged in series terminating intrafascicularly (Gaunt and Gans 1992; Sheard et al. 1999) as do those in the avian pectoralis (Gaunt and Gans 1993). These models offer numerous tapered fiber ends that are easily accessed throughout the belly of the muscle. In the present study we have used a muscle rich in fiber ends throughout its belly to show that SCs are more concentrated (closer together) and at a greater frequency (#SC nuclei/all nuclei within basal laminae) within growing posthatch fiber ends.
Acknowledgments
The College of Medicine, University of Saskatchewan and the Jordan University of Science and Technology provided funds for M.Z.A. Z.Y.R is supported by the National Institute on Aging, National Institutes of Health (Grants AG-021566 and AG-013798) and the U.S. Department of Agriculture (USDA) Cooperative State Research, Education and Extension Service (NRI, 2003-35206-12843). A Discovery Grant awarded to B.W.C.R. from the Natural Sciences and Engineering Research Council of Canada provided funds for this study.
We thank Dr. Everett Bandman of the Department of Food Sciences and Technology, University of California, for the generous gift of the anti-neonatal MyHC antibody. Antibody against Pax7 developed by A. Kawakami was obtained from the Developmental Studies Hybridoma Bank developed under the auspices of the National Institute of Child Health and Human Development (NICHD) and maintained by the Department of Biological Sciences, University of Iowa. Tonya McGowan, University of Saskatchewan, assisted with preparation of the final version of the figures.
References
- Allen DL, Roy RR, Edgerton VR (1999) Myonuclear domains in muscle adaptation and disease. Muscle Nerve 22:1350–1360 [DOI] [PubMed] [Google Scholar]
- Allouh MZ, Rosser BWC (2006) Greater frequency and concentration of satellite cells at the ends of developing skeletal muscle fibers. FASEB J 20:A29. [DOI] [PMC free article] [PubMed] [Google Scholar]
- Asakura A, Seale P, Girgis-Gabardo A, Rudniki MA (2002) Myogenic specification of side population cells in skeletal muscle. J Cell Biol 159:123–134 [DOI] [PMC free article] [PubMed] [Google Scholar]
- Bandman E (1985) Continued expression of neonatal myosin heavy chain in adult dystrophic skeletal muscle. Science 227:780–782 [DOI] [PubMed] [Google Scholar]
- Bandman E, Rosser BWC (2000) Evolutionary significance of myosin heavy chain heterogeneity in birds. Microsc Res Tech 50:473–491 [DOI] [PubMed] [Google Scholar]
- Bartnik BL, Waldbillig DM, Bandman E, Rosser BWC (1999) Persistent expression of developmental myosin heavy chain isoforms in the tapered ends of adult pigeon pectoralis muscle fibres. Histochem J 31:321–329 [DOI] [PubMed] [Google Scholar]
- Berggren K, Ezerman EB, McCaffery P, Forehand CJ (2001) Expression and regulation of retinoic acid synthetic enzyme RALDH-2 in the embryonic chicken wing. Dev Dyn 222:1–16 [DOI] [PubMed] [Google Scholar]
- Burkholder TJ, Fingado B, Baron S, Lieber RL (1994) Relationship between muscle fiber types and sizes and muscle architectural properties in the mouse hindlimb. J Morphol 221:177–190 [DOI] [PubMed] [Google Scholar]
- Castillo de Maruenda E, Franzini-Armstrong C (1978) Satellite and invasive cells in frog sartorius muscle. Tissue Cell 10:749–772 [DOI] [PubMed] [Google Scholar]
- Charge SBP, Rudnicki MA (2004) Cellular and molecular regulation of muscle regeneration. Physiol Rev 84:209–238 [DOI] [PubMed] [Google Scholar]
- Christov C, Chretien F, Abou-Khalil R, Bassez G, Vallet G, Authier F-J, Bassaglia Y, et al. (2007) Muscle satellite cells and endothelial cells: close neighbours and privileged partners. Mol Biol Cell 18:1397–1409 [DOI] [PMC free article] [PubMed] [Google Scholar]
- Collins CA, Olsen I, Zammit PS, Heslop L, Petrie A, Partridge TA, Morgan JE (2005) Stem cell function, self-renewal, and behavioral heterogeneity of cells from the adult muscle satellite cell niche. Cell 122:289–301 [DOI] [PubMed] [Google Scholar]
- Day K, Shefer G, Richardson JB, Enikolopov G, Yablonka-Reuveni Z (2007) Nestin-GFP reporter expression defines the quiescent state of skeletal muscle satellite cells. Dev Biol 304:246–259 [DOI] [PMC free article] [PubMed] [Google Scholar]
- Edgerton VR, Roy RR (1991) Regulation of skeletal muscle fiber size, shape and function. J Biomech 24:123–133 [DOI] [PubMed] [Google Scholar]
- Ennion S, Wilkes D, Gauvry L, Alami-Durante H, Goldspink G (1999) Identification and expression analysis of two developmentally regulated myosin heavy chain gene transcripts in carp (Cyprinus carpio). J Exp Biol 202:1081–1090 [DOI] [PubMed] [Google Scholar]
- Gaunt AS, Gans C (1992) Serially arranged myofibers: an unappreciated variant in muscle architecture. Experientia 48:864–868 [Google Scholar]
- Gaunt AS, Gans C (1993) Variations in the distribution of motor end-plates in the avian pectoralis. J Morphol 215:65–88 [DOI] [PubMed] [Google Scholar]
- George JC, Berger AJ (1966) Avian Myology. New York, Academic Press
- Gibson MC, Schultz E (1983) Age-related differences in absolute numbers of skeletal muscle satellite cells. Muscle Nerve 6:574–580 [DOI] [PubMed] [Google Scholar]
- Golding JD, Rigley-MacDonald ST, Juurlink BHJ, Rosser BWC (2006) The effect of glutamine on locomotor performance and skeletal muscle myosins following spinal cord injury in rats. J Appl Physiol 101:1045–1052 [DOI] [PubMed] [Google Scholar]
- Goldspink G (2003) Gene expression in muscle in response to exercise. J Muscle Res Cell Motil 24:121–126 [DOI] [PubMed] [Google Scholar]
- Goldspink G, Yang SY (1999) Muscle structure, development and growth. In Richardson RI, Mead GC, eds. Poultry Meat Science. Wallingford, Oxfordshire, UK, CABI Publishing, 3–18
- Halevy O, Piestun Y, Allouh MZ, Rosser BWC, Rinkevich Y, Rashef R, Rozenboim I, et al. (2004) Pattern of Pax7 expression during myogenesis in the posthatch chicken establishes a model for satellite cell differentiation and renewal. Dev Dyn 231:489–502 [DOI] [PubMed] [Google Scholar]
- Hall ZW, Ralston E (1989) Nuclear domains in muscle cells. Cell 59:771–772 [DOI] [PubMed] [Google Scholar]
- Hawke TJ, Garry DJ (2001) Myogenic satellite cells: physiology to molecular biology. J Appl Physiol 91:534–551 [DOI] [PubMed] [Google Scholar]
- Hikida RS, Walsh S, Barylski N, Campos G, Hagerman FC, Staron RS (1998) Is hypertrophy limited in elderly muscle fibers? A comparison of elderly and young strength-trained men. Basic Appl Myol 8:419–427 [Google Scholar]
- Hoving-Bolink AH, Kranen RW, Klont RE, Gerritsen CLM, de Greef KH (2000) Fibre area and capillary supply in broiler breast muscle in relation to productivity and ascites. Meat Sci 56:397–402 [DOI] [PubMed] [Google Scholar]
- Hughes SM, Blau HM (1990) Migration of myoblasts across basal lamina during skeletal muscle development. Nature 345:350–353 [DOI] [PubMed] [Google Scholar]
- Kuang S, Charge SB, Seale P, Huh M, Rudnicki MA (2006) Distinct roles for Pax7 and Pax3 in adult regenerative myogenesis. J Cell Biol 172:103–113 [DOI] [PMC free article] [PubMed] [Google Scholar]
- Lemischka I (1999) The power of stem cells reconsidered? Proc Natl Acad Sci USA 96:14193–14195 [DOI] [PMC free article] [PubMed] [Google Scholar]
- Lipton BH, Schultz E (1979) Developmental fate of skeletal muscle satellite cells. Science 205:1291–1294 [DOI] [PubMed] [Google Scholar]
- MacIntosh BR, Gardiner PF, McComas AJ (2006) Skeletal muscle form and function. Champaign, IL, Human Kinetics
- Mauro A (1961) Satellite cell of skeletal muscle fibers. J Biophys Biochem Cytol 9:493–498 [DOI] [PMC free article] [PubMed] [Google Scholar]
- Moore LA, Arrizubieta MJ, Tidyman WE, Herman LA, Bandman E (1992) Analysis of the chicken myosin fast heavy chain family: localization of isoform-specific antibody epitopes and regions of divergence. J Mol Biol 225:1143–1151 [DOI] [PubMed] [Google Scholar]
- Morgan JE, Pagel CN, Sherratt T, Partridge TA (1993) Long-term persistence and migration of myogenic cells injected into pre-irradiated muscles of mdx mice. J Neurol Sci 115:191–200 [DOI] [PubMed] [Google Scholar]
- Morrison JI, Loof S, He PP, Andras S (2006) Salamander limb regeneration involves the activation of a multipotent skeletal muscle satellite cell population. J Cell Biol 172:433–440 [DOI] [PMC free article] [PubMed] [Google Scholar]
- Moss FP, Leblond CP (1971) Satellite cells as the source of nuclei in muscles of growing rats. Anat Rec 170:421–435 [DOI] [PubMed] [Google Scholar]
- Muir AR (1970) The satellite cell. In: Mauro A, Shafiq SA, Milhorat AT, eds. Regeneration of Striated Muscle, and Myogenesis. International Congress Series No. 218. Amsterdam, Excerpta Medica, 91–100
- Novotova M, Uhrik B (1992) Structural characteristics and distribution of satellite cells along crayfish muscle fibers. Experientia 48:593–596 [DOI] [PubMed] [Google Scholar]
- Ohira Y, Tanaka T, Yoshinaga T, Kawano F, Nomura T, Nonaka I, Allen DL, et al. (2001) Ontogenetic, gravity dependent development of rat soleus muscle. Am J Physiol Cell Physiol 280:C1008–1016 [DOI] [PubMed] [Google Scholar]
- Paul AC, Rosenthal N (2002) Different modes of hypertrophy in skeletal muscle fibers. J Cell Biol 156:751–761 [DOI] [PMC free article] [PubMed] [Google Scholar]
- Quiroz-Rothe E, Rivero J-LL (2004) Coordinated expression of myosin heavy chains, metabolic enzymes, and morphological features of porcine skeletal muscle fiber types. Microsc Res Tech 65:43–61 [DOI] [PubMed] [Google Scholar]
- Ralston E, Lu Z, Biscocho N, Soumaka E, Mavroidis M, Prats C, Lomo T, et al. (2006) Blood vessels and desmin control the positioning of nuclei in skeletal muscle fibers. J Cell Physiol 209:874–882 [DOI] [PubMed] [Google Scholar]
- Relaix F, Rocancourt D, Mansouri A, Buckingham M (2005) A Pax3/Pax7-dependent population of skeletal muscle progenitor cells. Nature 435:948–953 [DOI] [PubMed] [Google Scholar]
- Rosser BWC, Dean MS, Bandman E (2002) Myonuclear domain size varies along the lengths of maturing skeletal muscle fibers. Int J Dev Biol 46:747–754 [PubMed] [Google Scholar]
- Rosser BWC, Farrar CM, Crellin NK, Andersen LB, Bandman E (2000) Repression of myosin isoforms in developing and denervated skeletal muscle fibers originates near motor endplates. Dev Dyn 217:50–61 [DOI] [PubMed] [Google Scholar]
- Rosser BWC, George JC (1986) The avian pectoralis: histochemical characterization and distribution of muscle fiber types. Can J Zool 64:1174–1185 [Google Scholar]
- Rosser BWC, Norris BJ, Nemeth PM (1992) Metabolic capacity of individual muscle fibers from different anatomical locations. J Histochem Cytochem 40:819–825 [DOI] [PubMed] [Google Scholar]
- Rosser BWC, Waldbillig DM, Lovo SD, Armstrong JD, Bandman E (1995) Myosin heavy chain expression within the tapered ends of skeletal muscle fibers. Anat Rec 242:462–470 [DOI] [PubMed] [Google Scholar]
- Roth SM, Martel GF, Ivey FM, Lemmer JT, Metter EJ, Hurley BF, Rogers MA (2000) Skeletal muscle satellite cell populations in healthy young and older men and women. Anat Rec 260:351–358 [DOI] [PubMed] [Google Scholar]
- Sajko S, Kubinova L, Kreft M, Dahmane R, Wernig A, Erzen I (2002) Improving methodological strategies for satellite cells counting in human muscle during ageing. Image Anal Stereol 21:7–12 [Google Scholar]
- Schmalbruch H (1977) Regeneration of soleus muscle of the rat auto-grafted in toto, as studied by electron microscopy. Cell Tissue Res 177:159–180 [DOI] [PubMed] [Google Scholar]
- Schmalbruch H, Hellhammer U (1977) The number of nuclei in adult rat muscles with special reference to satellite cells. Anat Rec 189:169–175 [DOI] [PubMed] [Google Scholar]
- Schultz E, Chamberlain C, McCormick KM, Mozdziak PE (2006) Satellite cells express distinct patterns of myogenic proteins in immature skeletal muscle. Dev Dyn 235:3230–3239 [DOI] [PubMed] [Google Scholar]
- Schultz E, McCormick KM (1994) Skeletal muscle satellite cells. Rev Physiol Biochem Pharmacol 123:213–257 [DOI] [PubMed] [Google Scholar]
- Seale P, Rudnicki MA (2000) A new look at the origin, function and “stem-cell” status of muscle satellite cells. Dev Biol 218:115–124 [DOI] [PubMed] [Google Scholar]
- Seale P, Sabourin LA, Girgis-Gabardo A, Mansouri A, Gruss P, Rudnicki MA (2000) Pax7 is required for the specification of myogenic satellite cells. Cell 102:777–786 [DOI] [PubMed] [Google Scholar]
- Sewry CA, Dubowitz V (2001) Histochemistry and immunocytochemistry of muscle in health and disease. In Karpati G, Hilton-Jones D, Griggs RC, eds. Disorders of Voluntary Muscle. 7th ed. Cambridge, UK, Cambridge University Press, 251–282
- Sheard PW, McHannigan P, Duxson MJ (1999) Single and paired motor unit performance in skeletal muscles: comparison between simple and series-fibered muscles from the rat and the guinea pig. Basic Appl Myol 9:79–87 [Google Scholar]
- Shefer G, Van de Mark DP, Richardson JB, Yablonka-Reuveni Z (2006) Satellite-cell pool size does matter: defining the myogenic potency of aging skeletal muscle. Dev Biol 294:50–66 [DOI] [PMC free article] [PubMed] [Google Scholar]
- Shi X, Garry DJ (2006) Muscle stem cells in development, regeneration, and disease. Genes Dev 20:1692–1708 [DOI] [PubMed] [Google Scholar]
- Sieck GC, Zhan W-Z, Prakash YS, Daood MJ, Watchko JF (1995) SDH and actomyosin ATPase activities of different fiber types in rat diaphragm muscle. J Appl Physiol 79:1629–1639 [DOI] [PubMed] [Google Scholar]
- Snow M (1977) The effect of aging on satellite cells in skeletal muscles of mice and rats. Cell Tissue Res 185:399–408 [DOI] [PubMed] [Google Scholar]
- Snow M (1981) Satellite cell distribution within the soleus muscle of the adult mouse. Anat Rec 201:463–469 [DOI] [PubMed] [Google Scholar]
- Snyder GK (1995) Capillary growth in chick skeletal muscle with normal maturation and hypertrophy. Respir Physiol 102:293–301 [DOI] [PubMed] [Google Scholar]
- Swatland HJ (1994) Structure and Development of Meat Animals and Poultry. Lancaster, PA, Technomic
- Tisay KT, Key B (1999) The extracellular matrix modulates olfactory neurite outgrowth on ensheathing cells. J Neurosci 19:9890–9899 [DOI] [PMC free article] [PubMed] [Google Scholar]
- Trotter JA (1993) Functional morphology of force transmission in skeletal muscle. A brief review. Acta Anat (Basel) 146:205–222 [DOI] [PubMed] [Google Scholar]
- Tsujimura T, Kinoshita M, Abe M (2006) Response of rabbit skeletal muscle to tibial lengthening. J Orthop Sci 11:185–190 [DOI] [PubMed] [Google Scholar]
- Vanden Berge JC, Zweers GA (1993) Myologia. In Baumel JJ, King AS, Breazile JE, Evans HE, Vanden Berge JC, eds. Handbook of Avian Anatomy: Nomina Anatomica Avium. 2nd ed. Cambridge, MA, The Nuttall Ornithological Club, 189–247
- Verdijk LB, Koopman R, Schaart G, Meijer K, Savelberg HH, van Loon LJ (2007) Satellite cell content is specifically reduced in type II skeletal muscle fibers in the elderly. Am J Physiol Endocrinol Metab 292:E151–157 [DOI] [PubMed] [Google Scholar]
- Wang XD, Kawano F, Matsuoka Y, Fukunaga K, Terada M, Sudoh M, Ishihara A, et al. (2006) Mechanical load-dependent regulation of satellite cell and fiber size in rat soleus muscle. Am J Physiol Cell Physiol 290:C981–989 [DOI] [PubMed] [Google Scholar]
- Williams PE, Goldspink G (1971) Longitudinal growth of striated muscle fibers. J Cell Sci 9:751–767 [DOI] [PubMed] [Google Scholar]
- Winchester PK, Gonyea WJ (1992) A quantitative study of satellite cells and myonuclei in stretched avian slow tonic muscle. Anat Rec 232:369–377 [DOI] [PubMed] [Google Scholar]
- Wozniak AC, Kong J, Bock E, Pilipowicz O, Anderson JE (2005) Signaling satellite cell activation in skeletal muscle: markers, models, stretch, and potential alternate pathways. Muscle Nerve 31:283–300 [DOI] [PubMed] [Google Scholar]
- Yablonka-Reuveni Z, Anderson JE (2006) Satellite cells from dystrophic (mdx) mice display accelerated differentiation in primary cultures and in isolated myofibers. Dev Dyn 235:203–212 [DOI] [PubMed] [Google Scholar]
- Yablonka-Reuveni Z, Rivera AJ (1994) Temporal expression of regulatory and structural muscle proteins during myogenesis of satellite cells on isolated adult rat fibers. Dev Biol 164:588–603 [DOI] [PMC free article] [PubMed] [Google Scholar]
- Yablonka-Reuveni Z, Seger R, Rivera AJ (1999) Fibroblast growth factor promotes recruitment of skeletal muscle satellite cells in young and old rats. J Histochem Cytochem 47:23–42 [DOI] [PubMed] [Google Scholar]
- Zammit PS, Golding JP, Nagata Y, Hudon V, Partridge TA, Beauchamp JR (2004) Muscle satellite cells adopt divergent fates: a mechanism for self-renewal? J Cell Biol 166:347–357 [DOI] [PMC free article] [PubMed] [Google Scholar]
- Zammit PS, Partridge TA, Yablonka-Reuveni Z (2006) The skeletal muscle satellite cell: the stem cell that came in from the cold. J Histochem Cytochem 54:1177–1191 [DOI] [PubMed] [Google Scholar]
- Zhang M, McLennan IS (1995) During secondary myotube formation, primary myotubes preferentially absorb new nuclei at their ends. Dev Dyn 204:168–177 [DOI] [PubMed] [Google Scholar]