

Abstract
NAD+ is a substrate for many enzymes, including poly(ADP-ribose) polymerases and sirtuins, which are involved in fundamental cellular processes including DNA repair, stress responses, signaling, transcription, apoptosis, metabolism, differentiation, chromatin structure, and life span. Because these molecular processes are important early in cancer development, we developed a model to identify critical NAD-dependent pathways potentially important in early skin carcinogenesis. Removal of niacin from the cell culture medium allowed control of intracellular NAD. Unlike many non-immortalized human cells, HaCaT keratinocytes, which are immortalized and have a mutant p53 and aberrant NF-kB activity, become severely NAD depleted but divide indefinitely under these conditions. Niacin deficient HaCaTs develop a decreased growth rate due to an increase in apoptotic cells and an arrest in the G2/M phase of the cell cycle. Long- term survival mechanisms in niacin deficient HaCats involve accumulation of reactive oxygen species and increased DNA damage. These alterations result, at least in part, from increased expression and activity of NADPH oxidase, whose downstream effects can be reversed by nicotinamide or NADPH oxidase inhibitors. Our data support the hypothesis that glutamine is a likely alternative energy source during niacin deficiency and we suggest a model for NADPH generation important in ROS production.
Keywords: niacin, nicotinamide, NAD, NOX, PARP, sirtuins, ROS
Introduction
Niacin (Vitamin B3) is a water-soluble vitamin that occurs in two forms: nicotinic acid and nicotinamide. Both nicotinic acid and nicotinamide are dietary precursors for the synthesis of nicotinamide adenine dinucleotide, NAD(H), and related coenzymes, NADP(H). In addition to its role as a co-factor in redox reactions and as a regulator of the redox state (NAD+/NADH), NAD+ functions as substrate for numerous classes of ADP-ribosyl transferases involved in cellular processes including transcription, calcium homeostasis, DNA repair, cell death, neoplastic transformation, etc [1, 2]. Considerable evidence now indicates that the relative NAD+ content of cells can influence cellular responses to genomic damage by multiple mechanisms. For example, NAD+ is a substrate for the nuclear enzymes poly(ADP-ribose) polymerases (PARPs), which are important in DNA damage responses, including repair, maintenance of genomic stability, signaling following stress responses that influences apoptosis, telomere function, transcription regulation, and numerous other cellular functions [3-6]. Interestingly, PARP-1 functions both as a structural component of chromatin and a modulator of chromatin structure through its intrinsic enzymatic activity, promoting the formation of compact, transcriptionally repressed chromatin structures [7]. Furthermore, NAD+ is a substrate for NAD+-dependent protein deacetylases (sirtuins), which have been reported to function in stress responses, apoptosis, transcriptional regulation, metabolism, differentiation, and aging [8-11]. As a specific example, the action of sirtuins in histone deacetylation leads to a more compact chromatin structure and gene silencing. These enzymes also appear to protect sensitive areas of chromatin, such as telomeres, against translocation events and to play a role in extended life span associated with caloric restriction [12].
In vitro as well as animal studies indicate that modulation of NAD+ by nutritional control results in altered cellular processes and sensitivity to DNA damage. In human cells, niacin deficiency has been shown to alter the expression of p53, induce inherent genomic instability, and reduce survival following exposure to solar simulated light [13, 14]. Conversely, increased NAD+ or more active NAD biosynthesis allows cells to recover more efficiently after DNA damage [13]. In animal studies, niacin deficiency has been shown to cause changes in NAD+ and poly(ADP-ribose) metabolism altering p53 expression, increasing genomic instability, impairing cellular responses to DNA damage, and increasing cancer incidence [15-19]. In human subjects, NAD content has been inversely correlated with malignant phenotype [13, 20]. Preliminary data also suggest that niacin may have protective effects against DNA damaging agents [21, 22]. Thus, niacin may limit skin damage and consequently skin cancer by targeting multiple mechanisms including reduction of DNA damage and optimizing responses to DNA damage.
The turnover of NAD as a substrate by numerous classes of enzymes suggests that the flux of niacin through cellular pyridine nucleotides may be much greater than previously thought and may influence cellular regulation in a highly complex manner. Since the maintenance and regulation of cellular NAD(P)(H) content and its influence on cell functions are poorly understood, we have developed a cell culture model that allows assessment of pathways regulated by NAD(P) content. In this study, we utilize nicotinamide restriction in cultured HaCaT keratinocytes to identify NAD dependent signaling events that may be critical in early skin carcinogenesis. This cell line is derived from normal human skin and has been shown to exhibit a differentiation profile comparable with normal human keratinocytes [23]. Despite the altered and unlimited growth potential, these cells have been reported to form an orderly structured and differentiated epidermal tissue after transplantation on to athymic nude mice [23]. However, HaCaT cells exhibit UV-B type-specific mutations on the p53 tumor suppressor gene [24], and aberrant NF-kB signaling and altered responses to UVB [25], thus they represent an early stage of precancerous skin cells. We have used this model to test the hypothesis that restricted nicotinamide and NAD+ status, under conditions where cells continue to proliferate indefinitely, allow identification of NAD dependent signaling pathways involved in the early responses to DNA damage and early events in skin carcinogenesis.
Materials and Methods
Cell Culture and Growth Measurements
The established cell line of human epidermal keratinocytes (HaCaT cells), a gift from Dr. Norbert Fusenig (German Cancer Research Center, Heidelberg, Germany), was routinely cultured in Dulbecco's Modified Eagle Medium (DMEM) containing 10% fetal bovine serum and kept in a humidified atmosphere containing 5% CO2 at 37°C. For NAD(P) modulation, cells were grown in DMEM (Gibco BRL), 10% dialyzed fetal bovine serum (Gibco BRL) and with addition of 33 μM nicotinamide (33 μM Nam) or without added nicotinamide (0 μM Nam). Cell number was measured by counting in a Z1 Coulter Counter (Beckman Coulter). Sensitivity to glutamate dehydrogenase (GDH) inhibition was performed using 0.1 μM 6-diazo-5-oxo-L-norleucine (DON) on cells grown in 33 μM Nam or 0 μM Nam for 7 days. Cell number was measured by counting in a Z1 Coulter Counter (Beckman Coulter).
Extraction and Assay of NAD(H) and NADP(H)
NAD+, NADP+, NADH and NADPH were extracted from cultured cells by homogenization in 1.0 M NaOH. For total NAD and NADP determination, half of the samples were immediately neutralized with 2.0 M H3PO4. The reduced pyridine nucleotides were then oxidized by adding a 1/10 volume of 2.0 mM phenazine ethosulfate (Sigma Biochemical Co.). The sample was then brought to 1.0 M HClO4, incubated 10 min on ice, and the extract was centrifuged at 850 g for 10 min. The pellet was reserved for DNA quantification. The supernatant was neutralized with 1.0 M KOH, and the insoluble KclO4 was removed by centrifugation. The resulting supernatant was assayed for NAD+ and NADP+ as described previously [26, 27]. NADH and NADPH were extracted using the other half of each cell extract, which was heated to 60°C for 10 min to destroy oxidized pyridine nucleotides. The extract was neutralized with 2.0 M H3PO4, chilled and processed as described above for total NAD and NADP extraction and assay. NAD+ and NADP+ were calculated as the difference between total and reduced pyridine nucleotides. The pellet precipitated by HClO4 was dissolved in 0.5 M NaOH, and the DNA concentration was determined using the Quant-iT OliGreen Assay (Invitrogen). NAD(P)(H) values were normalized to DNA in each sample extracted.
Cell cycle analysis
Cell cycle analysis was performed using the method described by Krishan [28]. Cells were harvested, washed and resuspended in phosphate buffer saline (PBS) at a final concentration of 1-2·106 cells/ml. Cells were permeabilized and fixed using 3 volumes of cold absolute ethanol and incubated for 1 h at 4°C. Cells were washed twice with PBS and stained with propidium iodide at a final concentration of 50 μg/ml. Rnase A was added to a final concentration of 500 ng/ml and incubated for 1 h at 4°C. Samples were kept at 4°C until flow cytometry analysis.
Cell death analysis
Cell death was determined by Annexin-V-fluorescein isothiocyanate/propidium iodide dual staining of cells followed by flow cytometric analysis, as first described by Vermes et al [29]. HaCaT keratinocytes (100,000) were seeded on 35 mm dishes and 24 h later the medium was changed. Cells were harvested 24 h later, and cell staining was performed using an apoptosis detection kit according to the manufacturer's specifications (APO-AF; Sigma-Aldrich). In the figures shown, lower left quadrant (AnnexinV−, PI−) represents viable cells, lower right (AnnexinV+, PI−) is early apoptosis and upper right (AnnexinV+, PI+) is late apoptosis and necrosis.
Detection of intracellular oxidative stress by flow cytometry analysis
Intracellular reactive oxygen species (ROS) were analyzed by flow cytometry using dichlorofluorescein diacetate (DCF-DA; Sigma) as a specific dye probe which fluoresces upon oxidation by ROS. HaCaT keratinocytes were seeded at 1·105 cells per 35 mm dish. Cells loaded with DCF-DA (50 μg/ml) with light exclusion for 60 min were washed three times with PBS. Intracellular accumulation of fluorescent DCF-DA was measured (10,000 cells each) using a FACScan flow cytometer (Becton-Dickinson, San Jose, California). Histograms were analyzed with the software program Cell Quest (Becton-Dickinson).
Comet assay
HaCaT keratinocytes were seeded at 1·105 per dish on 35 mm culture dishes (Sarstedt, Newton, NC) and left overnight to attach. Cells were removed by trypsinization and analyzed by alkaline single cell gel electrophoresis (comet assay) based on the method of Singh et al. [30]. Briefly, 100 μL of cells (100,000 cells/ml) suspended in PBS were mixed with 100 μL of 0.5% low melting point agarose (Sigma) and layered on CometSlides (Trevigen, Gaithersburg, MD). The mixture was allowed to solidify at 4°C for 15 min on a metal plate. Cells were then exposed for 1 h at 4°C to freshly prepared lysis buffer (2.5 M NaCl, 100 mM EDTA, 1% Triton, and 10 mM Tris, adjusted to pH 10 with NaOH). Following cell lysis, the slides were incubated with freshly prepared alkali buffer at room temperature for 40 min to allow DNA denaturation and unwinding. Then, the slides were placed in a horizontal electrophoresis box and filled with chilled, freshly prepared alkali buffer (300 mM NaOH, 1 mM EDTA, pH >13) at 4°C and electrophoresis was carried out by a constant electric current of 300 mA for 23 min. After electrophoresis, the slides were neutralized with three 5 min washes in 0.4 mol/L Tris-HCl (pH 7.4). Finally, the slides were fixed in 100% ethanol for 5 min and stored in the dark at room temperature.
Quantification of DNA Damage
Immediately prior to imaging, comet slides were hydrated and stained by exposure to 1 mg/mL ethidium bromide for 15 min. Comets were analyzed using fluorescence based digital imaging system. Tail moments were calculated using Comet Assay Software Project (Casp) imaging software.
Measurement of reduced and oxidized glutathione
Reduced (GSH) and oxidized (GSSG) glutathione was measured using the Bioxytech GSH/GSSG-412 Assay Kit (OxisResearch, Portland, OR). 3·106 cells were detached using trypsin and centrifuged at 1300 g for 10 min at 4°C. The cells were resuspended in 300 μL PBS. From this point the samples were treated and assayed following the manufacturer's protocol for whole blood assay.
RNA preparation and CodeLink microarray analyses
Total RNA was prepared from cultured HaCaT keratinocytes using the Rneasy purification system (Qiagen) according to the manufacturer's instructions. The RNA concentration was determined using an Eppendorf BioPhotometer (Eppendorf North America, Westbury, NY, USA). To test the quality of the RNA, 1 μL (25-500 ng/μl) of the sample was analyzed on the Agilent 2100 Bioanalyzer (Agilent Technologies, Waldbronn, Germany) following the RNA 6000 Nano Chip Series II Assay protocol. For the CodeLink Bioarray system, 2 μg of total RNA were processed according to the protocol established by the CodeLink Gene Expression System manual. Total RNA was processed through first-strand and second-strand cDNA synthesis followed by purification using the QIAquick PCR Purification Kit (Qiagen, Inc., Valencia, CA, USA). The cDNA was used for an In Vitro Transcription and biotin labeling and the resulting cRNA was cleaned using the Rneasy Mini Kit (Qiagen, Inc., Valencia, CA, USA). The cRNA was quantified using the Eppendorf BioPhotometer and Agilent 2100 Bioanalyzer and then 10 μg were fragmented and subsequently hybridized on CodeLink Bioarray: UniSet Human 20K I slides overnight for 18-24 h at 37°C with agitation (300 rpm). The bioarray was removed and the subsequent staining and washing was performed according to the CodeLink Gene Expression System: Single-Assay Bioarray Hybridization and Detection protocol (GE Healthcare Bio-Sciences, Piscataway, NJ, USA). Fluorescence images were acquired using the GenePix 4000B Microarray Scanner (Axon Instruments, Foster City, CA, USA) along with the GenePix Pro 5.1 Software. The scans were performed following the specifications established by GE for their CodeLink bioarrays. Briefly, the GenePix software settings were as follows, 635 nm wavelength, with a PMT voltage of 600 V and a laser power set at 100%. The pixel size was set at 10 μm, and the focus position at 0 μm. The tiff images created were then imported into the CodeLink Expression Analysis v4.0 Software (GE Healthcare Bio-Sciences, Piscataway, NJ, USA) where Bioarray QC readings were establish to test for hybridization efficiency and success. We used Loess normalization of the data using all the housekeeping genes present in the CodeLink bioarray as reference.
Real time RT-PCR
Total RNA was prepared from cultured HaCaT keratinocytes using the Rneasy purification system (Qiagen) according to the manufacturer's instructions. cDNA synthesis was performed with the TaqMan Reverse Transcription kit (Applied Biosystems) according to manufacturer's instructions using random hexamers and 1 μg of total RNA. For TaqMan-based real-time RT-PCR (qPCR) expression profiling, 25 ng of each cDNA were added to the TaqMan Universal PCR Master Mix along with the TaqMan MGB probes according to the manufacturer's instructions (Applied Biosystems). qPCR was performed essentially as described [32]. Primers and probes designed to specifically detect the human NOX5 (TaqMan Gene Expression Assay Hs00225846_m1) and NCF-2 (TaqMan Gene Expression Assay Hs00166416_m1) transcripts were purchased from Applied Biosystems. Real-time fluorescence monitoring was performed with the ABI Prism 7900 (Applied Biosystems). Relative expression levels of the various transcripts were determined by comparison against the housekeeping genes GAPDH and 18S rRNA. GAPDH expression was verified to be unaltered upon niacin deficiency by comparison against 18S rRNA. All expression measurements were performed in triplicate using three independently generated cDNA samples.
Results
NAD-modulation in HaCaT keratinocytes
To study the role of NAD-dependent pathways in skin and ultimately identify their role(s) in responses to DNA damage and skin carcinogenesis, we have developed an in vitro model in which intracellular NAD can be modulated by availability of precursors in the medium [27]. Nicotinamide is commonly the form of vitamin B3 found in cell culture media. For our model we omitted nicotinamide and used exhaustively dialyzed fetal bovine serum in the culture medium. HaCaT keratinocytes grown in this medium develop significantly reduced cellular NAD(H) concentrations as shown in Table I. Nicotinamide restriction reduced total intracellular NAD by >90% after 7 days and >99% after 14 days. The NADH/total NAD ratio (% NADH) increased at 7 days of restriction, but could not be measured at day 14 due to the fact that NADH fell below limits of detection. Thus, in this cell line, NAD can be nutritionally modulated over a large concentration range by controlling nicotinamide concentration in the culture medium and it appears that the NAD pool may become more reduced, at least early in the restriction phase. When we measured NADP(H) in control and nicotinamide-restricted cells at 14 days, we found that the total NADP pools are relatively preserved compared to NAD, decreasing to about 35% of controls, as shown in Table I. Interestingly, the percentage of reduced NADPH relative to the total NADP pool was maintained or slightly increased (60.4 ± 8.9 versus 65.7 ± 7.6) in restricted cells. These alterations in pyridine nucleotides were sustained indefinitely as long as cells were grown in medium with no added nicotinamide. The depletion in all pyridine nucleotide pools is reversed by addition of nicotinamide to the culture medium but usually requires approximately 48 h (data not shown).
Table I.
NAD(H), NADP(H) quantification and redox ratio in HaCaT cells growth with or without added nicotinamide
| Day 7 |
Day 14 |
|||
|---|---|---|---|---|
|
33 μM Nam (fmol/ng DNA) |
0 μM Nam (fmol/ng DNA) |
33 μM Nam (fmol/ng DNA) |
0 μM Nam (fmol/ng DNA) |
|
| Total NAD | 3968 ± 385 | 337 ± 77*** | 3657 ± 322 | 7 ± 3*** |
| NADH | 97 ± 19 | 45 ± 15* | 88 ± 23 | ND |
| NAD+ | 3871 ± 385 | 295 ± 83*** | 3567 ± 307 | 7 ± 3*** |
| % reduced | ||||
| NADH/Total NAD | 2.5 ± 0.5 | 13.2 ± 5.1* | 2.4 ± 0.6 | ND |
| Total NADP | 199 ± 12 | 80 ± 12*** | 320 ± 25 | 109 ± 14*** |
| NADPH | 113 ± 14 | 50 ± 10** | 181 ± 18 | 63 ± 4** |
| NADP+ | 86 ± 18 | 30 ± 16* | 141 ± 10 | 46 ± 15** |
| % reduced | ||||
| NADPH/Total NADP | 61.5 ± 10.1 | 55.8 ± 10.9 | 60.4 ± 8.9 | 65.7 ± 7.6 |
Shown are the mean ± SEM of 6 replicates from 2 independent experiments. ND, not detectable.
p < 0.05
p < 0.005
p < 0.0001.
p values were calculated comparing 0 μM Nam to the respective 33 μM Nam condition.
Nicotinamide-restricted HaCaTs divide indefinitely after establishing an altered growth rate
Under nicotinamide-restricted conditions, which lead to NAD depletion, HaCaT keratinocytes proliferate at the same rate as controls for approximately 7 days then develop a slower population doubling rate (77 h versus 48.8 h for control cells) that is constant and sustained indefinitely as shown in Figure 1A. Addition of nicotinamide at any time during the study in Figure 1A restored the original doubling rate (data not shown). Thus, growth rate was not affected until after NAD content was less than 10% of control cells and, surprisingly, growth was sustained indefinitely even though NAD was < 1% of that in control cells.
Fig. 1.

Effects of nicotinamide restriction on HaCaT keratinocytes. (A) Growth rates of HaCaT cells grown under control (33 μM Nam, squares), or restricted (0 μM Nam, triangles) conditions. Inset shows details of growth for days 0 to 21. Values correspond to duplicate samples (Mean ± SEM). (B) Cell viability was assessed for 33 μM Nam, 0 μM Nam and repleted cells using Annexin V/PI flow cytometry. Values represent percentage of viable cells from triplicate samples (Mean ± SEM). (C) Cell cycle analysis was assessed for 33 μM Nam (black) and 0 μM Nam (white). Bars represent the mean of triplicate analyses (± SEM) by PI fluorescence and flow cytometry. (D) DNA damage was analyzed by alkaline comet assay. Dots represent single cells (n=50 for day 7; n=100 for day 14); mean tail moment is shown by the lines. * p < 0.01, ** p < 0.001, *** p < 0.0001 versus control (Student's t-test).
Nicotinamide-restriction decreases cell viability and alters the cell cycle distribution in HaCaT keratinocytes
To study the mechanism(s) by which cells with reduced NAD establish an altered population doubling time, we hypothesized that cell death rates increase in restricted cells and/or that cell cycle check points are altered affecting cell cycle progression. Thus, cell death rates and cell cycle distribution were assessed after 7 days, the time at which no change in population doubling rate is yet detectable, and after 14 days of restriction, when the slower proliferation rate is established. As can be seen in Figure 1B, the viability of the control cell population is 91-94% at 7 and 14 days as assessed by Annexin V/PI staining and flow cytometry; however, cell death rates increased when cells were restricted for 14 days, dropping to approximately 85% viability (p < 0.0001). Addition of nicotinamide (repletion, Figure 1B) completely reversed this effect. In order to account for the observed changes in population doubling times by loss of cell viability alone, a decrease in viability of approximately 15% would be required, assuming no change in cell cycle progression. In averaging five repeated experiments, we observed an average reduction in viability of 8.9 ± 4.2%. These data suggest that NAD depletion may affect cell proliferation by an additional mechanism other than increased cell death. We examined the possibility that cell cycle progression may be altered by measuring cell cycle distribution in restricted cells. The results are shown in Figure 1C. We observe a small but significant increase, from 11.7 ± 1.6 to 17.4 ± 2.1 percent (p = 0.0004) of cells in G2/M-phase at day 7, despite the fact that no change in population doubling is observable yet at this time. An equivalent decrease in the percentage of cells in S-phase accompanied the G2/M alteration. The observed alterations in cell cycle distribution at day 7 may be an early indication of changes in keratinocytes undergoing nicotinamide restriction. After 14 days of depletion, the increase in percentage of cells in G2/M is elevated to 20.3 ± 1.1 (p < 0.0001), and is associated with a significant decrease of cells in both G1 and S phases. Thus both a delay at G2/M and a decrease in viability contribute to the increased doubling time observed in nicotinamide-restricted cells.
DNA damage is increased in NAD-depleted HaCaT keratinocytes
Since PARP-1 is known to play an important role in response to DNA damage and has a relatively high Km for NAD, we investigated whether NAD depletion plays a role in DNA damage that may contribute to altered cell cycle progression. We examined HaCaT keratinocytes for DNA single strand breaks and alkali labile sites using the alkaline comet assay [30]. As seen in Figure 1D, no detectable differences in comet tail moments were apparent between control and NAD-depleted cells prior to the observed changes in proliferation and cell viability rates (day 7); however, by day 14, we observed a significant increase of tail moment in NAD-depleted cells from 10.5 ± 0.9 to 27.1 ± 1.9 (p < 0.0001). Addition of nicotinamide reversed the DNA damage as measured by comet tail moments (11.9 ± 1.1). This increase in DNA damage likely contributes to the increased population doubling time that involves both increased cell death rates and G2/M arrest described above.
NAD-depletion increases ROS in HaCaT keratinocytes
In an attempt to identify possible causes of DNA damage in NAD-restricted cells, we quantified ROS in this model using the oxidation sensitive dye, DCF-DA, detected by flow cytometry as shown in Figure 2A. ROS increased 4-fold in NAD-depleted cells by day 14, from 37 ± 24 to 182 ± 70 relative fluorescence units (p < 0.0001). Restoring NAD by addition of nicotinamide (repletion) completely reversed the ROS accumulation. Thus, nicotinamide restriction and the subsequent NAD depletion resulted in ROS formation that is coincident with increased DNA damage, decreased viability and an increased accumulation of cells in G2/M.
Fig. 2.
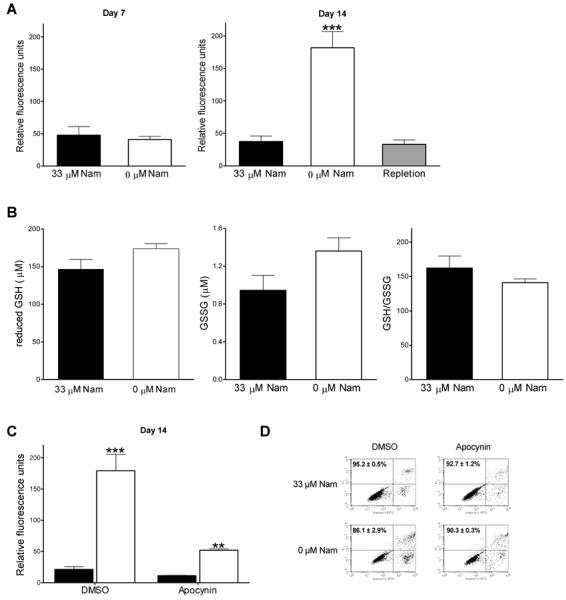
ROS accumulation in NAD-depleted HaCaT keratinocytes. (A) Determination of intracellular ROS (A) after 7 and 14 days. (B) reduced GSH (left), GSSG (middle), and GSH/GSSG ratio quantification 14 days of growth. (C) ROS after treatment with 0.3 mM apocynin. (D) Cell viability after treatment with 0.3 mM apocynin. 33 μM Nam (black), 0 μM Nam (white), or repleted (gray). All values represent the mean of triplicate samples (± SEM).* p < 0.01, ** p < 0.001, *** p < 0.0001 versus control (Student's t-test).
ROS accumulation and redox status in NAD-depleted HaCaT keratinocytes
Since NADPH is the ultimate source of reducing equivalents for cellular redox control and NADP(H) are synthesized from NAD, one possible explanation for the accumulation of ROS shown above may be that NAD restriction results in NADPH content that is limiting for redox control. In order to assess if the levels of NADPH remaining in NAD-restricted cells are sufficient to maintain the redox state of the cell, we measured GSH levels. As seen in Figure 2B, we found that control cells contain 146 ± 26 μM of reduced GSH, 0.9 ± 0.32 μM GSSG, with a GSH/GSSG ratio of 155 ± 59 and restricted cells contain 172 ± 14 μM of reduced GSH, 1.2 ± 0.01 μM GSSG, with a GSH/GSSG ratio of 141 ± 11 at day 14. These data show that the increased levels of ROS observed are not a result of insufficient reducing equivalents in the cell. Furthermore, in comparing the effects of nicotinamide restriction on the NAD and NADP nucleotide pools, the data show that NADP is preferentially maintained over NAD since the NAD pool is decreased to <1% while the NADP pool is maintained at 34% of control values (Table I).
NAD-depleted HaCaT keratinocytes have increased NOX activity
We hypothesized that the increased ROS levels observed in restricted cells are at least in part responsible for the DNA damage and decreased cell viability observed and; therefore, controlling the ROS production could decrease these effects. However, treatment with antioxidants including N-acetyl cysteine did not affect ROS accumulation in nicotinamide restricted cells (data not shown). DNA microarray analyses revealed (Table II) a 2-fold increase in the gene expression of NOX5 and a 4-fold increase for the NOX regulator p67phox in NAD-depleted cells, which was assessed also by qPCR, confirming increased expression at 8.7 ± 5.2-fold for the NOX5 gene and 4.4 ± 2.4-fold increase for the p67phox gene (Table II). Since NOX activity is a major source of ROS production in cells, we examined whether inhibiting NOX activity could block the ROS increase by treating NAD-depleted cells with the NOX inhibitor, apocynin. As shown in Figure 2C, treatment with apocynin significantly reduced ROS from 179 ± 45 to 52 ± 4 (p = 0.008) relative fluorescence units, while in control cells ROS values were essentially unaffected (21 ± 8 vs. 11 ± 1, p = 0.043). Furthermore, treatment with apocynin significantly reversed the decrease in cell viability as shown in Figure 2D. These data show that increased expression and activity of NOX is a significant contributor to the ROS accumulation in nicotinamide-restricted HaCaT keratinocytes, which in turn increases DNA damage and cell death.
Table II.
Microarray and real-time RT-PCR results for gene expression following 14 days of nicotinamide restriction.
| Gene | Genbank | Array | RT-PCR |
|---|---|---|---|
| NOX5 | NM_024505 | 1.77 | 8.7 ± 5.18 |
| p67phox | NM_000433 | 3.64 | 4.4 ± 2.39 |
| PAG | NM_014905 | 2.35 | n.a. |
| IDH2 | NM_002168 | 2.76 | n.a. |
| GDH | NM_005271 | 1.71 | n.a. |
CodeLink Microarray and qPCR results reported as fold change values relative to controls (33 μM Nam). Shown are mean ± SD of 3 replicates from 3 independent experiments. n.a., not assayed.
NAD-depleted HaCaT keratinocytes have increased sensitivity to GDH inhibition
Since the levels of NAD in niacin deficient cells are greatly reduced, it is likely that NAD-depleted cells are incapable to sustain their energy requirements solely by glycolysis. Therefore, niacin deficient cells would require an additional carbon source. One such source available from the cell culture media is glutamine. We hypothesized that if glutamine is a crucial carbon source for NAD-depleted cells, these cells would be far more sensitive than control cells if it was removed from the media. Completely eliminating glutamine from the media lead to cell death both in control and depleted cells (data not shown), showing that glutamine is an essential nutrient for HaCaT keratinocytes. In the cell, glutamine is converted to glutamate and this is further converted to α-ketoglutarate to be used as a source of energy (Figure 4). We, therefore, decided to inhibit GDH, the enzyme responsible for converting glutamate to α-ketoglutarate. As seen in Figure 3, NAD-depleted cells are more sensitive to low levels of the GDH inhibitor, DON, than control cells.
Fig. 4.

Model of NOX activation in nicotinamide-restricted HaCaT keratinocytes. Under NAD-depleted conditions, the ability of the cell to use glycolysis as a source of energy is greatly reduced. Cells can utilize glutamate, synthesized from glutamine in the culture medium as an energy source. Glutamate dehydrogenase (GDH) coverts glutamate to α-ketoglutarate, with reduction of NADP+ to NADPH. The activity of GDH may be regulated by SIRT4, which is dependent on NAD+; therefore, under NAD-depleted conditions, GDH activity may be upregulated providing α-ketoglutarate as a carbon source for TCA cycle intermediates and energy production. Additional NADPH may be generated by IDH2. NADPH accumulation from these reactions could support NOX dependent ROS formation and recycling of NADP+. In pre-cancerous cells, this ROS dependent signaling may lead to progression in carcinogenesis.
Fig. 3.

Effect of GDH inhibition on niacin deficient HaCaT keratinocytes. Growth rates of HaCaT cells grown under control (33 μM Nam, squares), or restricted (0 μM Nam, triangles) conditions in the presence (dotted line) or absence (continuous line) of DON. Values represent triplicate samples (Mean ± SEM).
Discussion
In this study, we developed a model to identify NAD-dependent pathways potentially important in early skin carcinogenesis. We show that nicotinamide restriction, and consequent NAD depletion, reversibly alters NAD(P)(H) pools, cell viability, cell cycle progression, and DNA stability. These alterations are affected at least in part by increased expression and activity of NOX leading to an accumulation of ROS which may provide a survival mechanism as has been shown in other cancer cells [33, 34]. Similar studies of nicotinamide restriction using a variety of normal human diploid cells (i.e. primary mammary epithelial cells, skin, lung and breast fibroblasts) that have not been immortalized showed that cells can grow in restricted nicotinamide, but do not undergo the alteration in growth rate as shown here for HaCat cells (data not shown).
When cultured in medium containing no added nicotinamide, HaCaT keratinocytes become depleted of NAD. NAD levels were maximally reduced after 4-5 population doublings (14 days). HaCaTs exhibit a slower growth following 7 days in medium with no added nicotinamide; however, they are able to grow indefinitely at a constant rate. These results confirm that human keratinocytes require the preformed vitamin, nicotinamide, in this case, to synthesize NAD utilizing the salvage pathway, as the synthesis of NAD from tryptophan through the de novo pathway seems to be absent. The data also show that when niacin is limiting, NADP pools are preferentially maintained as would be needed for biosynthetic precursors in perpetually dividing cells. We hypothesize that the minimal NAD content maintained in the HaCaT keratinocytes during restriction may derive from pyridine nucleotides that are tightly bound to serum proteins and are not removed by exhaustive dialysis, and can be scavenged and utilized by the salvage pathways for NAD biosynthesis.
The slower population doubling rate observed in the nicotinamide depleted cells results from both a G2/M delay (Figure 1C) and decreased cell viability (Figure 2B). Accumulation of cells in the G2/M-phase of cell cycle (Figure 1C) in the nicotinamide restricted HaCaTs is consistent with the increase in DNA damage seen in these cells, as shown by the alkaline comet assay (Figure 1D). These observations are in line with previous studies showing that inhibition of PARP-1, whose substrate is NAD+, results in G2/M arrest in a p53-independent manner [35-38]. Of particular interest is the observation that nicotinamide-restricted cells are able to proliferate indefinitely despite increased production of ROS and significant DNA damage. These conditions are known to cause instability in the genome, which may result in genetic alterations ultimately leading to progression of carcinogenesis.
Overproduction or insufficient scavenging of ROS can result in enhanced oxidative stress and DNA damage, which have been implicated in cancer initiation and promotion [39]. ROS formation is a particularly important down stream effector of UV damage [39, 40]. Studies have documented significant generation of ROS in a variety of cells, including cancer cells, which is usually the consequence of mitochondrial respiration and NADPH-oxidase (NOX) activity [41-43]. The reduction–oxidation (redox) status of a cell can directly alter cell growth and development, proliferation and survival by modulation of signal transduction pathways [44, 45]. In excess, ROS also can oxidatively damage DNA and other cellular macromolecules and lead to generation of a vicious cycle of stress through induction of reactive carbonyl species (RCS) [46]. ROS can induce membrane lipid peroxidation which leads to formation of RCS-type lipid breakdown products. RCS can then induce the formation of advance glycation endproducts sensitizer epitopes on skin proteins which can form more ROS upon light activation [46].
Since our data show that nicotinamide restriction maintains or increases the NADPH/total NADP ratio (Table I), we hypothesized and demonstrated that the accumulation of ROS measured in restricted cells (Figure 2D) is a result of increased NOX activity (Table II) and that ROS accumulation and subsequent effects on cell survival and DNA damage could be reversed with the NOX inhibitor apocynin (Figure 2D). Specifically, we identified NOX5 as a NOX family member expressed in HaCaT keratinocytes and showed that its expression and that of the regulator of other NOX family members, p67phox, are altered by NAD depletion (Table II).
Nicotinamide-restricted HaCaTs divide indefinitely under conditions where NAD content of the cells is less than 1% of control cells (Table I). The small amounts of residual NAD are likely to be compartmentalized in the mitochondria in order to maintain fundamental functions such as energy metabolism and electron transport chain activity. The low NAD impacts energy metabolism and utilization. Since NADH falls to undetectable levels, it is likely that utilization of glucose by glycolysis is greatly reduced and; therefore, these cells use an additional carbon source for energy. As discussed below, glutamine is likely an important carbon source for nicotinamide-restricted cells. We have shown that while control cells can proliferate in the presence of a glutaminase inhibitor, DON, nicotinamide-restricted cells cannot do so, demonstrating an increased dependence on glutamine for restricted cells (Figure 3). Figure 4 describes a potential altered metabolic pathway for nicotinamide-restricted cells and suggests a possible role of NAD in limiting these ROS generating pathways in control cells. We observe that NADPH accumulates preferentially above all other pyridine nucleotides. Thus, glutamine in the culture medium is likely the major carbon source for nicotinamide-restricted cells as it can be converted to glutamate by phosphate-activated glutaminase (PAG), whose expression in nicotinamide-restricted HaCaTs increased 2-fold (Table II). Glutamate dehydrogenase (GDH) can convert glutamate to the TCA cycle intermediate, α-ketoglutarate with generation of NADPH. This is one likely source for the observed NADPH generation under nicotinamide-restricted conditions. It is also interesting that recent reports suggest that SIRT3 and SIRT4, mitochondrial enzymes that use NAD+ as a substrate, modulate energy metabolism by regulating the activity of acetyl-CoA synthetase and GDH, respectively [47, 48]. SIRT4 has been reported to downregulate GDH activity by ADP-ribosylation [48]. A decrease in available substrate (NAD) for SIRT4 in nicotinamide-restricted cells may lead to upregulation of GDH, promoting utilization of glutamate as a source of energy, with the production of NADPH (Figure 4). The preferential generation of NADPH observed in nicotinamide-restricted cells may allow increased consumption by NOX leading to elevated ROS production and recycling of NADP+ to be further reduced by GDH. Sustained production of NADPH could also be derived from NADP+-specific isocitrate dehydrogenase (IDH2, Figure 4) whose expression is increased by 3-fold in nicotinamide-restricted cells (Table II). Preferential generation of NADPH via the pentose phosphate pathway is unlikely since microarray data show that the expression levels of glucose-6-phosphate dehydrogenase are extremely low (data not shown). The effect of nicotinamide restriction on ROS production is particularly relevant as it is thought that excessive oxidative damage to cellular macromolecules may play an important role in the initiation and promotion of carcinogenesis [49-52]. Glutamine utilization has been reported to be accompanied by ROS formation in immune cells [53] and implicated in cancer cell proliferation [54]. There are interesting analogies between HaCat cells exposed to the stress of nicotinamide restriction and those undergoing deficient autophagy. Autophagy requires a functional p53 and utilizes protein turnover for energy generation during metabolic stress [55]. Defective autophagy compromises the ability of cells to adapt to stress, resulting in insufficient ATP generation, damaged mitochondria and ROS accumulation [56]. Low ATP and elevated ROS/DNA damage may cause replication stress and DNA damage response activation that normally triggers cell cycle arrest or apoptosis and therefore act as a barrier to early carcinogenesis [57]. However, inactivation of p53 can result in defective p53-mediated check point activation and cell cycle arrest or apoptosis following DNA damage. In this case, concurrent inactivation of autophagy and apoptosis results in accumulated DNA damage during metabolic stress, enabling gene amplification and a permissive environment for genomic instability and cancer progression [57]. While further experimentation is needed to determine which of these scenarios is functional in nicotinamide restricted HaCaT cells, the data presented here suggest that NAD dependent pathways are involved in limiting ROS dependent signaling and DNA damage accumulation during early skin carcinogenesis by modulation of NOX activity. Thus, niacin status (NAD+ content) is a critical resistance factor for early skin carcinogenesis. Further, this model can be used to help identify NAD-dependent signaling pathways and to determine how these pathways are altered in common environmental causes of skin cancer (i.e. UV).
Acknowledgements
Debbie Sakiestewa performed flow cytometry analyses, the Genomics Core of the Arizona Cancer Center (NCI #CA23074) and the Southwest Environmental Health Sciences Center (NIEHS #ES06694) performed the DNA microarray analyses, and GE Healthcare Academic Array Proposal provided the Codelink arrays in a competitive grant to CAB. This research was supported in part by NIH (CA43894, CA106677, CA27502 and ES06694) and the Fulbright Scholar Program.
List of Abbreviations
- NAD
nicotinamide adenine dinucleotide
- NADH
reduced nicotinamide adenine dinucleotide
- NADP
nicotinamide adenine dinucleotide phosphate
- NADPH
reduced nicotinamide adenine dinucleotide phosphate
- PARP
poly (ADP-ribose) polymerase
- Nam
nicotinamide
- ROS
reactive oxygen species
- DCF-DA
dichlorofluorescein diacetate
- GSH
reduced glutathione
- NOX
NADP oxidase
- GAPDH
glyceraldehyde 3-phosphate dehydrogenase
- Km
Michaelis-Menten constant
- qPCR
real time reverse transcriptase polymerase chain reaction
- PAG
phosphate-activated glutaminase
- SIRT
NAD-dependent protein deacetylase
- IDH
isocitrate dehydrogenase
- GDH
glutamate dehydrogenase
Footnotes
Publisher's Disclaimer: This is a PDF file of an unedited manuscript that has been accepted for publication. As a service to our customers we are providing this early version of the manuscript. The manuscript will undergo copyediting, typesetting, and review of the resulting proof before it is published in its final citable form. Please note that during the production process errors may be discovered which could affect the content, and all legal disclaimers that apply to the journal pertain.
References
- 1.Ziegler M. New functions of a long-known molecule. Emerging roles of NAD in cellular signaling. Eur J Biochem. 2000;267:1550–1564. doi: 10.1046/j.1432-1327.2000.01187.x. [DOI] [PubMed] [Google Scholar]
- 2.Hassa PO, Haenni SS, Elser M, Hottiger MO. Nuclear ADP-ribosylation reactions in mammalian cells: where are we today and where are we going? Microbiol Mol Biol Rev. 2006;70:789–829. doi: 10.1128/MMBR.00040-05. [DOI] [PMC free article] [PubMed] [Google Scholar]
- 3.Jacobson MK, Jacobson EL. Discovering new ADP-ribose polymer cycles: protecting the genome and more. Trends Biochem Sci. 1999;24:415–417. doi: 10.1016/s0968-0004(99)01481-4. [DOI] [PubMed] [Google Scholar]
- 4.Durkacz BW, Omidiji O, Gray DA, Shall S. (ADP-ribose)n participates in DNA excision repair. Nature. 1980;283:593–596. doi: 10.1038/283593a0. [DOI] [PubMed] [Google Scholar]
- 5.Satoh MS, Lindahl T. Role of poly(ADP-ribose) formation in DNA repair. Nature. 1992;356:356–358. doi: 10.1038/356356a0. [DOI] [PubMed] [Google Scholar]
- 6.Oliver FJ, Menissier-de Murcia J, de Murcia G. Poly(ADP-ribose) polymerase in the cellular response to DNA damage, apoptosis, and disease. Am J Hum Genet. 1999;64:1282–1288. doi: 10.1086/302389. [DOI] [PMC free article] [PubMed] [Google Scholar]
- 7.Kim MY, Mauro S, Gevry N, Lis JT, Kraus WL. NAD+-dependent modulation of chromatin structure and transcription by nucleosome binding properties of PARP-1. Cell. 2004;119:803–814. doi: 10.1016/j.cell.2004.11.002. [DOI] [PubMed] [Google Scholar]
- 8.Cohen HY, Miller C, Bitterman KJ, Wall NR, Hekking B, Kessler B, Howitz KT, Gorospe M, de Cabo R, Sinclair DA. Calorie restriction promotes mammalian cell survival by inducing the SIRT1 deacetylase. Science. 2004;305:390–392. doi: 10.1126/science.1099196. [DOI] [PubMed] [Google Scholar]
- 9.Denu JM. Vitamin B3 and sirtuin function. Trends Biochem Sci. 2005;30:479–483. doi: 10.1016/j.tibs.2005.07.004. [DOI] [PubMed] [Google Scholar]
- 10.Vaziri H, Dessain SK, Ng Eaton E, Imai SI, Frye RA, Pandita TK, Guarente L, Weinberg RA. hSIR2(SIRT1) functions as an NAD-dependent p53 deacetylase. Cell. 2001;107:149–159. doi: 10.1016/s0092-8674(01)00527-x. [DOI] [PubMed] [Google Scholar]
- 11.Motta MC, Divecha N, Lemieux M, Kamel C, Chen D, Gu W, Bultsma Y, McBurney M, Guarente L. Mammalian SIRT1 represses forkhead transcription factors. Cell. 2004;116:551–563. doi: 10.1016/s0092-8674(04)00126-6. [DOI] [PubMed] [Google Scholar]
- 12.Lin SJ, Ford E, Haigis M, Liszt G, Guarente L. Calorie restriction extends yeast life span by lowering the level of NADH. Genes Dev. 2004;18:12–16. doi: 10.1101/gad.1164804. [DOI] [PMC free article] [PubMed] [Google Scholar]
- 13.Jacobson EL, Shieh WM, Huang AC. Mapping the role of NAD metabolism in prevention and treatment of carcinogenesis. Mol Cell Biochem. 1999;193:69–74. [PubMed] [Google Scholar]
- 14.Jacobson EL, Giacomoni PU, Roberts MJ, Wondrak GT, Jacobson MK. Optimizing the energy status of skin cells during solar radiation. J Photochem Photobiol B. 2001;63:141–147. doi: 10.1016/s1011-1344(01)00211-1. [DOI] [PubMed] [Google Scholar]
- 15.Spronck JC, Kirkland JB. Niacin deficiency increases spontaneous and etoposide-induced chromosomal instability in rat bone marrow cells in vivo. Mutat Res. 2002;508:83–97. doi: 10.1016/s0027-5107(02)00188-4. [DOI] [PubMed] [Google Scholar]
- 16.Zhang JZ, Henning SM, Swendseid ME. Poly(ADP-ribose) polymerase activity and DNA strand breaks are affected in tissues of niacin-deficient rats. J Nutr. 1993;123:1349–1355. doi: 10.1093/jn/123.8.1349. [DOI] [PubMed] [Google Scholar]
- 17.Spronck JC, Nickerson JL, Kirkland JB. Niacin Deficiency Alters p53 Expression and Impairs Etoposide-Induced Cell Cycle Arrest and Apoptosis in Rat Bone Marrow Cells. Nutr Cancer. 2007;57:88–99. doi: 10.1080/01635580701268337. [DOI] [PubMed] [Google Scholar]
- 18.Spronck JC, Bartleman AP, Boyonoski AC, Kirkland JB. Chronic DNA damage and niacin deficiency enhance cell injury and cause unusual interactions in NAD and poly(ADP-ribose) metabolism in rat bone marrow. Nutr Cancer. 2003;45:124–131. doi: 10.1207/S15327914NC4501_14. [DOI] [PubMed] [Google Scholar]
- 19.Boyonoski AC, Gallacher LM, ApSimon MM, Jacobs RM, Shah GM, Poirier GG, Kirkland JB. Niacin deficiency increases the sensitivity of rats to the short and long term effects of ethylnitrosourea treatment. Mol Cell Biochem. 1999;193:83–87. [PubMed] [Google Scholar]
- 20.Jacobson EL. Niacin deficiency and cancer in women. J Am Coll Nutr. 1993;12:412–416. doi: 10.1080/07315724.1993.10718330. [DOI] [PubMed] [Google Scholar]
- 21.Gensler HL, Williams T, Huang AC, Jacobson EL. Oral niacin prevents photocarcinogenesis and photoimmunosuppression in mice. Nutr Cancer. 1999;34:36–41. doi: 10.1207/S15327914NC340105. [DOI] [PubMed] [Google Scholar]
- 22.Jacobson EL, Kim H, Kim M, Williams JD, Coyle DL, Coyle WR, Grove G, Rizer RL, Stratton MS, Jacobson MK. A topical lipophilic niacin derivative increases NAD, epidermal differentiation and barrier function in photodamaged skin. Exp Dermatol. 2007;16:490–499. doi: 10.1111/j.1600-0625.2007.00553.x. [DOI] [PubMed] [Google Scholar]
- 23.Boukamp P, Petrussevska RT, Breitkreutz D, Hornung J, Markham A, Fusenig NE. Normal keratinization in a spontaneously immortalized aneuploid human keratinocyte cell line. J Cell Biol. 1988;106:761–771. doi: 10.1083/jcb.106.3.761. [DOI] [PMC free article] [PubMed] [Google Scholar]
- 24.Lehman TA, Modali R, Boukamp P, Stanek J, Bennett WP, Welsh JA, Metcalf RA, Stampfer MR, Fusenig N, Rogan EM, et al. p53 mutations in human immortalized epithelial cell lines. Carcinogenesis. 1993;14:833–839. doi: 10.1093/carcin/14.5.833. [DOI] [PubMed] [Google Scholar]
- 25.Lewis DA, Hengeltraub SF, Gao FC, Leivant MA, Spandau DF. Aberrant NF-kappaB activity in HaCaT cells alters their response to UVB signaling. J Invest Dermatol. 2006;126:1885–1892. doi: 10.1038/sj.jid.5700333. [DOI] [PubMed] [Google Scholar]
- 26.Jacobson EL, Jacobson MK. Tissue NAD as a biochemical measure of niacin status in humans. Methods Enzymol. 1997;280:221–230. doi: 10.1016/s0076-6879(97)80113-9. [DOI] [PubMed] [Google Scholar]
- 27.Jacobson EL, Lange RA, Jacobson MK. Pyridine nucleotide synthesis in 3T3 cells. J Cell Physiol. 1979;99:417–425. doi: 10.1002/jcp.1040990316. [DOI] [PubMed] [Google Scholar]
- 28.Krishan A. Rapid flow cytofluorometric analysis of mammalian cell cycle by propidium iodide staining. J Cell Biol. 1975;66:188–193. doi: 10.1083/jcb.66.1.188. [DOI] [PMC free article] [PubMed] [Google Scholar]
- 29.Vermes I, Haanen C, Steffens-Nakken H, Reutelingsperger C. A novel assay for apoptosis. Flow cytometric detection of phosphatidylserine expression on early apoptotic cells using fluorescein labelled Annexin V. J Immunol Methods. 1995;184:39–51. doi: 10.1016/0022-1759(95)00072-i. [DOI] [PubMed] [Google Scholar]
- 30.Singh NP, McCoy MT, Tice RR, Schneider EL. A simple technique for quantitation of low levels of DNA damage in individual cells. Exp Cell Res. 1988;175:184–191. doi: 10.1016/0014-4827(88)90265-0. [DOI] [PubMed] [Google Scholar]
- 31.Hu XM, Hirano T, Oka K. Arsenic trioxide induces apoptosis in cells of MOLT-4 and its daunorubicin-resistant cell line via depletion of intracellular glutathione, disruption of mitochondrial membrane potential and activation of caspase-3. Cancer Chemother Pharmacol. 2003;52:47–58. doi: 10.1007/s00280-003-0629-5. [DOI] [PubMed] [Google Scholar]
- 32.Gibson UE, Heid CA, Williams PM. A novel method for real time quantitative RT-PCR. Genome Res. 1996;6:995–1001. doi: 10.1101/gr.6.10.995. [DOI] [PubMed] [Google Scholar]
- 33.Chamulitrat W, Schmidt R, Tomakidi P, Stremmel W, Chunglok W, Kawahara T, Rokutan K. Association of gp91phox homolog Nox1 with anchorage-independent growth and MAP kinase-activation of transformed human keratinocytes. Oncogene. 2003;22:6045–6053. doi: 10.1038/sj.onc.1206654. [DOI] [PubMed] [Google Scholar]
- 34.Dreher D, Junod AF. Role of oxygen free radicals in cancer development. Eur J Cancer. 1996;32A:30–38. doi: 10.1016/0959-8049(95)00531-5. [DOI] [PubMed] [Google Scholar]
- 35.Jacobson EL, Meadows R, Measel J. Cell cycle perturbations following DNA damage in the presence of ADP-ribosylation inhibitors. Carcinogenesis. 1985;6:711–714. doi: 10.1093/carcin/6.5.711. [DOI] [PubMed] [Google Scholar]
- 36.Masutani M, Nozaki T, Wakabayashi K, Sugimura T. Role of poly(ADP-ribose) polymerase in cell-cycle checkpoint mechanisms following gamma-irradiation. Biochimie. 1995;77:462–465. doi: 10.1016/0300-9084(96)88161-2. [DOI] [PubMed] [Google Scholar]
- 37.Schreiber V, Hunting D, Trucco C, Gowans B, Grunwald D, De Murcia G, De Murcia JM. A dominant-negative mutant of human poly(ADP-ribose) polymerase affects cell recovery, apoptosis, and sister chromatid exchange following DNA damage. Proc Natl Acad Sci U S A. 1995;92:4753–4757. doi: 10.1073/pnas.92.11.4753. [DOI] [PMC free article] [PubMed] [Google Scholar]
- 38.Saldeen J, Tillmar L, Karlsson E, Welsh N. Nicotinamide- and caspase-mediated inhibition of poly(ADP-ribose) polymerase are associated with p53-independent cell cycle (G2) arrest and apoptosis. Mol Cell Biochem. 2003;243:113–122. doi: 10.1023/a:1021651811345. [DOI] [PubMed] [Google Scholar]
- 39.Cerutti P, Ghosh R, Oya Y, Amstad P. The role of the cellular antioxidant defense in oxidant carcinogenesis. Environ Health Perspect. 1994;102(Suppl 10):123–129. doi: 10.1289/ehp.94102s10123. [DOI] [PMC free article] [PubMed] [Google Scholar]
- 40.Cerutti PA. Prooxidant states and tumor promotion. Science. 1985;227:375–381. doi: 10.1126/science.2981433. [DOI] [PubMed] [Google Scholar]
- 41.Cross AR, Jones OT. Enzymic mechanisms of superoxide production. Biochim Biophys Acta. 1991;1057:281–298. doi: 10.1016/s0005-2728(05)80140-9. [DOI] [PubMed] [Google Scholar]
- 42.Nisimoto Y, Otsuka-Murakami H, Lambeth DJ. Reconstitution of flavin-depleted neutrophil flavocytochrome b558 with 8-mercapto-FAD and characterization of the flavin-reconstituted enzyme. J Biol Chem. 1995;270:16428–16434. doi: 10.1074/jbc.270.27.16428. [DOI] [PubMed] [Google Scholar]
- 43.Cheng G, Cao Z, Xu X, van Meir EG, Lambeth JD. Homologs of gp91phox: cloning and tissue expression of Nox3, Nox4, and Nox5. Gene. 2001;269:131–140. doi: 10.1016/s0378-1119(01)00449-8. [DOI] [PubMed] [Google Scholar]
- 44.Esposito F, Ammendola R, Faraonio R, Russo T, Cimino F. Redox control of signal transduction, gene expression and cellular senescence. Neurochem Res. 2004;29:617–628. doi: 10.1023/b:nere.0000014832.78725.1a. [DOI] [PubMed] [Google Scholar]
- 45.Martin KR, Barrett JC. Reactive oxygen species as double-edged swords in cellular processes: low-dose cell signaling versus high-dose toxicity. Hum Exp Toxicol. 2002;21:71–75. doi: 10.1191/0960327102ht213oa. [DOI] [PubMed] [Google Scholar]
- 46.Wondrak GT, Jacobson MK, Jacobson EL. Endogenous UVA-photosensitizers: mediators of skin photodamage and novel targets for skin photoprotection. Photochem Photobiol Sci. 2006;5:215–237. doi: 10.1039/b504573h. [DOI] [PubMed] [Google Scholar]
- 47.Hallows WC, Lee S, Denu JM. Sirtuins deacetylate and activate mammalian acetyl-CoA synthetases. Proc Natl Acad Sci U S A. 2006;103:10230–10235. doi: 10.1073/pnas.0604392103. [DOI] [PMC free article] [PubMed] [Google Scholar]
- 48.Haigis MC, Mostoslavsky R, Haigis KM, Fahie K, Christodoulou DC, Murphy AJ, Valenzuela DM, Yancopoulos GD, Karow M, Blander G, Wolberger C, Prolla TA, Weindruch R, Alt FW, Guarente L. SIRT4 Inhibits Glutamate Dehydrogenase and Opposes the Effects of Calorie Restriction in Pancreatic beta Cells. Cell. 2006;126:941–954. doi: 10.1016/j.cell.2006.06.057. [DOI] [PubMed] [Google Scholar]
- 49.Ames BN. DNA damage from micronutrient deficiencies is likely to be a major cause of cancer. Mutat Res. 2001;475:7–20. doi: 10.1016/s0027-5107(01)00070-7. [DOI] [PubMed] [Google Scholar]
- 50.Williams GM, Jeffrey AM. Oxidative DNA damage: endogenous and chemically induced. Regul Toxicol Pharmacol. 2000;32:283–292. doi: 10.1006/rtph.2000.1433. [DOI] [PubMed] [Google Scholar]
- 51.Cooke MS, Evans MD, Dizdaroglu M, Lunec J. Oxidative DNA damage: mechanisms, mutation, and disease. Faseb J. 2003;17:1195–1214. doi: 10.1096/fj.02-0752rev. [DOI] [PubMed] [Google Scholar]
- 52.Loft S, Poulsen HE. Cancer risk and oxidative DNA damage in man. J Mol Med. 1996;74:297–312. doi: 10.1007/BF00207507. [DOI] [PubMed] [Google Scholar]
- 53.Pithon-Curi TC, Levada AC, Lopes LR, Doi SQ, Curi R. Glutamine plays a role in superoxide production and the expression of p47phox, p22phox and gp91phox in rat neutrophils. Clin Sci (Lond) 2002;103:403–408. doi: 10.1042/cs1030403. [DOI] [PubMed] [Google Scholar]
- 54.Mates JM, Perez-Gomez C, Nunez de Castro I, Asenjo M, Marquez J. Glutamine and its relationship with intracellular redox status, oxidative stress and cell proliferation/death. Int J Biochem Cell Biol. 2002;34:439–458. doi: 10.1016/s1357-2725(01)00143-1. [DOI] [PubMed] [Google Scholar]
- 55.Buzzai M, Jones RG, Amaravadi RK, Lum JJ, Deberardinis RJ, Zhao F, Viollet B, Thompson CB. Systemic Treatment with the Antidiabetic Drug Metformin Selectively Impairs p53-Deficient Tumor Cell Growth. Cancer Res. 2007;67:6745–6752. doi: 10.1158/0008-5472.CAN-06-4447. [DOI] [PubMed] [Google Scholar]
- 56.Jin S, White E. Role of autophagy in cancer: management of metabolic stress. Autophagy. 2007;3:28–31. doi: 10.4161/auto.3269. [DOI] [PMC free article] [PubMed] [Google Scholar]
- 57.Karantza-Wadsworth V, Patel S, Kravchuk O, Chen G, Mathew R, Jin S, White E. Autophagy mitigates metabolic stress and genome damage in mammary tumorigenesis. Genes Dev. 2007;21:1621–1635. doi: 10.1101/gad.1565707. [DOI] [PMC free article] [PubMed] [Google Scholar]