Abstract
A phosphorothioate single-stranded DNA aptamer (thioaptamer) targeting transforming growth factor-β1 (TGF-β1) was isolated by in vitro combinatorial selection. The aptamer selection procedure was designed to modify the backbone of single-stranded DNA aptamers, where 5′ of both A and C are phosphorothioates since this provides enhanced nuclease resistance as well as higher affinity than that of a phosphate counterpart. The thioaptamer selected from a combinatorial library (5 × 10¹⁴ sequences) binds to TGF-β1 protein with an affinity of 90 nM. In this report, sequence, predicted secondary structure, and binding affinity of the selected thioaptamer (T18_1_3) are presented.
Keywords: Transforming growth factor-β1, selection, aptamer, phosphorothioate, thioaptamer, chemiluminescence, entropy
Transforming growth factor-β1 (TGF-β1) is a 25 kDa homodimer composed of two 12.5 kDa subunits joined by a disulfide bond. The protein is known as a multifunctional cytokine acting both through autocrine and paracrine mechanisms. The protein suppresses the immune system and is particularly associated with immune disregulation by inhibiting the proliferation of normal T lymphocytes via down-regulation of interleukin-2-mediated proliferative signals.1 TGF-β1 also mediates tumor-promoting effects, either through differential effects on tumor and stromal cells or through alteration in the TGF-β1 responsiveness of the tumor cells themselves.2 Inhibition of the TGF-β signaling pathway has been proposed for cancer therapy.3 Therefore, agents that target and antagonize TGF-β1 may serve as therapeutic or research tools by modulating the function of this protein.
Combinatorial selection of oligonucleotide aptamers has been employed to develop potential therapeutic agents since its introduction.4,5 The principle of this technique is isolation and enrichment of specific nucleic acid sequences (aptamers) that bind to target molecules from a large random combinatorial library. This approach seems especially appropriate as inhibitor development because the protein is known to bind to heparin, a polyanionic polymer like DNA6 The selection in this study was designed to modify every 5′ of adenosine and cytosine of single-stranded DNA (ssDNA) aptamers to phosphorothioate, since phosphorothioate-substituted aptamers typically display an enhanced affinity for targeted molecules and increased stability in the biological milieu.7,8 Several DNA9,10 and RNA11,12 phosphorothioate aptamers (“thioaptamers”) have been isolated with these advantages.13
Selection of ssDNA thioaptamers
Among 42 independent sequences, three sequences (18_1_3, 18_1_11, and 18_2_2) were observed in multiple clones (Table 1). These more frequently selected sequences were chosen as thioaptamer candidates. Materials and methods are available in the online supplementary material.
Table 1. Multiple sequence alignment of thioaptamer candidates.
42 sequences isolated independently at 18th round of selection were aligned using ClustalW algorithm. Number in the parenthesis indicates number of sequence. A and C, 5′ side of which are phosphorothioates, are in bold characters.
| Name | Sequence | |
|---|---|---|
| T18_1_3 | (11) | --TGTCGT--TGT--GTC--CTGTACCCG--CCTTGACCA- |
| T18_1_2 | (1) | TGTCTCGA--TGCTAGACT-CTATACCCG--CCAA------ |
| T18_1_1 | (1) | --TGTGGAC-TG---GTCT-ATCCATGCA--CCTGTACC-- |
| T18_1_8 | (1) | TGTGT-GTA-TG---GTCC-TTGCATCGATTCCCTG----- |
| T18_2_13 | (1) | --TGT-GTC-TA----TCG-CTGCACCGTGTCCAT-ACA-- |
| T18_2_15 | (1) | ---GT-GTG-CGTT-GTC---TGT--CCGTTTCCTGTCCAC |
| T18_2_10 | (1) | TGTGGCGT--TGAT-ATCGACTGT-------CCTTG-CCAC |
| T18_1_11 | (2) | TTGGTTGA--TGTGCATCG-CTGT-------TCCTGTCCA- |
| T18_1_4 | (1) | TGGGTCGC--TG---ATC----GCATCGATACTCT--CCAC |
| T18_1_24 | (1) | ATCGTCGAC-TG----TC--CTGTCACTGT-CCAT--CCA- |
| T18_2_2 | (15) | --TGGAGG--TGCCTGGA---TATATC-GA--CTCGACCC- |
| T18_1_10 | (1) | -GTGTCCT--TGTCTAGCCTCGATA-------CACGACAC- |
| T18_1_23 | (1) | TGTGGCGT--TG----AC---TGTACACGTCGATACACC-- |
| T18_1_19 | (1) | --TGGCTGG-TCACTGTA--CTCT--CTGC-TCTCCAC--- |
| T18_1_13 | (1) | --TGTAGTG-TCC-TGGC---TATCCACGT--CTCCATT-- |
| T18_1_18 | (1) | ----TGGAT-CGCTTATCGCCTCGATC-----ATTGCCCA- |
| T18_1_15 | (1) | -TTGTTGTACTGGC-ATCGCCTCGACTCG---CTG------ |
| consensus | TGT GA TG GTC CTGTA C G CT GACC |
Sequence analysis selected thioaptamers
As phosphorothioate modification has been known to enhance binding to proteins, the occurrence of the thioate linkage in the sequences was examined. We found that the thioate linkages occurred preferentially near the 3′ sides of the variable region of thioaptamer candidates. Localization of a thioate linkage at a particular position could be due to the property of the chemical nature of the modification that enhances protein-binding affinity.9,12,13 This non-random occurrence of phosphorothioates in the thioaptamer candidates was further analyzed quantitatively. Clustering of phosphorothioates (A and C) in the variable region of the candidates was analyzed from the statistical thermodynamics point of view. Because thioate linkages occurred predominantly at 3′ side of the variable region, we examined the last 14 nucleotides of the region. The nucleotide composition entropy (SC) can be calculated from its statistical weight (W)14
| (1) |
| (2) |
where k is Boltzmann constant (= 1.380 × 10⁻²³ J K−1), N is the window size, fourteen in this case, and nX is the number of nucleotide X in the window. The corresponding free energy change (ΔG) of clustering of phosphorothioates from a random sequence can be obtained from its entropy value as shown in Eq (3):
| (3) |
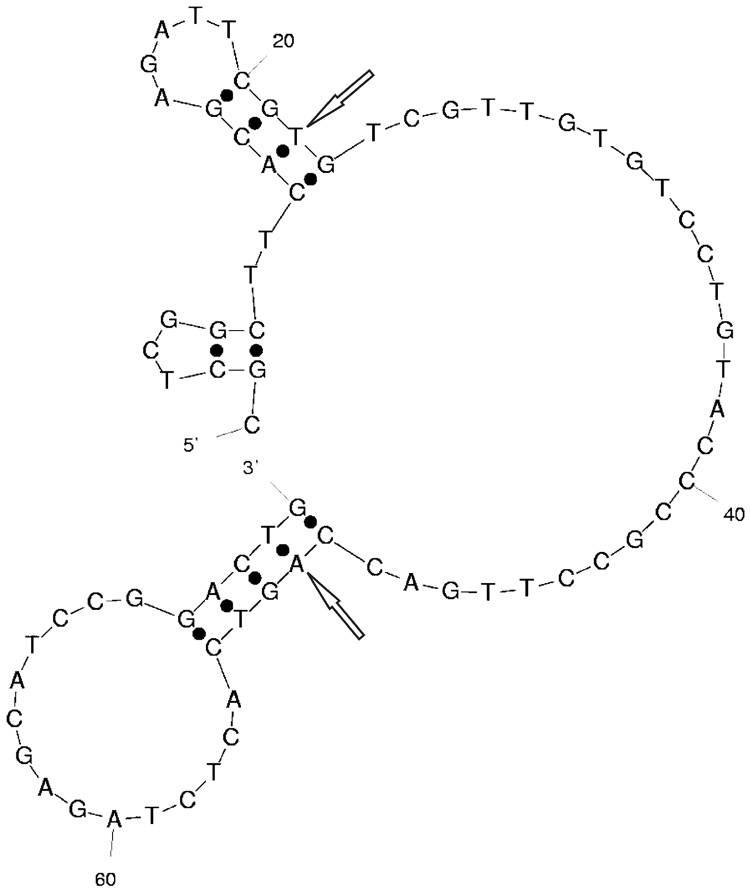
where T is temperature in Kelvin and ΔSC is difference of SC between a random sequence and a thioaptamer sequence. The results of these calculations are shown in Table 2. According to the calculation T18_1_3 has the lowest SC value. According to the secondary structure prediction, the variable region of T18_1_3 does not contain secondary structure elements (Fig. 1).
Table 2. Statistical thermodynamic analysis of selected thioaptamers and a random sequence.
ΔG was obtained for 298 Kelvin.
| Sequence | W | SC (J K−1) | ΔG (kJ mol−1) |
|---|---|---|---|
| T18_1_3 | 1,001 | 0.95 × 10⁻²² | 3.05 |
| T18_1_11 | 3,003 | 1.11 × 10⁻²² | 0.33 |
| T18_2_2 | 2,002 | 1.05 × 10⁻²² | 1.33 |
| Random | 3,432 | 1.12 × 10⁻²² | 0 |
Figure 1.

Predicted secondary structure of T18_1_3. Initial and last nucleotides of the variable region are marked by arrows.
Binding assay
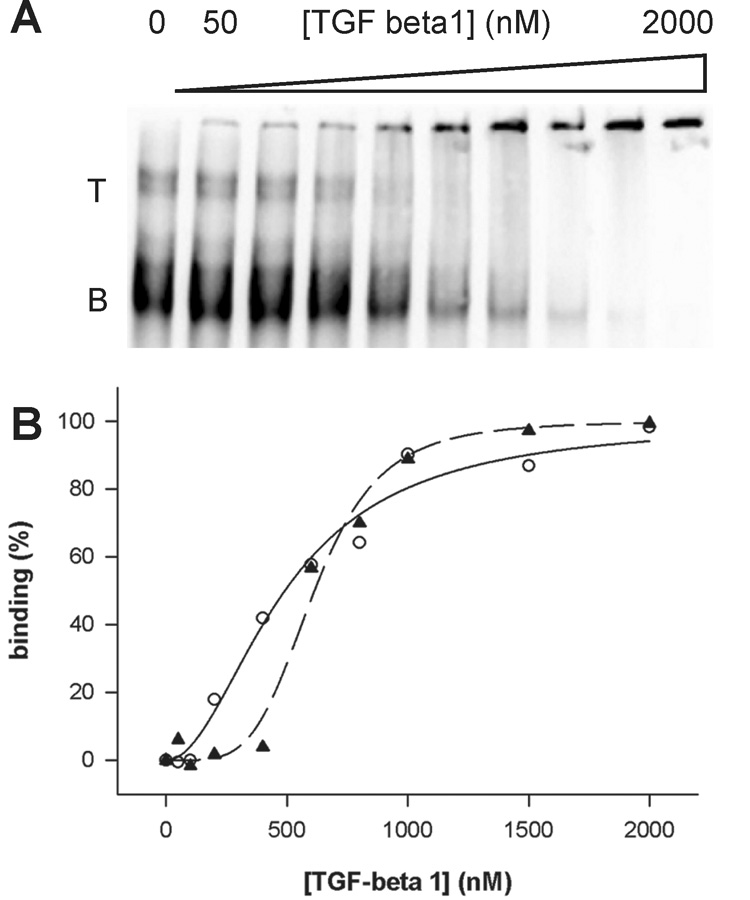
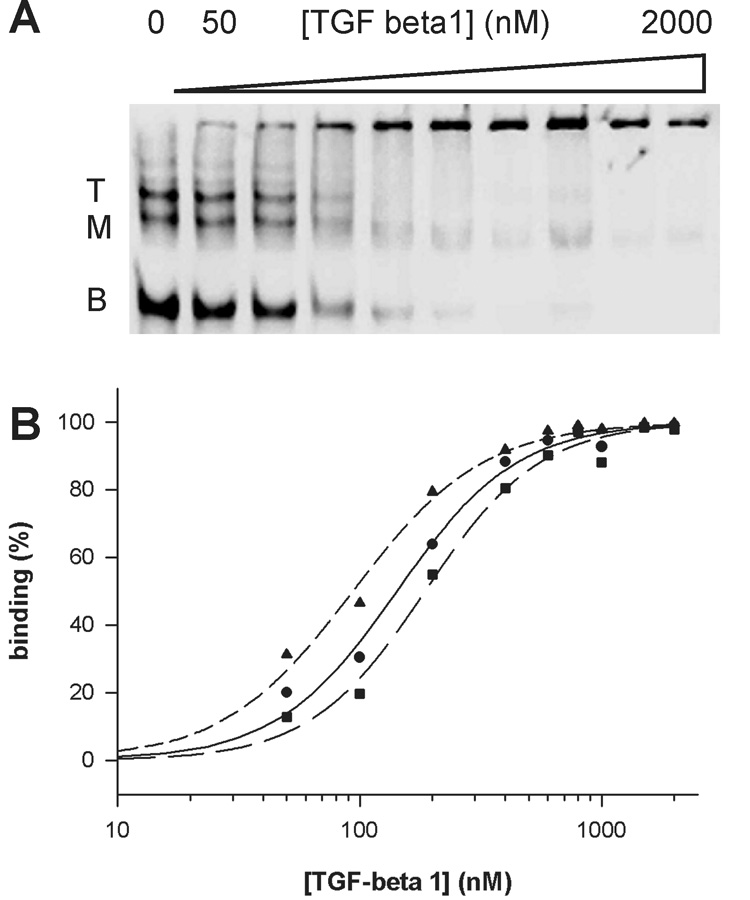
To identify the best thioaptamer, target-binding affinities of the thioaptamer candidates were examined by chemiluminescence (CL) electrophoretic mobility shift assay (EMSA) as CL IDV (integral density value) was identified to be linearly proportional to the sample quantity15, which has been applied to quantitative binding studies.6,16,17 First, binding of the initial thioaptamer library to the protein was assessed using CL EMSA (Fig. 2). As the concentration of the protein in a binding mixture increased, the DNA bands (labeled as T and B in Fig. 2) of the initial thioaptamer library in the EMSA image decreased and shifted bands were observed near the well of the gel. Because the CL intensity of the shifted band was much less than that of free DNA, the decrease of the main band rather than the intensity of the shifted band was used to assess binding to the protein. To identify the best thioaptamer for TGF-β1 protein, protein-binding affinities of the thioaptamer candidates (T18_1_3, T18_1_11, and T18_2_2) were determined. In the preliminary binding experiments, T18_1_3 showed the tightest binding to the protein. Based on the binding studies, T18_1_3 was chosen for further studies. In the case of thioaptamer titration, multiple discrete bands of DNA were observed in the EMSA image as well as in the initial library titration. The mobility of the lower band corresponds to that of the main bands in the initial library indicating monomeric forms of thioaptamers. The nature of the upper bands was elucidated to be multimeric forms of thioaptamers (see section Multimerization of thioaptamer). In assessing binding affinities, each band was followed separately to obtain an affinity of each band to the protein using two different algorithms (hyperbolic and sigmoid). Values of the assessed affinities of each sequence are shown in Table 3. Three things need to be noted. First, shifted bands are observed with relatively weak intensity near the wells of the gel. It could be due to the formation of large DNA-protein complexes, which remain in the wells of the gel. Second, as the lack of information on the binding mechanism, we used two of the simplest equations to describe the binding. Third, the binding data indicate that the initial library binds to TGF-beta1 with a high affinity (an averaged dissociation constant of about 500 to 600 nM). Heparin-binding site(s) in the protein may explain the high-affinity binding of the initial library.
Figure 2.

(A) EMSA of the initial thiolibrary (4 nM) with TGF-β1 protein. T and B represent top and bottom bands of the library, respectively. Data fitting to a Hill equation were shown in (B) where the circle and solid line is for the top band and the triangle and dashed line is for the bottom band.
Table 3. Titration results of the initial library and thioaptamer T18_1_3 with TGF-β1 protein.
Apparent dissociation constants (in nM) of the initial library and the thioaptamer are shown as the value ± standard error for each fitting equation, hyperbolic and sigmoid, where hyperbolic means one-to-one binding and sigmoid represent multiple binding mechanism described by Hill equation. The value in the second row in the sigmoid row is the Hill coefficient. The number in the parenthesis is the squared correlation coefficient of the corresponding fitting. T, M, and B represent the top, middle and bottom bands of DNA in the gel.
| initial library | T18_1_3 | ||||
|---|---|---|---|---|---|
| T | B | T | M | B | |
| hyperbolic | 440 ± 250 | 540 ± 560 | 120 ± 40 | 160 ± 60 | 76 ± 19 |
| (0.896) | (0.765) | (0.941) | (0.930) | (0.959) | |
| sigmoid | 490 ± 60 | 610 ± 30 | 140 ± 10 | 190 ± 15 | 94 ± 6.0 |
| 1.9 ± 0.4 | 4.5 ± 0.9 | 1.7 ± 0.2 | 1.8 ± 0.2 | 1.6 ± 0.2 | |
| (0.983) | (0.986) | (0.993) | (0.992) | (0.994) | |
Multimerization of thioaptamer
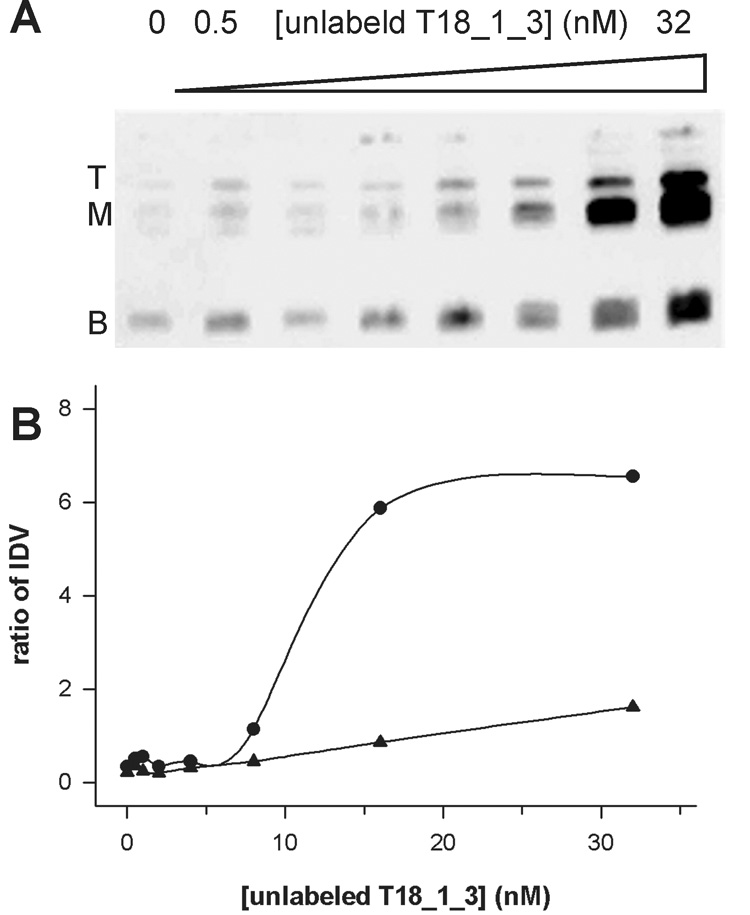
The nature of the multiple bands of T18_1_3 in a native gel (Fig. 3) was examined by DNA-DNA titration (Fig. 4). With more unlabeled thioaptamer, the intensity of the upper (top and middle) bands increased indicating that the upper bands are multimeric forms rather than different conformers of the monomer form. One interesting observation in the DNA-DNA titration is that the total intensity (sum of the lower and upper bands) is dependent on the quantity of unlabeled thioaptamer. Because the total quantity of biotin-labeled DNA was constant in each lane it was expected that the total intensity remained constant. There is no definitive explanation for this phenomenon. One possible mechanism is recognition of unlabeled DNA by streptavidin thereby enhancing the CL intensity.
Figure 3.

(A) EMSA of a thioaptamer T18_1_3 (4 nM) with TGF-β1 protein. T, M, and B represent top, middle, and bottom bands of the thioaptamer, respectively. Data fitting to a Hill equation were shown in (B) where the circle and solid line is for the top band, the square and long dashed line is for the middle band, and the triangle and short dashed line is for the bottom band.
Figure 4.

Multimerization of thioaptamer T18_1_3. (A) EMSA of DNA-DNA titration. (B) The ratios of band intensity of the top (triangle) and middle (circle) bands to the bottom band are plotted against the concentration of unlabeled T18_1_3.
Combinatorial selection of aptamers, a very promising and effective strategy for the development of potential drugs9,12,13,18,19 was employed to isolate ssDNA thioaptamers targeting TGF-β1, which is known to play a critical role in the development and progression of cancer2,3 as well as cardiovascular disease20,21 and renal failure.22,23 Selection of ssDNA thioaptamers resulted in a convergence of sequences by round 18. It is noteworthy that the selected thioaptamer (T18_1_3) has the lowest nucleotide composition entropy (Table 2). This feature is consistent with our previous report,12 where the best thioaptamer has the lowest composition entropy.
There are several reports of thioaptamer selection.13 In our previous study12, we reported the thermodynamic basis of the “thio” effect enhancing protein-binding affinity. We examined the idea in this study too. The magnitude of enhancement of binding free energy (ΔΔG) due to selection can be calculated by the following equation:
| (4) |
where R and T are ideal gas constant and temperature and KIL and KTA are apparent dissociation constant of the initial library and the selected thioaptamer, respectively. The ratio of apparent dissociation constants is 7.1 or 6.5 for the hyperbolic or sigmoid model according to Table 3. This corresponds to an increase in binding free energy by 4.86 or 4.63 kJ mol−1 according to Eq. (4). These values are in good agreement with that obtained using Eq. (3) as shown in Table 2, suggesting the potential utility of this type of statistical analysis. This indicates the source of the driving force for the clustering of phosphorothioate at a specific site of the variable region is protein-binding energy. Interestingly, A and C in the 3′ primer sequence region of thioaptamers are phosphorothioates as they are incorporated during PCR unlike the 5′ primer sequence, which is provided by the primer itself that is phosphate form. We speculate that this intrinsic topological condition may decide the site of localization of phosphorothioates in the variable region of the thioaptamer. This is also the case in the consensus sequence (Table 1).
The multiplicity of the ssDNA bands in a native gel was identified due to reversible multimerization of the thioaptamer by CL EMSA. This phenomenon was also reported in our previous report.12 We think the two stem-loop structures in each primer sequence are responsible for the two upper bands in a gel (Fig. 3) by forming intermolecular hybridization with each other.
In conclusion, we have isolated a high affinity thioaptamer targeting TGF-β1. The “thio” effect is well described by our theoretical model. The selected thioaptamer may serve as an important tool in elucidating TGF-β1 regulated signaling pathways in disease and potentially as a therapeutic agent to antagonize TGF-β1 signaling. In addition, the detailed experimental procedure (Supplementary material) should be a useful technique for aptamer selection.
Supplementary Material
Acknowledgements
This work was supported by grants from the U.S. Edgewood Chemical Biological Center (W911 SR-04-C-0065), NIH (Grants AI27744 and U01 AI054827), NIEHS (Grant ES06676), NHLBI (Grant N01HV28184), the Welch Foundation (Grant H1296) and NIH/NCI (R01CA104505 to JAC).
Footnotes
Publisher's Disclaimer: This is a PDF file of an unedited manuscript that has been accepted for publication. As a service to our customers we are providing this early version of the manuscript. The manuscript will undergo copyediting, typesetting, and review of the resulting proof before it is published in its final citable form. Please note that during the production process errors may be discovered which could affect the content, and all legal disclaimers that apply to the journal pertain.
References and notes
- 1.Siegel PM, Massague J. Nat. Rev. Cancer. 2003;3:807. doi: 10.1038/nrc1208. [DOI] [PubMed] [Google Scholar]
- 2.Elliott RL, Blobe GC. J. Clin. Oncol. 2005;23:2078. doi: 10.1200/JCO.2005.02.047. [DOI] [PubMed] [Google Scholar]
- 3.Kirkbride KC, Blobe GC. Expert Opin. Biol. Ther. 2003;3:251. doi: 10.1517/14712598.3.2.251. [DOI] [PubMed] [Google Scholar]
- 4.Tuerk C, Gold L. Science. 1990;249:505. doi: 10.1126/science.2200121. [DOI] [PubMed] [Google Scholar]
- 5.Ellington AD, Szostak JW. Nature. 1990;346:818. doi: 10.1038/346818a0. [DOI] [PubMed] [Google Scholar]
- 6.Kang J, Lee MS, Gorenstein DG. Anal. Biochem. 2006;349:156. doi: 10.1016/j.ab.2005.11.008. [DOI] [PubMed] [Google Scholar]
- 7.Milligan JF, Uhlenbeck OC. Biochemistry. 1989;28:2849. doi: 10.1021/bi00433a016. [DOI] [PubMed] [Google Scholar]
- 8.Eckstein F. Antisense Nucleic Acid Drug Dev. 2000;10:117. doi: 10.1089/oli.1.2000.10.117. [DOI] [PubMed] [Google Scholar]
- 9.King DJ, Ventura DA, Brasier AR, Gorenstein DG. Biochemistry. 1998;37:16489. doi: 10.1021/bi981780f. [DOI] [PubMed] [Google Scholar]
- 10.King DJ, Bassett SE, Li X, Fennewald SA, Herzog NK, Luxon BA, Shope R, Gorenstein DG. Biochemistry. 2002;41:9696. doi: 10.1021/bi020220k. [DOI] [PubMed] [Google Scholar]
- 11.Jhaveri S, Olwin B, Ellington AD. Bioorg. Med. Chem. Lett. 1998;8:2285. doi: 10.1016/s0960-894x(98)00414-4. [DOI] [PubMed] [Google Scholar]
- 12.Kang J, Lee MS, Watowich SJ, Gorenstein DG. FEBS Lett. 2007;581:2497. doi: 10.1016/j.febslet.2007.04.072. [DOI] [PubMed] [Google Scholar]
- 13.Yang X, Gorenstein DG. Curr. Drug Targets. 2004;5:705. doi: 10.2174/1389450043345074. [DOI] [PubMed] [Google Scholar]
- 14.Craig NC. Entropy Analysis: an introduction to chemical thermodynamic. New York, NY: VCH; 1992. [Google Scholar]
- 15.Kang J, Lee MS, Gorenstein DG. Anal. Biochem. 2005;345:66. doi: 10.1016/j.ab.2005.07.008. [DOI] [PubMed] [Google Scholar]
- 16.Kang J, Lee MS, Watowich SJ, Gorenstein DGJ. Virol. Methods. 2006;131:155. doi: 10.1016/j.jviromet.2005.08.006. [DOI] [PubMed] [Google Scholar]
- 17.Kang J, Lee MS, Gorenstein DG. Anal. Biochem. 2007;363:312. doi: 10.1016/j.ab.2007.01.038. [DOI] [PMC free article] [PubMed] [Google Scholar]
- 18.Burgstaller P, Jenne A, Blind M. Curr. Opin. Drug Discov. Devel. 2002;5:690. [PubMed] [Google Scholar]
- 19.Higashimoto Y, Yamagishi S, Nakamura K, Matsui T, Takeuchi M, Noguchi M, Inoue H. Microvasc. Res. 2007;74:65. doi: 10.1016/j.mvr.2007.04.001. [DOI] [PubMed] [Google Scholar]
- 20.Redondo S, Santos-Gallego CG, Tejerina T. Cytokine Growth Factor Rev. 2007;18:279. doi: 10.1016/j.cytogfr.2007.04.005. [DOI] [PubMed] [Google Scholar]
- 21.Ruiz-Ortega M, Rodriguez-Vita J, Sanchez-Lopez E, Carvajal G, Egido J. Cardiovasc. Res. 2007;74:196. doi: 10.1016/j.cardiores.2007.02.008. [DOI] [PubMed] [Google Scholar]
- 22.Gagliardini E, Benigni A. Expert Opin. Biol. Ther. 2007;7:293. doi: 10.1517/14712598.7.3.293. [DOI] [PubMed] [Google Scholar]
- 23.Wynn TA. J. Clin. Invest. 2007;117:524. doi: 10.1172/JCI31487. [DOI] [PMC free article] [PubMed] [Google Scholar]
Associated Data
This section collects any data citations, data availability statements, or supplementary materials included in this article.


