

Abstract
In this study we address the hypothesis that aging modifies the intrinsic properties of oligodendrocytes, the myelin-forming cells of the brain. According to our model, an “epigenetic memory” is stored in the chromatin of the oligodendrocyte lineage cells and is responsible for the maintenance of a mature phenotype, characterized by low levels of expression of transcriptional inhibitors. We report here an age-related decline of histone deacetylation and methylation, the molecular mechanisms responsible for the establishment and maintenance of this “epigenetic memory” of the differentiated state. We further show that lack of histone methylation and increased acetylation in mature oligodendrocytes are associated with global changes in gene expression, that include the re-expression of bHLH inhibitors (i.e. Hes5 and Id4) and precursor markers (i.e. Sox2). These changes characteristic of the “aging” oligodendrocytes can be recapitulated in vitro, by treating primary oligodendrocyte cultures with histone deacetylase inhibitors.
Thus, we conclude that the “epigenetic memory loss” detected in white matter tracts of older mice induces global changes of gene expression that modify the intrinsic properties of aged oligodendrocytes and may functionally modulate the responsiveness of these cells to external stimuli.
Keywords: chromatin, brain, myelin, disease, histone, inhibitors
INTRODUCTION
A large body of literature supports the hypothesis that the ability to repair damage in the CNS is affected by age 4,6,7. One example for this postulate is the ability to repair myelin after demyelination, a process defined as ”remyelination”. It has been shown that young but not old rodents are able to promptly and efficiently generate new myelin after a chemically induced demyelination35. It has been proposed that the progressive decline of the endogenous capacity for repair is the result of impaired oligodendrocyte progenitor cell (OPC) recruitment and differentiation36, due to changes in growth factor expression profiles16. However, supplementation with growth factors did not reverse the aging effect on remyelination29, 31 and suggested the existence of changes in the intrinsic properties of oligodendrocyte progenitors in the brain of older mice. It remains unclear, however, whether the aging process per se affects also the intrinsic properties of mature oligodendrocytes and this is the subject of the current study.
We have previously shown that oligodendrocyte differentiation and myelin gene expression are the result of stage-specific combinatorial codes of transcription factors, whose equilibrium determines the levels of myelin gene products11. This equilibrium is affected by the expression levels of inhibitory mole cules22,25 that are epigenetically regulated (i.e. by modulation of chromatin components). It is well established that modifications of nucleosomal histones, the basic unit of chromatin, affect gene expression9,20,21, and that transcriptional activation requires an open conformation, while silencing requires compaction (i.e. “closing”) of the chromatin structure18,39. The transition between open and closed conformation of chromatin is dependent on the presence of acetyl groups on lysine residues in the histone tails. When the acetyl groups are present, the structure of chromatin is compatible with transcription40. When the acetyl groups are removed (by enzymes called histone deacetylases or HDACs), chromatin is in a closed conformation and this renders the DNA not accessible to specific transcription factors. The resulting transcriptional repression28 is later stabilized by methylation of specific lysine residues in the histone tails 19,27. Histone deacetylases comprise a family of proteins that can be further subdivided on the basis of specific characteristics into three classes8. Class I (i.e. HDAC-1, -2, -3 and -8) are characterized by nuclear localization and ubiquitous expression; class II (i.e. HDAC-4, -5, -6, -7) are mainly cytosolic and expressed in a tissue-specific manner; class III (i.e. SIRT-1, SIRT-2, etc.) are NAD-dependent enzymes. Class III enzymes can be also distinguished from the other two classes because their enzymatic activity is inhibited by sirtinol, and is not responsive to pharmacological inhibitors (i.e. TSA or VPA) that known to efficiently inhibit the enzymatic activity of class I and II HDAC family members33.
Our previous studies on oligodendrocyte differentiation in culture22,24 and in developing animals34 indicated that histone deacetylation mediated by class I and II HDAC activity is necessary for oligodendrocyte maturation and myelin gene expression during postnatal brain development and that is later followed by repressive histone methylation in the nuclei of mature cells34. Since histone deacetylation and methylation of lysine residues in the tail of nucleosomal histones are critical epigenetic modulators of gene expression during oligodendrocyte differentiation and myelin formation, we postulated that they serve the purpose of establishing a “molecular memory”, which is stored in the chromatin of the oligodendrocyte lineage cells. This memory is responsible for the down-regulation and stable repression of inhibitory molecules in differentiated oligodendrocytes25.
The overall hypothesis tested in this study is that aging results in a progressive loss of this “epigenetic memory” in mature oligodendrocytes, by decreasing the levels and activity of the histone modifying enzymes and thereby resulting in profound changes of the intrinsic properties of these cells, due to global changes of gene expression.
MATERIALS AND METHODS
Antibodies: sources and dilutions
Acetylated-lysine (1:1,000, Upstate Biotechnology); acetylated H3 (1:10,000, Upstate Biotechnology); APC/CC1 (1:50, Oncogene Research Products); dimethyllysine 9 on Histone H3 (1:250, Upstate Biotechnology);HDAC1 (1:6,000, Affinity BioReagents, Inc.); HDAC2 (1:100, Santa Cruz Biotechnology, Inc.); HDAC3 (1:100, Santa Cruz Biotechnology, Inc.); HDAC4 (1:100, Upstate Biotechnology); HDAC5 (1:50, Santa Cruz Biotechnology, Inc.); HDAC6 (1:50, Santa Cruz Biotechnology, Inc.); HDAC7 (1:50, Santa Cruz Biotechnology, Inc.); HDAC8 (1:100, Santa Cruz Biotechnology, Inc.); Id4 ( 1:200, Santa Cruz Biotechnology, Inc.); NG2 (1:100, Chemicon); PDGFRα (1:100, Chemicon); Sox2 (1: 200, Chemicon).
Immunohistochemistry
Male and female C57BL/6 mice were perfused with 4% PFA in 0.1 M phosphate buffer, at distinct ages (postnatal 3 weeks, 8 weeks and 8 months). The whole brains were removed from the skulls, post-fixed, cryopreserved in 30% sucrose, embedded in Shandon M-1 embedding matrix for frozen sectioning and sectioned coronally (20 μm). Frozen sections were permeabilized with blocking buffer (0.1 M phosphate buffer, 5% normal goat serum [Vector Laboratories] and 0.5% Triton X-100). Incubation with distinct primary antibodies (see the Antibodies section for sources and dilutions) was performed overnight in a well sealed humidified container at room temperature. The following day, after 1 h incubation with secondary antibodies directly conjugated to specific fluorochromes (whole Ig-Cy3, 1:200; Sigma-Aldrich) or biotinylated (RPN-1004, 1:200; Amersham Biosciences), the sections were counterstained with DAPI (1:1,000; Molecular Probes, Inc.) in the absence or presence of avidin-conjugated FITC, respectively. Immunoreactive cells were visualized using an inverted fluorescence microscope (DM RA; Leica) and additional data acquisition and analysis were performed using confocal microscopy (LSM510 Meta confocal laser scanning microscope; Carl Zeiss MicroImaging, Inc.). Pinhole of 123 μm, 126 μm, and 124 μm were used with the 63X objective for the rhodamine, DAPI, and FITC channels respectively. The thickness of the optical slices was 1 μm and stacks of 7 were typically used for the generation of the projections. For quantitative analysis we focused our analysis on a selected brain region (i.e. the rostal corpus callosum), corresponding to Bregma 0.02 mm to 0.98 mm, and interaural 3.82 mm to 4.48 mm of the mouse brain atlas30.
Total HDAC enzymatic activity measurement
HDAC activity was measured using HDAC Activity Assay/Drug Discovery Kit (BIOMOL Research Laboratories, Inc.), following manufacturer's instruction. In brief, extracts of the corpus callosum of C57Bl/6 mice of different gender and ages were generated in lysis buffer (50 mM HEPES, pH 7.0, 250 mM NaCl, 0.15% Nonidet P-40, 1 mM DTT, 1 mM EDTA, 0.01% PMSF, 1 mM aprotinin, and 1 mM leupeptin), as previously described 40. Protein concentration was measured and 100 μg of proteins were added to a 96-well plate in 25 μl HDAC assay buffer (BIOMOL Research Laboratories, Inc.). A fluorimetric acetylated substrate (i.e. acetylated histone H3) was added and the reaction was allowed to proceed at room temperature for one hour and then followed by incubation with the developer (Fluor de Lys™ from BIOMOL) for 10−15 min. To test the relative contribution of distinct classes of HDAC to the activity detected in the whole cell extracts of the corpora callosa, in some experiments, increasing concentration of TSA (10nM, 50nM, 500nM) or sirtinol (10μΜ, 50μM, 200μM) were added to the reaction. Enzymatic activity was evaluated in a microtiter plate–reading fluorimeter (PerSeptive Biosystems CytoFlour Multiwell plate reader-4000) (excitation = 360 nm, detection of emitted light =460 nm).
Semi-quantitative RT-PCR
Total RNA was isolated using RNeasy Mini kit (Qiagen, Hilden, Germany) from individual corpus callosum of mice at distinct ages. Total RNA (9 μg/ each sample) was used in 40 μl of reverse transcription (RT) reaction. The PCR was performed in a 20 μl reaction mixture containing 2 μl cDNA as template and 0.1 μM specific oligonucleotide primer pairs. Cycle parameters were 30 sec at 94° C, 30 sec at 50°C, and 1.5 min at 72°C for 25 cycles. The following oligonucleotide primers were used: Sox 2 (3': AACGCCTTCATGGTATGGTC; 5':TGGTCATGGAGTTGTACTGC); Sox11 (3': CTTCATGGTGTGGTCCAAGA; 5':GTCCGTCTTGGGCTTTTTG); Hes5 (3': CAAGGAGAAAAACCGACTGC; 5': GCTGGAAGTGGTAAAGCAGC for mouse and 3': TTATGGCCCCAAGTACCGTGGCG; 5': TTTCACCAGGGCCGCCAGAGGC for rat); Id2 (3':TCTCCTCCTACGAGCAGCAT; 5':ATTCAGATGCCTGCAAGGAC for mouse and 3': CCGGTGAGGTCCGTTAGGAAAA; 5': CCACAGAGTACTTTGCTGTCATT for rat); Id4 (3':GATGAAGGCGGTGAGCCCGGTG; 5': GACAGCATTCTCTGCCGCTGA for mouse and 3':TTCTCGAGATGAAGGCGGTGAGCCCGGTG; 5': TTTCGCGATCAGCGGCACAGAATGCTGTC for rats); p21 (3' GTCCAATCCTGGTGATGTCCGA; 5': TTGGTCTTCTGCAAGAGAAA); actin (3': TGGAATCCTGTGGCATCC; 5': TCGTACTCCTGCTTGCTG); Olig1 (3': ATGAGCTGGTGGGTTACAGG; 5': CACCAGCTGGGAGAGAGAAC); Olig2 (3': CTGGTGTCTAGTCGCCCATC; 5': CACCAGTCGCTTCATCTCCT); Nkx2.2 (3': GGGTTTTCAGTCAAGGACA; 5': TGTACTGGGCGTTGTACTGC for mouse and 3': GTCGCTGACCAACACAAAGACGGG; 5': GGTTTGCCGTCCCTGACCAAGAC for rat); Sox10 (3': GACCAGTACCCTCACCTCCA; 5': CCCCTCTAAGGTCGGGATAG for mouse and 3': GGAGCAAGACCTATCAGAGGT; 5': CAAAGGTCTCCATGTTGGACA for rat); Mash1 (3': CTTCCTTAAGGCCTCTGGCT; 5': GAACCCGCCATAGAGTTCAA).
Densitometric Analysis
Densitometry of the RT-PCR bands were analyzed using ImageJ Software, a PC version of the NIH Image program. The density of the actin bands was used to standardize the density of the respective RT-PCR products. The density values of bands from young mice or oligodendrocyte progenitors were arbitrarily set as 100%. The relative change of intensity of the RT-PCR bands was shown as mean ± SD. Significance was calculated using Student's t-test.
Primary cultures and TSA treatment
Oligodendrocyte progenitors were isolated from the cortex of postnatal day 1 rats, and cultured according to McCarthy and DeVellis26. After shaken from the flasks, progenitors were labeled with the A2B5 antibody and further purified using magnetic beads (Miltenyi Biotec, Auburn, CA), as described in Liu et al.23. Cells were maintained proliferating by the addition of bFGF and PDGF (10 ng/ml) in Sato medium (DMEM, 100 μg/ml albumin, 100μg/ml apotransferrin, 16 μg/ml putrescine, 0.06 ng/ml progesterone, 40 ng/ml selenium, 5 μg/ml insulin, 1 mM sodium pyruvate, 2 mM L-glutamine, 100 units/ml penicillin, 100μg/ml streptomycin). The removal of mitogens from the medium (mitogen withdrawal) was considered as the start of differentiation. Treatment with trichostatin A (TSA, 5ng/ml), was initiated when the culture medium was replaced with mitogen-free chemically defined Sato medium.
RESULTS
We have previously shown that the generation of oligodendrocytes requires an increase in myelin gene expression and a decrease in the levels of transcriptional inhibitors that correlates with the acquisition an of “epigenetic memory”, consisting of histone deacetylation followed by histone methylation34. To test the hypothesis that aging affects the molecular mechanism responsible for the maintenance of this “memory” in oligodendrocyte lineage cells, we assessed the occurrence of global repressive histone methylation in the nuclei of CC1+ oligodendrocytes in the largest white matter tract of the brain, the corpus callosum (Fig. 1). In the initial experiments, a total of 18 C57Bl/6J mice age 3 weeks, 8 weeks and 8 months and of either gender (n= 3 per gender and age) were sacrificed and the brains cryopreserved. Coronal brain sections were processed for immunohistochemistry, using antibodies against CC1 to identify oligodendrocytes and against dimethylated K9 on histone H3 to identify the secondary modifications that affect specific repressive lysine residues in nucleosomal histone H3 (Fig. 1A-I). While more than half of the nuclei of CC1+ cells (59.5±5.5%) in 3 week young mice were characterized by intense nuclear staining for methylated K9 histone H3 (Fig. 1A-C and Fig. 1J), only few CC1+ cells (22.77±1.57%) showed dimethylated histone H3 in the nuclei of 8 month old mice (Fig. 1G-I and Fig. 1J). Besides the decreased percentage of CC1+ oligodendrocytes expressing methylated histone H3 in the older mice, also the expression levels of methylated histone H3 were significantly lower in 8 month old brain (Fig. 1H) compared to younger mice (1B). Thus, repressive global histone methylation decreases with age.
Fig. 1. Age-dependent loss of repressive histone methylation in oligodendrocyte lineage cells.
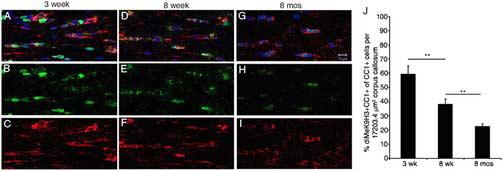
High magnification view of representative confocal imaging of the medial corpus callosum in coronal brain sections from 3-week (panel A-C), 8-week old (panel D-F), and 8-month (panel G-I) old mice. Sections were immunostained with antibodies against oligodendrocyte surface marker CC1 (red in panel A, C, D, F, G, I) and against dimethylated lysine 9 residues on histone H3 (green in panel A, B, D, E, G, H). Nuclei were visualized with DAPI (blue). Note the progressive decline of immunoreactive nuclei for repressive histone methylation (dimethylated lysine 9 residues on histone H3) occurring as part of the aging process. The bar graphs (panel J) indicate the percentage of Methyl-K9-H3+/CC1+ cells normalized by the total number of CC1+ cells (** p<0.01). (Scale bar= 10 μm, 63X objective).
Since during developmental myelination the repressive methylation of lysine 9 in histone H3 is preceded by the removal of acetyl groups34, we asked whether the age-dependent decrease of global histone methylation was associated with defective histone deacetylation and corresponding increased acetylation. For this reason, brain sections from C57Bl/6 mice of increasing age and of both genders were processed for immunohistochemistry using antibodies specific for the acetylated form of histone H3 (supplementary Fig. 1A-F) or for acetylated lysine residues (supplementary Fig. 1G-L). In agreement with the model proposed for developmental myelination, our results showed an inverse correlation between decreased lysine methylation on histone H3 and increased lysine acetylation. A minimum of three mice per gender was used in each age group and the number of acetylated nuclei was counted in white matter tracts analyzed at the corresponding anatomical levels in at least 3 sections per animal (supplementary Fig. 1M and 1N). The results were then normalized by total number of DAPI+ nuclei in the same region. This quantification revealed a statistically significant increase (p <0.001) in the percentage of acetylated nuclei in the corpus callosum of old male C57Bl/6 mice (x= 67.67±3.01%, average ± SD of total DAPI+ cells) compared to young mice of the same gender (x= 24±2.65% average ± SD of total DAPI+ cells). A similar trend was observed in old females (x= 74.67±4.51% average ± SD of total DAPI+ cells) compared to younger ones (x= 23±2.65% average ± SD of total DAPI+ cells). To further confirm that the increased number of nuclei immunoreactive for acetyl lysine reflected changes occurring in the oligodendrocyte lineage cells, we further analyzed sections by double immunohistochemistry, using the CC1 antibody to identify differentiating and mature oligodendrocytes (Fig. 2A-F). Although a small portion of Aclys+/CC1+ (double positive) cells were typically detected in young mice (x= 23.97±1.05% average ± SD of total CC1+cells), there was a remarkably greater proportion of Aclys+/CC1+ double positive cells in older mice (x= 73.33±2.08% average ± SD of total CC1+ cells (Fig. 2G). From these data we conclude that aging oligodendrocytes undergo a progressive decline of the mechanisms associated with transcriptional repression (i.e. histone methylation and deacetylation) and a corresponding increase of histone modifications associated with active transcription (i.e. histone acetylation).
Fig. 2. Acetylation is detected at low level in the nuclei of oligodendrocyte in the brain of young mice, but is a common finding in the brain of aged mice.
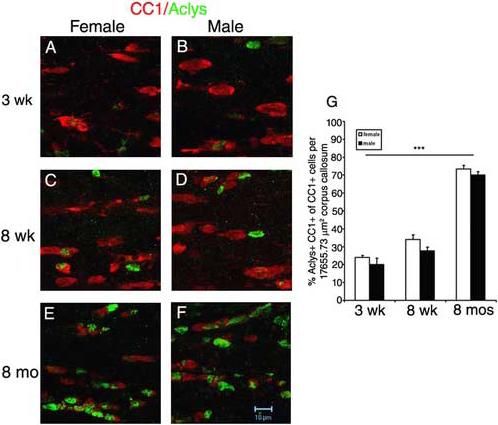
Confocal images of the medial corpus callosum from C57Bl/6 mice of different age and gender (3wks: A-B; 8 wks: C-D; 8 months: E-F; female: A, C, E; male: B, D, F), immunostained with antibodies specific for acetylated lysine residues (Aclys, green) and for the antibody identifying mature oligodendrocytes (CC1, red). Panel G: Bar graphs represent the results of the double Aclys+ CC1+ cell counts normalized by total number of CC1+ cell count (*** p<0.001). Note that in young mice the majority of the nuclei of the CC1+ oligodendrocytes have deacetylated proteins, as indicated by the lack of immunoreactivity for Aclys antibodies (panels A-B). With aging, however, there is a progressive increase of double-positive Aclys+/CC1+ cells in the corpus callosum, until the majority of the cells have acetylated nuclei (panels E-F). (Scale bar=10 μm, 63X objective).
The enzymatic activity responsible for the removal of acetyl group from lysine residues of nucleosomal histones is provided by a family of proteins called histone deacetylases (HDACs) that can be grouped into two subgroups, depending on their responsiveness to specific pharmacological inhibitors. Class I and II HDACs are specifically inhibited by trichostatin A (TSA), while class III activity is responsive to sirtinol. To begin understanding whether increased level of histone acetylation observed during the aging process was the consequence of decreased HDAC activity, we performed enzymatic assays on brain extracts from 8 week old (n=6) and 8 month old (n=6) C57Bl/6 mice of either gender, using a fluorimetric method (Fig. 3A-B). This revealed a 32.7% decrease of total HDAC activity in old females compared to young ones (Fig. 3B), and a 50% decrease in old males compared to young ones (Fig. 3A). To gain insight regarding the subgroup of histone deacetylase affected during the aging process, we repeated the experiment by adding to the protein extracts increasing concentrations of the class I and II inhibitor TSA (Fig. 3C) or of the class III inhibitor sirtinol (Fig.3D). In agreement with the major role of class I and II HDACs in contributing to the total HDAC activity, we observed that TSA inhibited HDAC activity in whole cell lysates in a dose dependent fashion. We detected a 75% reduction of the enzymatic activity at concentrations of TSA below the IC50 of the compound (IC50 = 125−250nM) and more than 95% reduction at 500nM (Fig 3C). In contrast, the enzymatic activity of whole cell lysates from the corpora callosa of young and old mice was only partially decreased by concentrations of sirtinol (Fig 3D) above the IC50 of this pharmacological inhibitor (IC50=40 uM). Since class II and class III HDACs are mainly cytosolic34,38 while increased histone acetylation was detected in the nuclei of aging oligodendrocytes, we conclude that the decreased HDAC activity detected in older mice was to be attributed to class I HDACs.
Fig. 3. The age-dependent increase of histone acetylation correlates with the progressive decrease of HDAC activity.
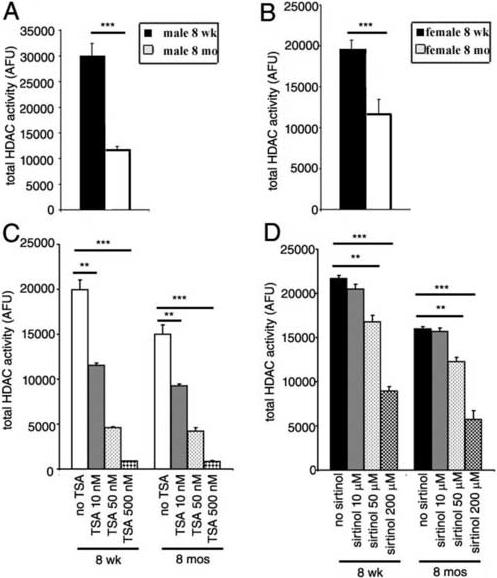
Panel A and B: enzymatic HDAC activity was measured in whole cell brain lysates (WCL) from male (A) and female (B) C57Bl/6 mice of different ages, using a fluorimetric assay based on the release of conjugated-acetyl group from acetylated histone substrates. Panel C: to define the relative contribution of class I and II HDACs to the activity present in extracts of the corpus callosum, increasing concentrations of the HDAC pharmacological inhibitor TSA were added during the incubation of the extracts with the acetylated substrates. Panel D: in to define the relative contribution of class III to the activity present in extracts of the corpus callosum, increasing concentrations of the pharmacological inhibitor sirtinol, were added during the incubation of the extracts with the acetylated substrates. (**=p<0.01;***=p<0.001).
The decreased HDAC enzymatic activity observed in protein extracts from aged brains could be attributed to a functional block or decreased protein expression. To distinguish between these two possibilities we asked whether the expression of class I and class II HDACs in oligodendrocytes were affected by the aging process. For this purpose, coronal brain sections from aging C57Bl/6 mice were processed for immunohistochemistry using antibodies against specific HDAC isoforms of class I (Fig. 4) and of class II (Fig.5). Although we observed a generalized age-dependent decrease of HDAC expression (Fig.4D, 4H, 4L, 4P), only class I HDACs showed a nuclear localization (Fig. 4), while class II HDACs were either absent from oligodendrocytes or primarily cytosolic (Fig. 5). Since defective histone deacetylation was observed in the nuclei of CC1+ cells in older mice, we conclude that the decreased expression of class I HDACs is primarily responsible for the defective removal of acetyl groups from lysine residues on histone H3 observed in oligodendrocyte lineage cells in the aging brain.
Fig. 4. Progressive decrease of class I HDAC expression in the medial corpus callosum of aged mice.
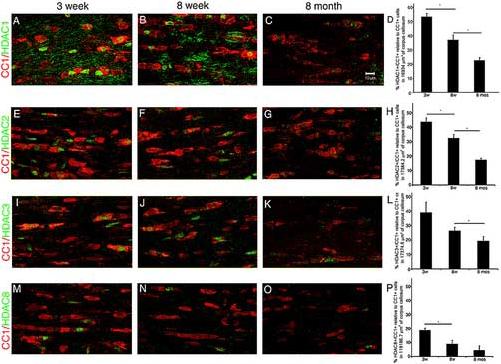
Confocal images of coronal brain sections stained with antibodies against the class I histone deacetylases HDAC1 (A-C), HDAC2 (E-G), HDAC3 (I-K) and HDAC8 (M-O) and against the cell surface oligodendrocytic marker CC1 (red). (Scale bar = 10 μm 63X objective). Bar graphs (panel D, H, L, P) represent the results of the corresponding double HDAC+ CC1+ cell counts normalized by total number of CC1+ cell count (* p<0.01).
Fig. 5. Progressive decrease of class II HDAC expression, in the medial corpus callosum of aged mice.

Confocal images of coronal brain sections stained with antibodies against the class II histone deacetylases HDAC4 (A-C), HDAC5 (E-G), HDAC6 (I-K) and HDAC7 (M-O), and against the cell surface oligodendrocytic marker CC1 (red) (Scale bar =10 μm, 63X objective). Bar graphs (panel D, H, L, P) represent the results of the corresponding double HDAC+/CC1+ cell counts normalized by total number of CC1+ cell counted in the indicated area. Note that class II expression is very weak comparatively to class I and is mainly localized to the cytosol.
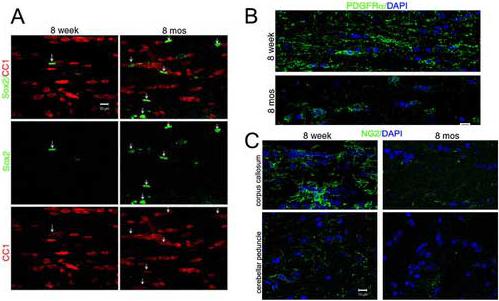
Together all these data indicate that the aging process is associated with the decreased ability of mature oligodendrocytes to retain repressive changes of nucleosomal histones that have been shown to affect the regulation of gene expression. To determine whether the age-dependent decline in histone methylation and deacetylation was also associated with aberrant gene expression, we performed a semi-quantitative RT-PCR of RNA samples isolated from white matter tracts of younger and older mice, using conditions that allowed the detection of transcripts within the linear range (Fig. 6A). A prominent finding of our study was the age-dependent decrease of oligodendrocyte-specific transcription factors, including Sox10 and Olig2, but not Mash1, Sox11 and Olig1 (Fig. 6B-C), in older mice compared to younger ones. This decrease in the expression levels of these transcriptional activators was paralleled by the detection of statistically higher levels of transcriptional inhibitors (i.e. Hes5, Id4 and Nkx2.2) and precursor markers (i.e. Sox2) in aging mice compared to younger controls (Fig. 6D-E). Since the expression levels of these inhibitors during oligodendrocyte progenitor differentiation is dependent on histone deacetylase activity (Shen et al., 2005), we hypothesized that that aging would allow the re-expression of inhibitors in mature oligodendrocytes. To test this hypothesis we performed immunohistochemistry of white matter tracts of young and old mice with antibodies specific for the precursor markers (Sox2), a molecule that is epigenetically down-regulated during the differentiation of progenitors into mature oligodendrocytes (Fig. 7A). In agreement with the prediction that loss of epigenetic memory results in the re-expression of progenitor molecules in mature cells, we detected greater number of Sox2+/CC1+ cells in aged mice, a finding that was rarely observed in young animals (Fig. 7A). To further confirm that the increased levels of Hes5 and Id4 detected in older mice resulted from defective epigenetic memory, rather than accumulation of oligodendrocyte progenitors, we performed additional immunohistochemical experiments using antibodies specific for progenitor markers, such as PDGFR alpha (Fig.7B) and NG2 (Fig. 7C). Although fewer progenitors were detected in all the white matter tracts of older mice compared to the young ones, the decline in progenitor number was more evident in specific regions (i.e. the corpus callosum) than others (i.e. cerebellar peduncles) (Fig.7C). Together, these results suggested that the epigenetic memory loss detected in oligodendrocytes of older mice resulted in changes of gene expression, including the up-regulation of transcriptional inhibitors.
Fig. 6. Increased expressions of transcriptional inhibitors in the aging corpus callosum.
Panel A: amplification of actin message using progressive dilutions and increasing concentrations of the cDNA indicates that the results shown in panels B and D are collected within the linear range. Panel B: mRNA expression of several oligodendrocyte differentiation activators from the RNA extraction of young (8 week) and old (8 month) mice corpus callosum. Panel C: densitometric analysis of the results shown in panel B. Panel D: mRNA expression of transcriptional inhibitors of RNA extracted from the corpus callosum of young (8 week) and old (8 month) mice. Panel E: densitometric analysis of the data shown in panel D. (*= p<0.05; **=p<0.001).
Fig. 7. Aberrant expression of Sox2 in CC1 positive cells.

Panel A: Confocal images showing protein expression of Sox2 (green) in mature oligodendrocytes identified by CC1+ immunoreactivity (red) in young (8 week) and old (8 month) mice. Arrows indicate the Sox2/CC1 double positive cells. (Scale bar =10 μm, objective 63X). Panel B: Confocal image showing the decreased expression of PDGFRα expression (green) in the corpus callosum of older mice (8 m) compared to young ones (8w). Panel C: Confocal image of NG2+ oligodendrocyte progenitors (green) in the corpus callosum and cerebellar peduncles of young (8 wk) and old (8 mos) mice.
To further test this hypothesis in an in vitro system, we used primary cultures of oligodendrocyte progenitors. When maintained in the presence of mitogens, such as PDGF and bFGF, these cells actively proliferate and are characterized by high levels of expression of transcriptional inhibitors of the bHLH family, including Hes5, Id2 and Id4 (Fig. 8A). In addition, these cells express the transcriptional activator Sox10 and the homeodomain protein NKx2.2 (Fig. 8A). Upon removal of mitogens from the medium, these cells promptly exit from the cell cycle and down-regulate the levels of Hes5, Id2 and Id4, while the levels of Sox10 and Nkx2.2 do not change significantly (Fig. 8A and 8B). In the presence of the histone deacetylase inhibitor TSA, the cells are still able to exit from the cell cycle, but the levels of Hes5, Id2 and Id4 remain elevated and this translates into greater protein levels of these inhibitors (Fig. 8C). Thus, treatment of differentiating oligodendrocytes with HDAC inhibitors mimics the results obtained from our studies of transcription factor expression in white matter tracts of aged mice.
Fig. 8. The pattern of gene expression detected in the corpus callosum of older mice can be recapitulated in vitro by treating differentiating oligodendrocytes with pharmacological inhibitors of HDAC.
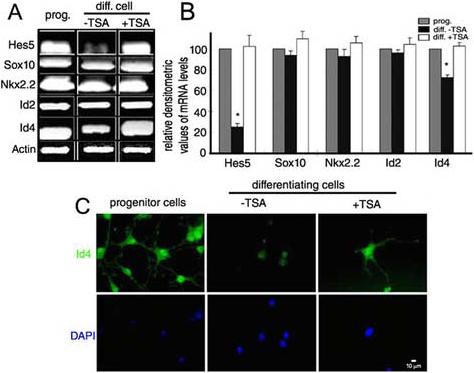
Panel A: mRNA expression of the indicated transcription factors in RNA samples isolated from primary cultures of oligodendrocyte progenitors maintained proliferating (prog) or differentiated (diff cell) in the absence (-TSA) and presence (+TSA) of pharmacological inhibitor of HDAC. Panel B: Densitometric quantification of the results presented in A (*=p<0.001). Panel C: immunocytochemistry of cells exposed to the same conditions described in panel A and then stained with antibodies specific for Id4 (Objective 40X).
Together our findings identify modification of chromatin components occurring in oligodendrocytes that indicate a progressive loss of the epigenetic memory. The resulting changes in gene expression detected in older oligodendrocytes compared to young ones may provide a mechanistic explanation for the changes of the functional properties of oligodendrocytes in the aged brain.
DISCUSSION
Older subjects are more susceptible than younger ones to pathogenic stimuli. Previous studies have addressed the decreased repair ability of cells in several organs, including skin1,10, muscles12, blood vessels15,32, eye lens41, and the brain35,36. The progressive decline of the ability to repair demyelinating lesions, with increasing age35,36, has been attributed to the inefficient recruitment of progenitors to the lesion site36, the insufficient production of specific growth factors16 or differentiation factors36. However the mechanisms responsible for the age-related increase in the susceptibility to pathogenic stimuli have not been investigated. In this study we focused on age-related changes of the intrinsic properties of oligodendrocyte lineage cells, and identify the progressive loss of the “epigenetic memory” that is stored in the chromatin of oligodendrocytes and that modulates gene expression.
The concept of a molecular “memory” regulating the pattern of gene expression is a very well characterized phenomenon in the study of imprinting and inheritance of parental traits2,14,37,42. In the oligodendrocyte lineage, we have previously shown that global chromatin changes occur during developmental myelination34 and that chromatin rearrangements are critical for the differentiation of oligodendrocytes17,22,24. We reported that oligodendrocyte “epigenetic memory” is established in two steps, characterized by deacetylation of lysine residues in the tails of nucleosomal histones followed by the more stable histone methylation34. In this study, we show that these two events required for the establishment of the oligodendrocyte epigenetic memory (i.e. histone methylation and histone deacetylation) are defective in the aged mice. We also show that this functional decline is consequent to decreased levels of the enzymatic activities responsible for these chromatin changes. Since these chromatin changes during developmental myelination correlate with the decline of transcriptional inhibitors, the loss of the epigenetic memory during the aging process is consistent with the heterochronic expression of transcriptional inhibitors in mature cells. The high levels of histone acetylation detected in the nuclei of mature oligodendrocytes in the corpus callosum of older mice correlated with the detection of high levels of transcriptional inhibitors (i.e. Hes5, Id4), and the persistent expression of markers of the precursor stage (i.e. Sox2). These results are indicative of significant and important repercussions on gene expression consequent to changes of levels and activity of chromatin modifying enzymes. The re-activation of gene expression was not a random phenomenon, but rather it was selective for those genes whose levels progressively decreased during development, due to the establishment of the “epigenetic memory”. Among the differentiation inhibitors, for instance, only Id4 was upregulated, while the expression levels of the family member Id2 were not affected. Similarly, among the transcriptional activators of oligodendrocyte differentiation, Olig2 was downregulated, while its homologue Olig1 was not affected. The pattern of gene expression observed in the aging brain, characterized by decreased Olig2 expression concomitant with Nkx2.2 upregulation was reminiscent of the pattern detected in ventral neural progenitors of zebrafish lacking hdac5, a critical enzymatic activity for the establishment of the epigenetic memory of gene expression in developing oligodendrocytes. Therefore, we hypothesize that with aging, the progressive decline of the enzymatic activity responsible for the expression profile in mature oligodendrocyte, results in the progressive loss of the “epigenetic memory” characteristic of mature oligodendrocytes in young animals. In agreement with a critical role of HDAC in the establishment of this “epigenetic memory”, differentiating primary oligodendrocytes treated with HDAC inhibitors showed a pattern of gene expression that was similar to the one observed in the aging brain. Thus, we propose that aging modifies the intrinsic properties of oligodendrocyte lineage cells by affecting the conformation of chromatin and inducing global changes of gene expression.
It is important to mention here that “global” changes in gene expression imply the dysregulated expression of several inhibitors and therefore have a much greater functional impact on the cell than changes in the expression of single molecules.
Finally, we would like to mention that, although the involvement of class III deacetylases, SIRTs, in aging had been previously reported in yeast and worms 3,13, this is the first report of the involvement of class I HDACs in the aging brain.
The data presented in this study provide a molecular explanation to the decreased responsiveness of the cells to extracellular factors and suggest that chromatin modifications and changes in the “epigenetic memory” of the cells may have very profound effects and may affect therapeutic outcomes.
Acknowledgments
The authors would like to acknowledge Ms. Noriko Goldsmith for confocal assistance. This work was supported by grant RO1-NS42925 from NIH-NINDS (to PCB) and grants from the National Multiple Sclerosis Society (to AL and to PCB).
Footnotes
Publisher's Disclaimer: This is a PDF file of an unedited manuscript that has been accepted for publication. As a service to our customers we are providing this early version of the manuscript. The manuscript will undergo copyediting, typesetting, and review of the resulting proof before it is published in its final citable form. Please note that during the production process errors may be discovered which could affect the content, and all legal disclaimers that apply to the journal pertain.
Disclosure Statement. There is no actual or potential conflicts of interest including any financial, personal or other relationships with other people or organizations within three years of beginning the work submitted that could have inappropriately influenced the results. All the experimental procedures performed on animals were in accordance with approved IACUC protocols and following the NIH guidelines.
Supplementary Material
Supplementary Fig. 1: Age-dependent increase of acetylated nucleosomal histone H3 and other nuclear proteins. Confocal image of high power view of the corpus callosum in coronal brain sections from C57Bl/6 mice of the indicated ages and gender. Acetylated histone H3 (AcH3, panels A-F) and acetylated lysine residues in proteins (Aclys, panels G-L) were identified by immunofluorescence (green) in the nuclei (blue= DAPI staining) of cells in the corpus callosum. Bar graphs represent the results of the AcH3+ (panel M) and Aclys+ (panel N) cell counts normalized by total number of DAPI+ nuclei. (Scale bar= 10 μm, 63X objective; * p< 0.05; *** p< 0.001).
References
- 1.Ashcroft GS, Horan MA, Ferguson MW. The effects of aging on cutaneous wound healing in mammals. J Anat. 1995;187(Pt 1):1–26. [PMC free article] [PubMed] [Google Scholar]
- 2.Bantignies F, Cavalli G. Cellular memory and dynamic regulation of polycomb group proteins. Curr Opin Cell Biol. 2006;18(3):275–83. doi: 10.1016/j.ceb.2006.04.003. [DOI] [PubMed] [Google Scholar]
- 3.Bitterman KJ, Medvedik O, Sinclair DA. Longevity regulation in Saccharomyces cerevisiae: linking metabolism, genome stability, and heterochromatin. Microbiol Mol Biol Rev. 2003;67(3):376–99. doi: 10.1128/MMBR.67.3.376-399.2003. [DOI] [PMC free article] [PubMed] [Google Scholar]
- 4.Chari DM, Crang AJ, Blakemore WF. Decline in rate of colonization of oligodendrocyte progenitor cell (OPC)-depleted tissue by adult OPCs with age. J Neuropathol Exp Neurol. 2003;62(9):908–16. doi: 10.1093/jnen/62.9.908. [DOI] [PubMed] [Google Scholar]
- 5.Cunliffe VT, Casaccia-Bonnefil P. Histone deacetylase 1 is essential for oligodendrocyte specification in the zebrafish CNS. Mech Dev. 2006;123(1):24–30. doi: 10.1016/j.mod.2005.10.005. [DOI] [PubMed] [Google Scholar]
- 6.Darsalia V, Heldmann U, Lindvall O, Kokaia Z. Stroke-induced neurogenesis in aged brain. Stroke. 2005;36(8):1790–5. doi: 10.1161/01.STR.0000173151.36031.be. [DOI] [PubMed] [Google Scholar]
- 7.Decker L, Picard-Riera N, Lachapelle F, Baron-Van Evercooren A. Growth factor treatment promotes mobilization of young but not aged adult subventricular zone precursors in response to demyelination. J Neurosci Res. 2002;69(6):763–71. doi: 10.1002/jnr.10411. [DOI] [PubMed] [Google Scholar]
- 8.de Ruijter AJ, van Gennip AH, Caron HN, Kemp S, van Kuilenburg AB. Histone deacetylases (HDACs): characterization of the classical HDAC family. Biochem J. 2003;370(Pt 3):737–49. doi: 10.1042/BJ20021321. [DOI] [PMC free article] [PubMed] [Google Scholar]
- 9.Felsenfeld G. Chromatin as an essential part of the transcriptional mechanism. Nature. 1992;355(6357):219–24. doi: 10.1038/355219a0. [DOI] [PubMed] [Google Scholar]
- 10.Gerstein AD, Phillips TJ, Rogers GS, Gilchrest BA. Wound healing and aging. Dermatol Clin. 1993;11(4):749–57. [PubMed] [Google Scholar]
- 11.Gokhan S, Marin-Husstege M, Yung SY, Fontanez D, Casaccia-Bonnefil P, Mehler MF. Combinatorial profiles of oligodendrocyte-selective classes of transcriptional regulators differentially modulate myelin basic protein gene expression. J Neurosci. 2005;25(36):8311–21. doi: 10.1523/JNEUROSCI.1850-05.2005. [DOI] [PMC free article] [PubMed] [Google Scholar]
- 12.Goldspink G. Age-related loss of skeletal muscle function; impairment of gene expression. J Musculoskelet Neuronal Interact. 2004;4(2):143–7. [PubMed] [Google Scholar]
- 13.Guarente L. Sir2 links chromatin silencing, metabolism, and aging. Genes Dev. 2000;14(9):1021–6. [PubMed] [Google Scholar]
- 14.Heard E, Rougeulle C, Arnaud D, Avner P, Allis CD, Spector DL. Methylation of histone H3 at Lys-9 is an early mark on the X chromosome during X inactivation. Cell. 2001;107(6):727–38. doi: 10.1016/s0092-8674(01)00598-0. [DOI] [PubMed] [Google Scholar]
- 15.Heiss C, Keymel S, Niesler U, Ziemann J, Kelm M, Kalka C. Impaired progenitor cell activity in age-related endothelial dysfunction. J Am Coll Cardiol. 2005;45(9):1441–8. doi: 10.1016/j.jacc.2004.12.074. [DOI] [PubMed] [Google Scholar]
- 16.Hinks GL, Franklin RJ. Delayed changes in growth factor gene expression during slow remyelination in the CNS of aged rats. Mol Cell Neurosci. 2000;16(5):542–56. doi: 10.1006/mcne.2000.0897. [DOI] [PubMed] [Google Scholar]
- 17.Kondo T, Raff M. Chromatin remodeling and histone modification in the conversion of oligodendrocyte precursors to neural stem cells. Genes Dev. 2004;18(23):2963–72. doi: 10.1101/gad.309404. [DOI] [PMC free article] [PubMed] [Google Scholar]
- 18.Kristjuhan A, Walker J, Suka N, Grunstein M, Roberts D, Cairns BR, Svejstrup JQ. Transcriptional inhibition of genes with severe histone h3 hypoacetylation in the coding region. Mol Cell. 2002;10(4):925–33. doi: 10.1016/s1097-2765(02)00647-0. [DOI] [PMC free article] [PubMed] [Google Scholar]
- 19.Lachner M, O'Carroll D, Rea S, Mechtler K, Jenuwein T. Methylation of histone H3 lysine 9 creates a binding site for HP1 proteins. Nature. 2001;410(6824):116–20. doi: 10.1038/35065132. [DOI] [PubMed] [Google Scholar]
- 20.Lee SI, Pe'er D, Dudley AM, Church GM, Koller D. Identifying regulatory mechanisms using individual variation reveals key role for chromatin modification. Proc Natl Acad Sci U S A. 2006;103(38):14062–7. doi: 10.1073/pnas.0601852103. [DOI] [PMC free article] [PubMed] [Google Scholar]
- 21.Lieb JD, Clarke ND. Control of transcription through intragenic patterns of nucleosome composition. Cell. 2005;123(7):1187–90. doi: 10.1016/j.cell.2005.12.010. [DOI] [PubMed] [Google Scholar]
- 22.Liu A, Li J, Marin-Husstege M, Kageyama R, Fan Y, Gelinas C, Casaccia-Bonnefil P. A molecular insight of Hes-5-dependent inhibition of myelin gene expression: old partners and new players. EMBO J. 2006 Sep 28; doi: 10.1038/sj.emboj.7601352. [Epub ahead of print] [DOI] [PMC free article] [PubMed] [Google Scholar]
- 23.Liu A, Stadelmann C, Moscarello M, Bruck W, Sobel A, Mastronardi FG, Casaccia-Bonnefil P. Expression of stathmin, a developmentally controlled cytoskeleton-regulating molecule, in demyelinating disorders. J Neurosci. 2005;25(3):737–47. doi: 10.1523/JNEUROSCI.4174-04.2005. [DOI] [PMC free article] [PubMed] [Google Scholar]
- 24.Marin-Husstege M, Muggironi M, Liu A, Casaccia-Bonnefil P. Histone deacetylase activity is necessary for oligodendrocyte lineage progression. J Neurosci. 2002;22(23):10333–45. doi: 10.1523/JNEUROSCI.22-23-10333.2002. [DOI] [PMC free article] [PubMed] [Google Scholar]
- 25.Marin-Husstege M, He Y, Li J, Kondo T, Sablitzky F, Casaccia-Bonnefil P. Multiple roles of Id4 in developmental myelination: Predicted outcomes and unexpected findings. Glia. 2006;54(4):285–96. doi: 10.1002/glia.20385. [DOI] [PubMed] [Google Scholar]
- 26.McCarthy KD, de Vellis J. Preparation of separate astroglial and oligodendroglial cell cultures from rat cerebral tissue. J Cell Biol. 1980;85(3):890–902. doi: 10.1083/jcb.85.3.890. [DOI] [PMC free article] [PubMed] [Google Scholar]
- 27.Nakayama J, Rice JC, Strahl BD, Allis CD, Grewal SI. Role of histone H3 lysine 9 methylation in epigenetic control of heterochromatin assembly. Science. 2001;292(5514):110–3. doi: 10.1126/science.1060118. [DOI] [PubMed] [Google Scholar]
- 28.Nan X, Ng HH, Johnson CA, Laherty CD, Turner BM, Eisenman RN, Bird A. Transcriptional repression by the methyl-CpG-binding protein MeCP2 involves a histone deacetylase complex. Nature. 1998;393(6683):386–9. doi: 10.1038/30764. [DOI] [PubMed] [Google Scholar]
- 29.O'Leary MT, Hinks GL, Charlton HM, Franklin RJ. Increasing local levels of IGF-I mRNA expression using adenoviral vectors does not alter oligodendrocyte remyelination in the CNS of aged rats. Mol Cell Neurosci. 2002;19(1):32–42. doi: 10.1006/mcne.2001.1062. [DOI] [PubMed] [Google Scholar]
- 30.Paxinos G, Franklin KBJ. The mouse brain in stereotaxic coordinates. Second Edition Academic Press; San Diego: San Francisco: New York: Boston London: Sydney: Tokyo: 1997. [Google Scholar]
- 31.Penderis J, Woodruff RH, Lakatos A, Li WW, Dunning MD, Zhao C, Marchionni M, Franklin RJ. Increasing local levels of neuregulin (glial growth factor-2) by direct infusion into areas of demyelination does not alter remyelination in the rat CNS. Eur J Neurosci. 2003;18(8):2253–64. doi: 10.1046/j.1460-9568.2003.02969.x. [DOI] [PubMed] [Google Scholar]
- 32.Rauscher FM, Goldschmidt-Clermont PJ, Davis BH, Wang T, Gregg D, Ramaswami P, Pippen AM, Annex BH, Dong C, Taylor DA. Aging, progenitor cell exhaustion, and atherosclerosis. Circulation. 2003;108(4):457–63. doi: 10.1161/01.CIR.0000082924.75945.48. [DOI] [PubMed] [Google Scholar]
- 33.Schwer B, North BJ, Frye RA, Ott M, Verdin E. The human silent information regulator (Sir)2 homologue hSIRT3 is a mitochondrial nicotinamide adenine dinucleotide-dependent deacetylase. J Cell Biol. 2002;158(4):647–57. doi: 10.1083/jcb.200205057. [DOI] [PMC free article] [PubMed] [Google Scholar]
- 34.Shen S, Li J, Casaccia-Bonnefil P. Histone modifications affect timing of oligodendrocyte progenitor differentiation in the developing rat brain. J Cell Biol. 2005;169(4):577–89. doi: 10.1083/jcb.200412101. [DOI] [PMC free article] [PubMed] [Google Scholar]
- 35.Shields SA, Gilson JM, Blakemore WF, Franklin RJ. Remyelination occurs as extensively but more slowly in old rats compared to young rats following gliotoxin-induced CNS demyelination. Glia. 1999;28(1):77–83. doi: 10.1002/(sici)1098-1136(199910)28:1<77::aid-glia9>3.0.co;2-f. [DOI] [PubMed] [Google Scholar]
- 36.Sim FJ, Zhao C, Penderis J, Franklin RJ. The age-related decrease in CNS remyelination efficiency is attributable to an impairment of both oligodendrocyte progenitor recruitment and differentiation. J Neurosci. 2002;22(7):2451–9. doi: 10.1523/JNEUROSCI.22-07-02451.2002. [DOI] [PMC free article] [PubMed] [Google Scholar]
- 37.Smith ER, Allis CD, Lucchesi JC. Linking global histone acetylation to the transcription enhancement of X-chromosomal genes in Drosophila males. J Biol Chem. 2001;276(34):31483–6. doi: 10.1074/jbc.C100351200. [DOI] [PubMed] [Google Scholar]
- 38.Southwood CM, Peppi M, Dryden S, Tainsky MA, Gow A. Microtubule Deacetylases, SirT2 and HDAC6, in the Nervous System. Neurochem Res. 2006 Aug 25; doi: 10.1007/s11064-006-9127-6. [Epub ahead of print] [DOI] [PubMed] [Google Scholar]
- 39.Vermaak D, Ahmad K, Henikoff S. Maintenance of chromatin states: an open-and-shut case. Curr Opin Cell Biol. 2003;15(3):266–74. doi: 10.1016/s0955-0674(03)00043-7. [DOI] [PubMed] [Google Scholar]
- 40.Vo N, Goodman RH. CREB-binding protein and p300 in transcriptional regulation. J Biol Chem. 2001;276(17):13505–8. doi: 10.1074/jbc.R000025200. [DOI] [PubMed] [Google Scholar]
- 41.Vrensen GF. Aging of the human eye lens--a morphological point of view. Comp Biochem Physiol A Physiol. 1995;111(4):519–32. doi: 10.1016/0300-9629(95)00053-a. [DOI] [PubMed] [Google Scholar]
- 42.Zhou GL, Xin L, Liu DP, Liang C. Remembering the cell fate during cellular differentiation. J Cell Biochem. 2005;96(5):962–70. doi: 10.1002/jcb.20572. [DOI] [PubMed] [Google Scholar]
Associated Data
This section collects any data citations, data availability statements, or supplementary materials included in this article.
Supplementary Materials
Supplementary Fig. 1: Age-dependent increase of acetylated nucleosomal histone H3 and other nuclear proteins. Confocal image of high power view of the corpus callosum in coronal brain sections from C57Bl/6 mice of the indicated ages and gender. Acetylated histone H3 (AcH3, panels A-F) and acetylated lysine residues in proteins (Aclys, panels G-L) were identified by immunofluorescence (green) in the nuclei (blue= DAPI staining) of cells in the corpus callosum. Bar graphs represent the results of the AcH3+ (panel M) and Aclys+ (panel N) cell counts normalized by total number of DAPI+ nuclei. (Scale bar= 10 μm, 63X objective; * p< 0.05; *** p< 0.001).