Abstract
We report on the first experiments demonstrating the transcranial acoustic formation of stable gas bubbles that can be used for transcranial ultrasound aberration correction. It is demonstrated that the gas bubbles can be formed transcranially by phase-transitioning single, superheated, micron-size, liquid dodecafluoropentane droplets with ultrasound, a process known as acoustic droplet vaporization (ADV). ADV was performed at 550 kHz, where the skull is less attenuating and aberrating, allowing for higher-amplitudes to be reached at the focus. Additionally, it is demonstrated that time-reversal focusing at 1 MHz can be used to correct for transcranial aberrations with a single gas bubble acting as a point beacon. Aberration correction was performed using a synthetic aperture approach and verified by the realignment of the scattered waveforms. Under the conditions described below, time-reversal aberration correction using gas bubbles resulted in a gain of 1.9 ± 0.3 in an introduced focusing factor. This is a small fraction of the gain anticipated from complete transmit-receive of a fully-populated two-dimensional array with sub-wavelength elements.
Keywords: Acoustic Droplet Vaporization, Time-reversal Acoustics, Medical Diagnosis and Therapy
1 Introduction and Literature
Transcranial ultrasound imaging and therapy are severely limited by the aberration caused by the skull. Several noninvasive techniques have been proposed to correct for this aberration. Transcranial aberration correction techniques can be grouped into four broad categories. The first category uses very low transmit frequencies (250 kHz) where the aberration effects are minimal (Yin and Hynynen, 2005). This technique was demonstrated successfully, however the low frequency limited the resolution that could be achieved for imaging and also the heating that could be achieved for thermal therapy. The second grouping uses an alternative modality (magnetic resonance imaging (MRI) or x-ray computed tomography (CT)) to obtain information about the skull and uses this information to compute the expected aberrations. Hynynen et al. initially proposed that sufficient aberration corrections could be obtained using the skull thickness, as measured by MRI, and a uniform speed of sound, based on the weighted average of the speed of sound in each of the 3 layers of the skull (outer layer, diploë, and inner layer) (Sun and Hynynen, 1998, 1999). This approach was moderately successful in correcting transcranial aberrations. It also suggested that significant improvement in correcting aberrations could be achieved by using different speeds of sound for the different bone densities within the skull. This led to the use of CT instead of MRI due to its ability to measure both skull thickness and density. Clement and Hynynen (2002a) and Aubry et al. (2003) both subsequently reported on the acoustic properties of skull bone based on CT imaging. Clement and Hynynen (2002b) took the next step to perform three-dimensional aberration correction through ten human ex vivo skulls based on the acoustic properties derived from CT images.
Hynynen et al. (2006) have pursued this work further, recently demonstrating the ability to transcranially produce lesions in primates. While this appears to be a very successful technique, it requires the use of a second (ionizing) modality and the accompanying registration between the modalities. A third technique has recently been proposed by Vignon et al. (2006) to obtain the approximate aberration of the skull using two arrays, which are placed on opposing sides of the skull (one on each of the parietal (or temporal) bones). All of the element-to-element responses are obtained between the two arrays to create propagation matrices. The matrices can then be manipulated to isolate the approximate effects of only one side of the skull. This technique suffers from the requirement of using two identical arrays on either side of the skull, which limits the ability to use a hemispherical array to achieve therapeutic pressures in the brain without overheating the skull and skin.
The fourth noninvasive transcranial focusing approach is point-target based aberration correction. Several different point-target based algorithms have been proposed (Flax and O’Donnell, 1988; Zhao and Trahey, 1991; Fink, 1992). All point-target techniques rely on the existence of sparsely distributed point scatterers/point sources in the region of interest. For the vast majority of biomedical applications, there are no native point-targets available. Recently, Pernot and others have demonstrated the feasibility of using ultrasound induced cavitation bubbles as point-targets (Pernot et al., 2006). However, to achieve cavitation bubbles, non-diagnostic pressures must be reached, which may be difficult in a severely aberrating and attenuating medium, such as the skull. Additionally, cavitation bubbles are highly transient, making it difficult to apply many of the proposed multistage focusing algorithms. While there may be some circumstances where transient point-targets are suitable and/or desirable, stable bubbles could be advantageous in several ways. In particular, stable bubbles should allow for more robust and time-consuming point-target aberration correction algorithms, and they may also be used for subsequent therapy when produced in appropriate concentrations (Kripfgans et al., 2002; Psychoudakis et al., 2004).
Here we present an alternative means of achieving a point-target by using acoustic droplet vaporization (ADV). ADV is a technique whereby liquid droplets are phase transitioned into gas bubbles using an acoustic disturbance (Apfel, 1998). The liquid droplets employed and their manufacturing are described in detail elsewhere (Kripfgans et al., 2004). The droplets’ core, dodecafluoropentane (DDFP) (Strem Chemicals, Newburyport, MA, USA), has a bulk fluid boiling point of 29 °C, which is less than normal body temperature (37 °C). The DDFP droplet is stabilized in a superheated state by an albumin shell. In vitro studies have elucidated the values of parameters (such as pulse length, pulse amplitude, presence of nucleation sites) for controlling ADV (Kripfgans et al., 2000; Giesecke and Hynynen, 2003; Kripfgans et al., 2004; Lo et al., 2007). Of these, it has also been found that the vaporization threshold decreases with increasing insonification frequency for short insonification pulses. It is also known that the unaberrated point-spread function’s −6 dB width decreases with increasing frequency, allowing for better localization of vaporization. These both indicate that high frequencies are more suitable. Unfortunately, transcranial aberration and attenuation increase with increasing insonification frequency. This will require a trade-off between minimizing aberration and minimizing the vaporization threshold and spot size. It has also been found that acoustic pressure amplitudes from some diagnostic ultrasound systems are sufficient to vaporize an ADV bubble (Kripfgans et al., 2002).
Preliminary animal studies have shown the in vivo applicability of ADV (Kripfgans et al., 2002, 2005). Specifically, DDFP droplets have been vaporized at particular locations in the canine brain after a standard bilateral craniotomy. The resulting isolated single ADV bubbles had a +23 dB backscatter relative to surrounding brain tissue. From these results, it was hypothesized that ADV bubbles could provide an in situ point-target for aberration correction. The size of the bubbles appears to allow them to lodge in the capillaries, but still remain small enough to act as point-targets even in a non-spherical shape. Numerical simulations have yielded an appropriate ratio for bubble-size to acoustic wavelength (i.e. ka-value) for spherical ADV bubbles to be considered point-targets (Psychoudakis et al., 2004). These values depend on the array dimensions and orientation relative to the bubble.
Below, we demonstrate the ability to perform ADV transcranially and to perform aberration correction for focusing on transmit with a time-reversal focusing algorithm using pulse-echo and pitch-catch signals from a single microbubble (Fink, 1992). Focusing in this case should be associated with waveform alignment at the focus on transmit, rather than receive focusing for image formation.
2 Materials and Methods
2.1 Transcranial Insertion Loss
Prior work has shown that skull preparation affects the acoustic properties of an ex vivo human skull (Lang, 1970; Fry and Barger, 1978; Lees et al., 1979). Therefore, prior to performing transcranial ADV and aberration correction, the effects of skull hydration and the gas content of the hydrating water on the ultrasound transmission were studied. An ex vivo human skull was obtained from, and experiments approved by, the Anatomical Donations Program within the University of Michigan Medical School. The skull, which was dry from storage in air, was placed in a water tank with gas-saturated water at 22±2 °C. A transcranial pulse-echo signal was measured as a function of hydration time using a 1 MHz, 3.8 cm diameter, unfocused Panametrics V392 immersion transducer (Olympus, Waltham, MA, USA). The echo was obtained off a 10.1 cm diameter, 2.7 cm thick brass plate, which acts as a reference reflector that is −0.6 dB from a perfect reflector assuming an acoustic impedance of 40.6 MRayl (Erikson et al., 1981). After the fiftieth hour of hydration, degassing of the water was initiated. Degassing was performed using the multiple pinhole method described by Kaiser et al. (1996).
2.2 Transcranial ADV
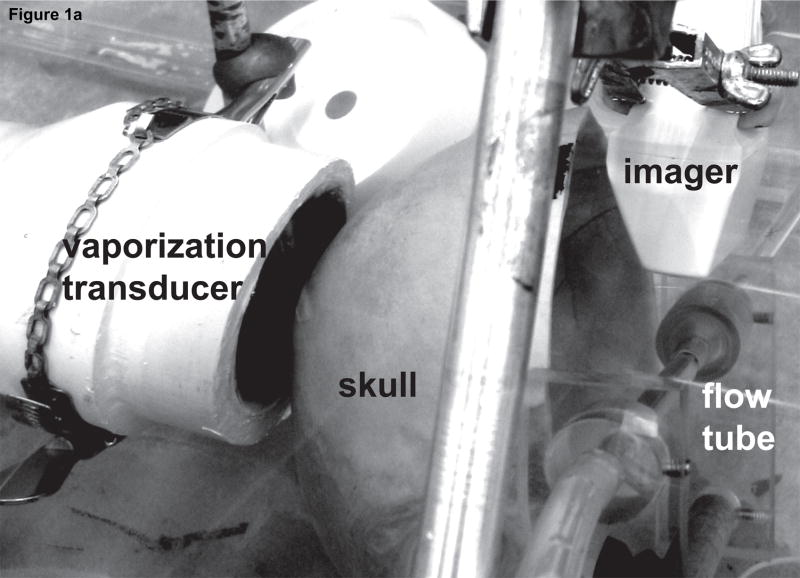
Figure 1 shows the setup used to perform transcranial ADV. The procedure for creating droplets for vaporization has been described by Kripfgans et al. (2004). Droplets were vaporized using a 550 kHz, 70 mm diameter, 100 mm focal-length, air-backed, lead zirconate titanate (PZT-4) transducer (Channel Industries, Santa Barbara, CA, USA). The vaporization pulse was a 1000 cycle, 550 kHz tone burst generated with an HP33120A function generator (Agilent, Palo Alto, CA, USA) and amplified using an ENI A-300 power amplifier (Rochester, NY, USA). The long pulse length was chosen to lower the vaporization threshold as demonstrated by Giesecke and Hynynen (2003) and Lo et al. (2007). A flow tube (Spectra/Por 8 mm flat width, Spectrum Laboratories Inc., Rancho Dominguez, CA, USA) oriented 45° relative to the direction of gravity was filled with saline (0.9% Sodium Chloride Irrigation, USP, Abbott Laboratories, North Chicago, IL, USA) and 50 × 103 DDFP droplets per mL of saline. Additionally, 600 × 103 ultrasound contrast agent (UCA) microspheres (Definity, DuPont Pharmaceuticals Company, Billerica, MA, USA) per mL of saline were added to further reduce the vaporization threshold (Lo et al., 2007). The flow tube was part of a closed system (with a trap for vaporized ADV bubbles, which have a much greater buoyancy than UCA bubbles) with the saline, UCA, and DDFP droplets being continuously recirculated from a reservoir used for stirring the fluid at room temperature (22±2 °C). A 10 MHz linear array connected to a Diasonics VST Master Series clinical ultrasound scanner (GE Medical Systems, Milwaukee, WI, USA) was placed perpendicularly to the axial direction of the vaporization transducer and parallel to the flow tube to acoustically observe the creation of ADV bubbles with B-mode images. The lowest transmit power was used to prevent the 10 MHz array from vaporizing DDFP droplets, and this was verified by a lack of echogenicity in B-mode images. An ex vivo human skull was placed between the vaporization transducer and flow tube. The particular orientation through the parietal bone of the skull was chosen to mimic the projected orientation that would be used in future in vivo work.
Figure 1.
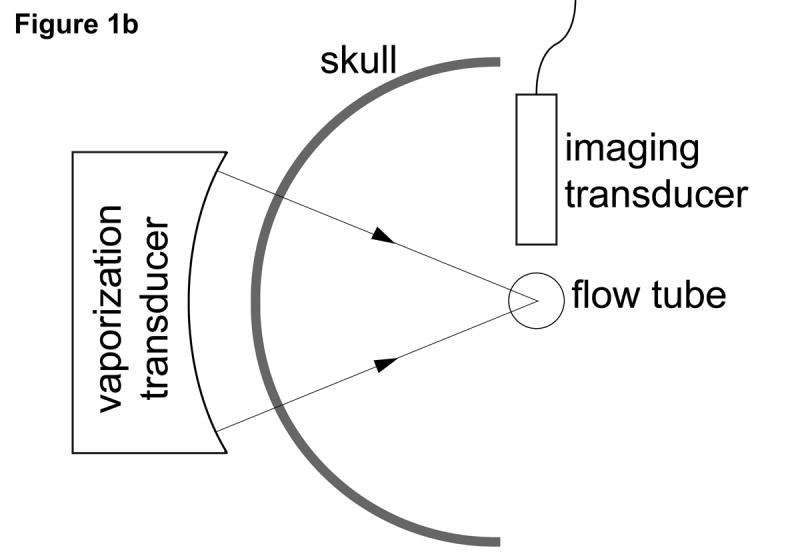
(a) Photo and (b) schematic of the experimental setup used for transcranial acoustic droplet vaporization. The vaporization transducer can be seen to the left of the skull. A flow tube (right of the skull), carries the DDFP droplet-UCA-saline mixture. A linear array (top right) was used to observe ADV.
2.3 Single Bubble Production and Detection
Following the demonstration of transcranial ADV, we separately created and detected single bubbles that were later used to perform aberration correction. The bubbles were created using the following setup, which was different than the transcranial ADV setup to ensure that only a single bubble was present.
2.3.1 Bubble Production
Two different methods of producing and isolating single bubbles were employed. To keep the bubbles from moving, dialysis tubing (Spectra/Por 14.6 mm flat width, Spectrum Laboratories Inc., Rancho Dominguez, CA, USA) was filled with LithoClear ultrasound gel (Sonotech Inc., Bellingham, WA, USA), which is free of micro- and macrobubbles. The high viscosity of Litho-Clear significantly reduced bubble motion due to buoyancy. The dialysis tubing was held taut, reducing lateral motion due to water currents. As a result, microbubbles could be suspended, without axial, lateral, or elevational motion, for tens of minutes. A stereo-microscope (Nikon SMZ-U, Nikon, Melville, NY, USA) was used to observe changes in bubble diameter due to bubble dissolution or gas uptake (figure 2).
Figure 2.
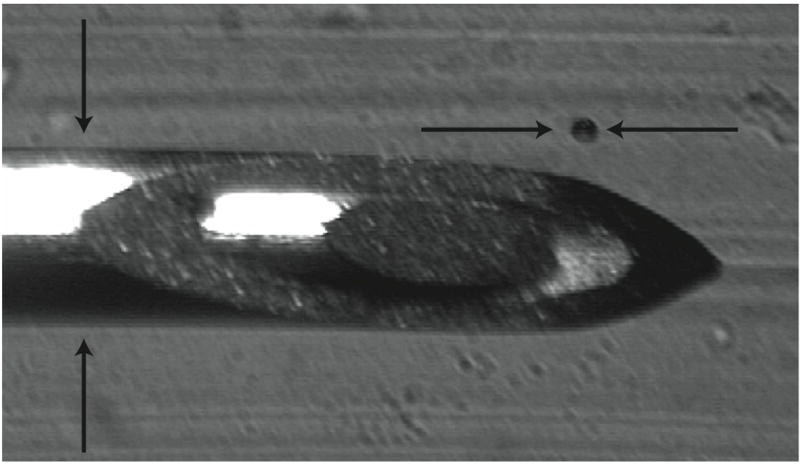
Sample image of an air bubble (104 μm ± 11μm) and 22 gauge needle (705 μm ± 5 μm diameter). The needle was used as the reference scale when determining bubble sizes and then removed for experiments.
The initial method used to create air bubbles was direct injection of air using a 25-gauge quincke-type spinal needle (Becton, Dickinson and Company, Franklin Lakes, NJ, USA). Bubbles were created by partially withdrawing the stylet in air. Then the tip of the needle was placed at the desired location for the bubble in the LithoClear. The stylet was then fully inserted in the needle. The air in the hollow of the needle was displaced into the gel and formed a bubble. The size of the bubble could be varied based on how much the stylet was initially withdrawn. Bubbles could be removed from the gel by placing the needle tip near the bubble and removing the stylet partially to create a vacuum. These techniques allowed for the precise positioning of bubbles within the dialysis tube and the removal of any bubbles introduced when injecting the LithoClear into the dialysis tubing. All bubbles created in this manner will hereafter be referred to as air bubbles. Air bubbles under 150 μm were found to be particularly susceptible to dissolution. The smaller the bubble size, the larger the Laplace pressure acting on the relatively highly diffusible gas (air).
The second method devised to create bubbles was direct injection of DDFP droplets into the LithoClear gel. Droplets were vaporized using the above described 10 MHz Diasonics linear array but this time operating at high transmit power. In the case of multiple droplets vaporizing, the spinal needle was used to remove all but one of the bubbles. All bubbles created in this manner will hereafter be referred to as ADV bubbles. These bubbles were found to be more stable and did not change diameter over the course of a single experiment (approximately ten minutes). The stability is primarily ascribed to the relatively high molecular weight of DDFP (C5F12), the approximate steady state between the infusing ambient gasses and the outfusing DDFP, and the Laplace pressure. This second method was used to ensure the results would be as close as possible to future in vivo work with ADV bubbles. However, the initial method of injecting air bubbles had the advantage of easier to control bubble size.
2.3.2 Bubble Detection
Figure 3 is a schematic of the setup used for acoustic detection of a single bubble. Initial alignment was performed with the skull removed. A diplexer (RDX-6, Ritec Inc., Warwick, RI, USA) allowed a 1 MHz, 38.1 mm diameter, unfocused Panametrics V392 transducer to be used in pulse-echo mode. The transmit pulse was created with an HP33120A arbitrary function generator and amplified with an ENI A-300 power amplifier. The receive signal was recorded with a Lecroy 9314L oscilloscope (Chestnut Ridge, NY, USA). The transducer orientation was then adjusted by hand until the echo strength was maximized. The skull was then placed between the transducer and dialysis tubing. Following alignment, a laser beam perpendicular to the axis of the dialysis tube was used to mark the approximate location of the bubble. This allowed bubbles to be quickly placed in the correct position in subsequent experiments, which was important for small bubbles that dissolve quickly.
Figure 3.
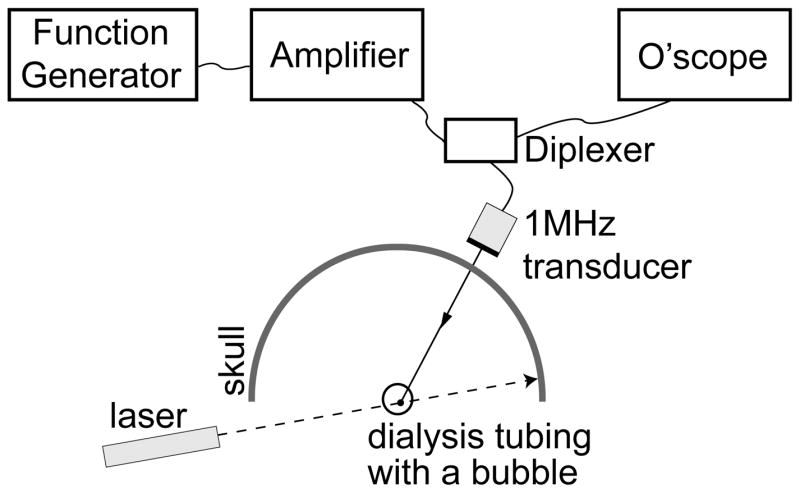
Schematic of setup used for single bubble acoustic detection.
As the size of the bubble decreases, it becomes increasingly difficult to isolate the bubble-produced echo from reverberations due to the skull and echoes off the dialysis tubing. To reduce this problem, signal subtraction was used, where waveforms were obtained with and without extraction or dissolution of the bubble and then subtracted.
2.4 Time-Reversal Focusing
After detecting a single bubble transcranially, a synthetic aperture technique was used to perform aberration correction with time-reversal focusing. The synthetic aperture (figure 4) was formed using two single-element, 1 MHz, 38.1 mm diameter V392 Panametrics transducers. One transducer was connected to a rotational stage to simulate elements of a curved aperture array. The center of rotation was approximately coincident with the center of the dialysis tubing.
Figure 4.
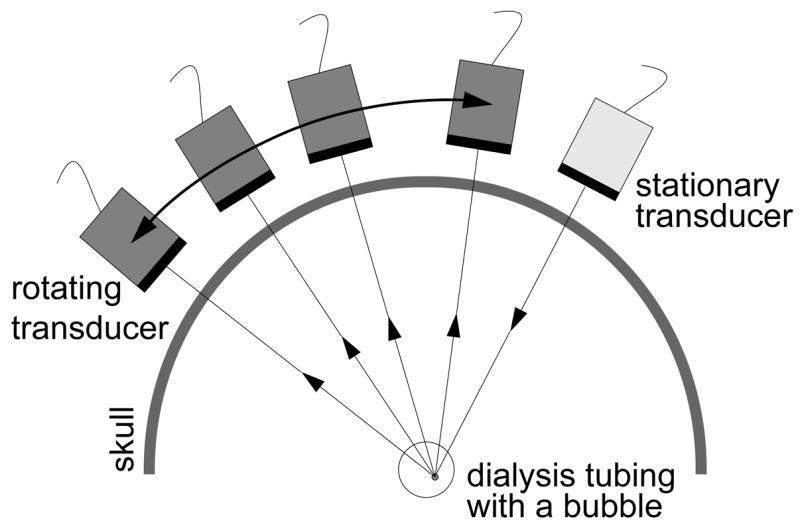
Schematic of the synthetic aperture setup used.
Time-reversal focusing was initially performed by transmitting a short (3–7 cycle) 1 MHz burst from the stationary transducer with no bubble in place. The moving transducer then recorded the pitch-catch signal at N angles. Typically 60–150 temporal waveforms were averaged at each angle to minimize electronic noise. Next, a bubble was produced and the process repeated. Signal subtraction was performed at each angle i to yield: ri(t) = si, bubble(t) − si, no bubble(t), where si(t) is the echo recorded at the ith angle. These N waveforms were then time-reversed, ri(t) → ri(−t), and the amplitude of each waveform was normalized to its maximum absolute value: ui(t) = ri(−t) / max(time)[|ri(t)|]. Each waveform ui(t) was then retransmitted from the moving transducer at the ith angle. The stationary transducer recorded the echo corresponding to each ui(t) transmitted. The bubble was then removed and the time-reversed waveforms were again retransmitted and the pitch-catch signal recorded at the appropriate angles again. Signal subtraction was again performed to remove signals not from the bubble (i.e. the skull and flow tube walls). This process demonstrates the ability to focus on transmit by having all transmitted signals arrive at the bubble at the same time and thus all echoes arrive at the receiving transducer at the same time. The entire process required approximately 10 minutes, primarily due to mechanical transducer motion and signal averaging. Future use of parallel acquisition with a more sensitive array can significantly reduce this time by eliminating the time due to motion and decreasing the required number of averages.
2.4.1 Spatial Reciprocity
To simplify and decrease the time needed to perform the aberration correction experiments it was desirable to transmit both the original pulse and the time-reversed waveform from the stationary transducer. This relies on spatial reciprocity since the source and receiver locations are switched when transmitting the time-reversed waveform. There may be multiple reasons for a violation of spatial reciprocity, for example mode conversion in the skull (White et al., 2006). To test reciprocity, a synthetic aperture experiment was performed as described earlier using a 100 μm diameter wire as a target (for increased echogenicity and stability of the target). A second synthetic aperture experiment was performed with the stationary transducer transmitting both the initial pulse and the time-reversed signals. The corresponding waveforms were compared.
3 Results
3.1 Transcranial Insertion Loss
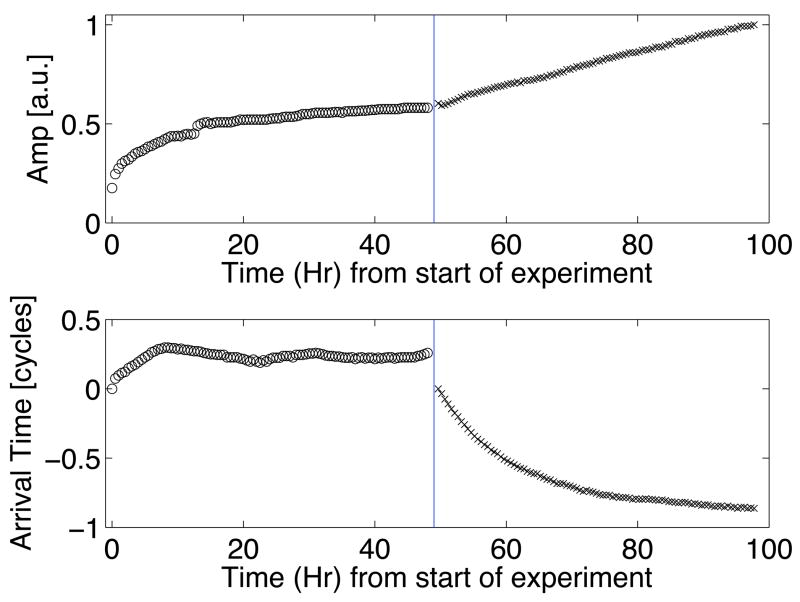
Hydration of the skull decreased the insertion loss (i.e. losses observed due to the insertion of the skull, as defined by Fry and Barger (1978)) as shown during hours zero to forty-eight in the top plot of figure 5. Initially, the transmission amplitude increased rapidly. After approximately 15 hours, the change in the signal decreased and the amplitude appeared to saturate. A λ/4 shift in the arrival time corresponding to a decrease in the average speed of sound was also observed during hydration. The decrease in speed of sound with hydration has been reported by others for other bones (Duck, 1990; Lees et al., 1979; Lang, 1970). Since the arrival time and transmission appear to reach a steady state, it was assumed that the skull was fully hydrated after 48 hours. Data during degassing can be seen to the right of the vertical lines in figure 5. After 48 hours of degassing, the transmission amplitude had linearly increased from a normalized value of 0.6 to 1. The shift of the arrival time decreased in a manner similar to the change in expected gas content based on the multiple pinhole degassing technique.
Figure 5.
Transcranial pulse-echo amplitude (top) and arrival time (bottom) as a function of hydration and degassing time. All data points to the left of the vertical divider were taken during hydration of the skull; points to the right were taken for continued hydration and also degassing of the hydrating water.
For the set of experiments to follow, the absolute value of the insertion loss and speed of sound is not as important as maintaining constant values over the duration of the experiment. This is because of the extended time needed to perform each experiment as described below (approximately 10 minutes). As a result, all the following experiments will employ a skull that was hydrated in gas-saturated water for at least 48 hours.
We additionally note that several factors suggest that the experimental setup used will have an insertion loss equal to or greater than the insertion loss that would be experienced due to the skull only in an in vivo experiment. We refrain from describing it as a “worst-case” scenario (i.e. highest possible insertion loss) for measuring the echo from a micron-size air bubble because of the large variability in attention from point-to-point on a skull and from skull to skull (Theismann and Pfander, 1949). First, Fry and Barger (1978) found that the insertion loss of formalin-fixed skulls was 3 dB greater than a fresh skull on average, indicating that in in vivo experiments, the skull bone insertion loss will decrease. Second, transmission was through the parietal bone approximately 3.5 cm posterior of the coronal suture, as opposed to the thinner and more acoustically transparent temporal bone. Finally, the aperture size of the transducers used likely increases the observed insertion losses due to phase cancellation across the face of the transducer (Duck, 1990).
3.2 Transcranial ADV
Transcranial ADV, pre-, during, and post-vaporization can be seen in the left, middle, and right B-mode images respectively of figure 6a. The increase in echogenicity during vaporization and persisting afterwards indicates the transcranial production of stable ADV bubbles and not the illumination of UCA and/or DDFP droplets. For comparison, sham experiments were performed with both high-amplitude, long duration (1000 cycle) vaporization pulses focused on a UCA/saline mixture in the flow tube and with high-amplitude but relatively short (400 cycle) vaporization pulses with the UCA/DDFP droplets/saline mixture. Further demonstrating that ADV was accomplished transcranially, figure 6b shows the B-mode images for the short vaporization pulse with DDFP droplets and UCA in the flow tube. In this case the pulse is too short to cause ADV at this amplitude and as a result, the echogenicity increases only during the pulse as a result of the high amplitude illumination of UCA and DDFP droplets. A similar illumination result was seen when DDFP droplets were not in the flow mixture and long (1000 cycle), high amplitude vaporization pulses were used.
Figure 6.
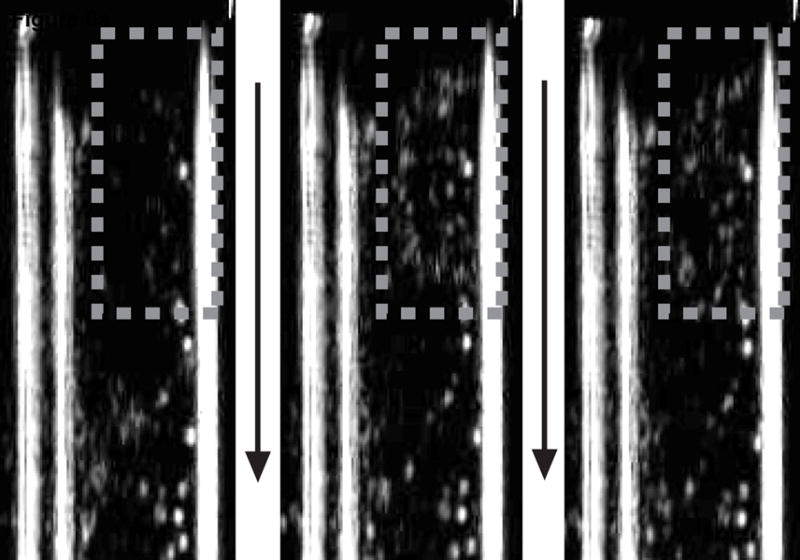
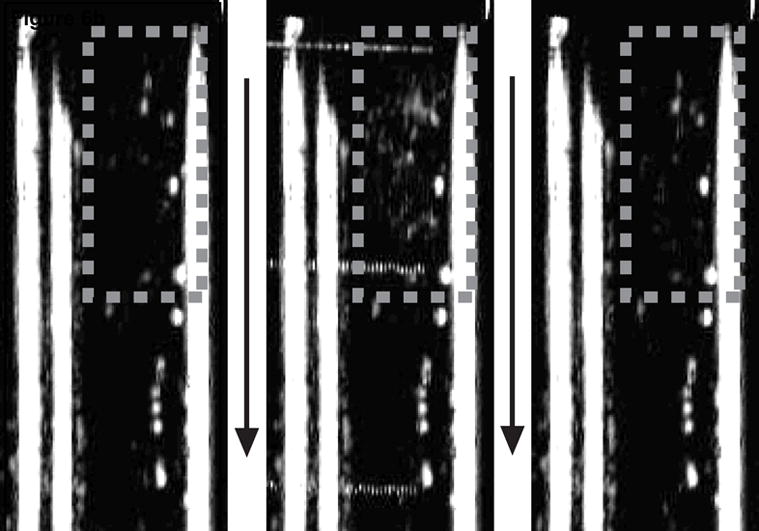
Each image shows the flow tube either before the vaporization pulse (left), during the vaporization pulse (middle), or after the vaporization pulse (right). Flow is in the direction of the arrows. The gray dashed box indicates the approximate focus of the vaporization transducer. A 1000 cycle vaporization pulse caused ADV with the increased echogenicity persisting after the pulse (a). A 400 cycle pulse just illuminated the droplets and contrast agent during the pulse with no echogenicity persisting (b).
3.3 Single Bubble Production and Detection
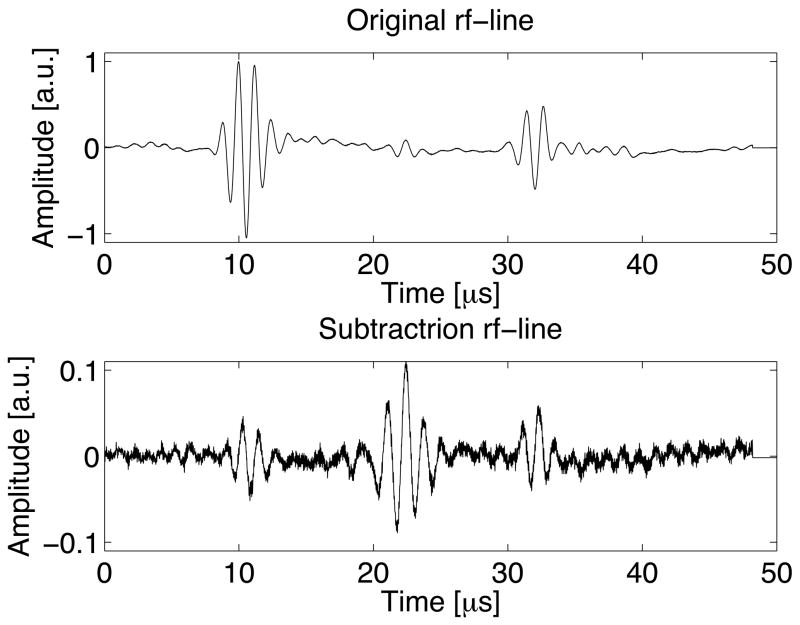
The production of a single air bubble is seen optically in figure 2. When detecting the bubble transcranially, signal subtraction increased the relative bubble echo amplitude as compared to other echoes and reverberations by an order of magnitude or more (figure 7). Note that signal subtraction did not entirely eliminate echoes from the wall and reverberations related to the skull. This will introduce errors in the later time-reversal experiments. Future in vivo work could employ similar techniques by recording waveforms before and after vaporization using array technology. Since this can be accomplished in a few milliseconds, suppression of non-bubble signals are anticipated to be greater, and most motion associated with the patient would not result in significant problems.
Figure 7.
A waveform using a 118 μm bubble before subtraction (top) and, on the same time scale, after subtraction (bottom). The echo at 22 μs is from the bubble, while the echoes at 10 μs and 32 μs are from the dialysis tube walls. Both plots use the same arbitrary units, so the magnitudes of the waveforms can be directly compared.
3.4 Time-Reversal Focusing
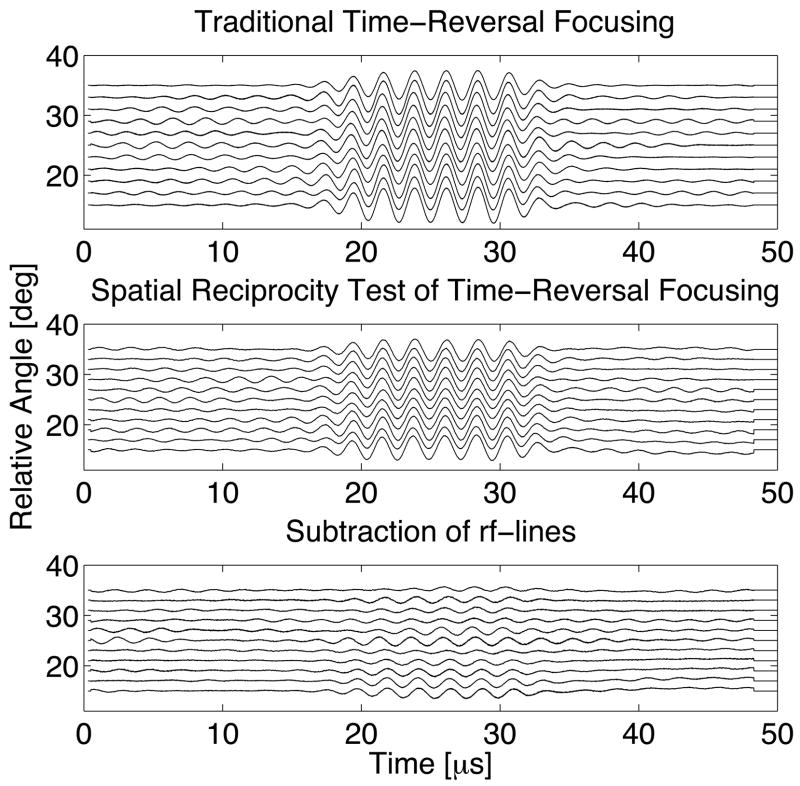
Waveforms testing spatial reciprocity in the configuration of figure 4 can be seen in figure 8. The significant decrease in amplitude after signal subtraction indicates that spatial reciprocity holds substantially for the experimental conditions. Quantitatively, the pulses for the subtracted waveforms have approximately 10% of the energy of the original waveforms. The incomplete subtraction may be due to small effects related to mode conversion, phase cancellation across the apertures, or possibly movement of the wire due to currents in the tank. All subsequent experiments always transmit from the stationary transducer.
Figure 8.
Series of sequential transcranial pitch-catch waveforms as a function of the angular position of the moveable transducer in figure~4 for traditional time-reversal focusing (top), employing spatial reciprocity for time-reversal focusing (middle), and subtracting the two sets of waveforms to determine their similarity (bottom).
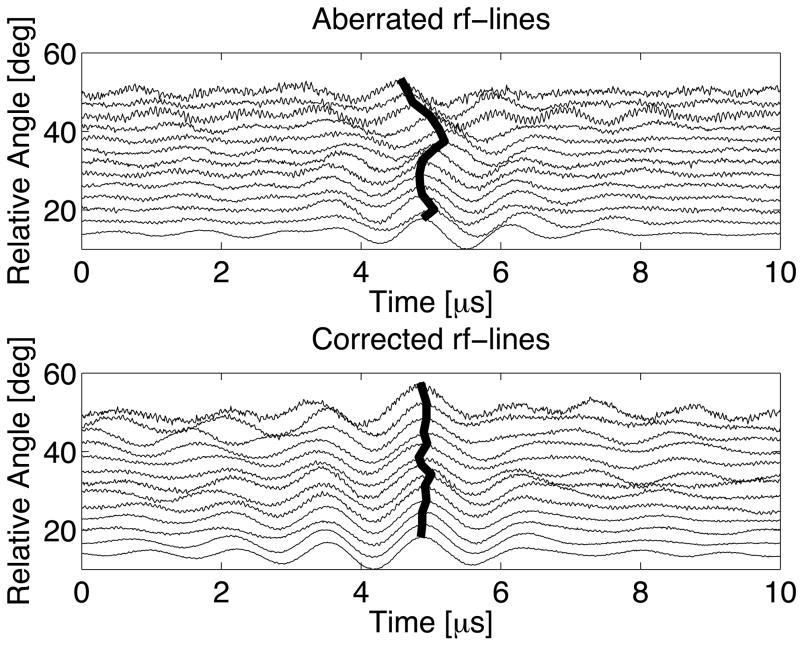
An example of transcranial time-reversal focusing with signal subtraction using an ADV bubble can be seen in figure 9. The top plot shows amplitude normalized waveforms with skull-induced aberrations for various angular positions of the moveable transducer setup (figure 4) with a maximum relative phase shift of nearly λ/2. The bold lines follow constant phase (based on the maximum amplitude of each waveform). Following time-reversal focusing, the waveforms are aligned with a maximum relative shift of only λ/10. Additionally, the standard deviation of the phase shifts for the aberrated case is three and a half times greater than the corrected case (0.135λ and 0.038λ respectively). The waveforms that were transmitted at the relative angles of 47° and 50° appear to contain more noise and off-peak oscillations. For the particular orientation of the skull, the waveforms at larger angles were more significantly attenuated. As a result, after subtracting the original waveforms at this angle there was a relatively larger contribution from the incomplete subtraction of non-bubble related echoes and reverberations. The amplitude correction scheme employed in these experiments normalized the amplitude of all time-reversed waveforms to be transmitted to a peak-to-peak value of unity, thus accentuating these errors and causing the poorer results.
Figure 9.
Transcranial waveforms for the synthetic aperture using a 118 ± 24 μm ADV bubble before (top) and after time-reversal focusing (bottom). Each waveform amplitude has been individually normalized to unity to emphasize the (mis)alignment of phase.
To quantify the effectiveness of the time-reversal focusing method, a focusing factor, F, was defined.
| (1) |
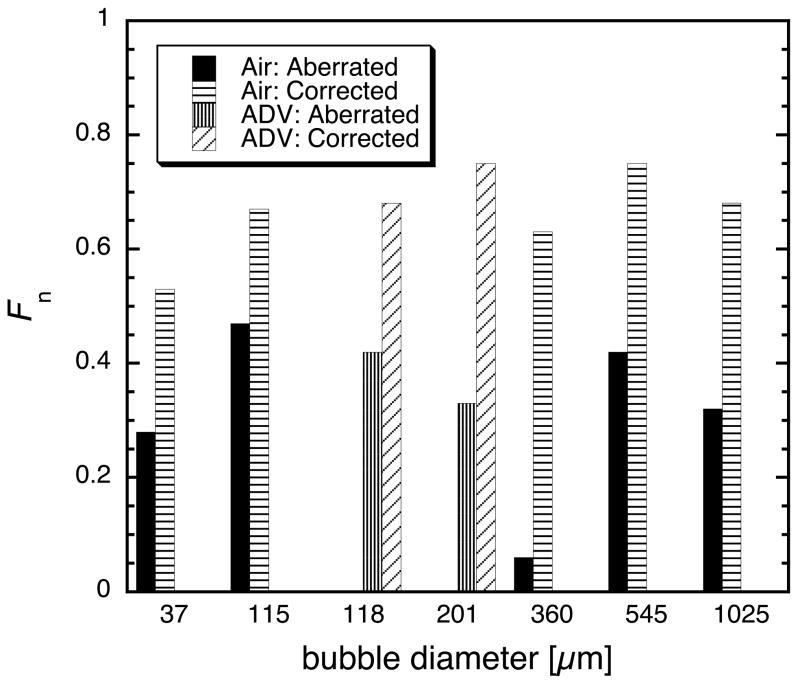
where ψi(t) refers to the ith waveform with N waveforms recorded. The denominator of equation 1 is directly proportional to the total energy received by the aperature. The numerator is directly proportional to the energy received taking into account the interference caused by a misalignment of the phases of each waveform. In other words (with the proportionality constants canceling), equation 1 is the energy of the coherently summed waveforms divided by the sum of the energy of each individual waveform, normalized to unity. Focusing factors were computed for aberrated and corrected waveforms for seven bubbles ranging from approximately 50 μm to 1 mm (figure 10a). Faberrated ranged from 0.25 to 0.45 (except for one case discussed later), and Fcorrected ranged from 0.5 to 0.8. For reference, the focusing factor obtained when testing spatial reciprocity with the wire target was 0.95 (see previous discussion of spatial reciprocity as to why the focusing factor is not unity). This sets an upper bound for the expected values of F under more ideal circumstances.
Figure 10.
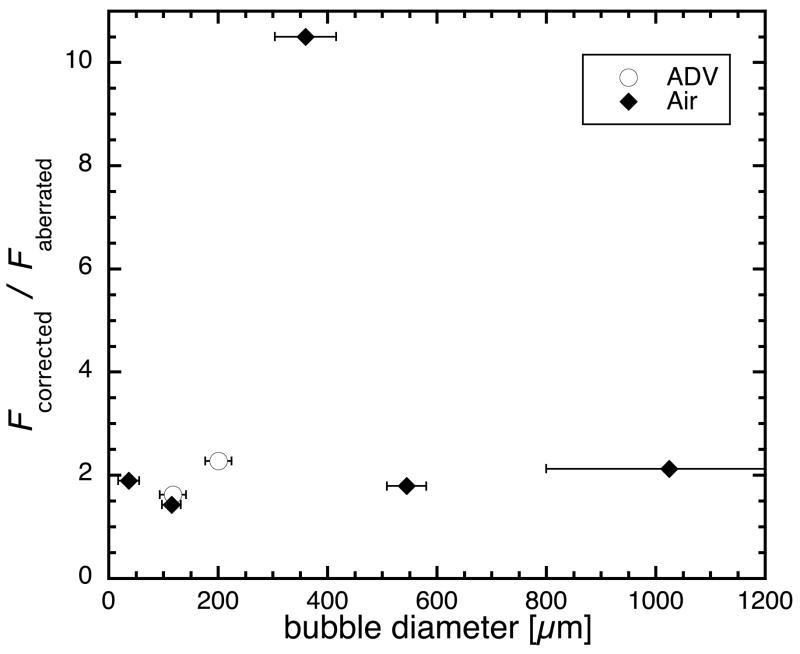
(a) The focusing factor for seven bubbles before (gray) and after (black) aberration correction. (b) The gain in the focusing factor: Fcorrected / Faberrated. Uncertainty in bubble diameter is the result of blurring due to refraction in the optical imaging of the bubbles.
Figure 10b shows the focusing factor ratio for each bubble (Fcorrected/ Faberrated). The experiments were all performed through a similar portion of the skull (i.e. there was only minimal relative movement between the transducers, skull, and bubble for the various trials). The movable transducer traveled over an arc length of approximately 13 cm (35°), which is approximately 3.3 times the transducer diameter. Excluding the 360 μm bubble, which had a gain of 10.5, the gain from time-reversal focusing using a bubble is 1.9 ± 0.3. For the 360 μm bubble, the aberration for the particular transducer-skull orientation was such that it resulted in nearly maximal destructive interference between the waveforms. This reduced Faberrated more significantly than in the other cases. In general, the variation of Faberrated is highly dependent on the skull location and can significantly affect the focusing factor ratio. For this reason, one should not assume that the gains reported here are the gains that will be observed in general for this approach to aberration correction. Rather these gains demonstrate that the technique yields improvements in focusing. The gains may also reflect a lower bound for what would be expected through this portion of the skull with more sophisticated array electronics, transmitters, and receivers (see below). Due to the larger variability of the skull, one should expect these gains to change as different portions of the skull are traversed, however these results show that one should expect there to be gains due to this process if there is any aberration of the beam. The use of 38.1 mm diameter transducers minimized and smoothed the aberration fluctuations across the skull because of phase averaging over the face of the transducer. Future work with smaller transducer elements (λ/2 to λ in diameter) will result in significantly less phase averaging and thus more variation. It is hypothesized that this will lead to even smaller focusing factors in the aberrated case. Work done at higher frequencies is also be expected to decrease Faberrated due to the frequency dependence of human skulls (Fry and Barger, 1978). More sophisticated electronics with lower capacitive losses and a better signal to noise ratio will also yield better sensitivity to small acoustic amplitudes and thus better alignment of phases, increasing Fcorrected.
4 Discussion and Summary
In demonstrating transcranial ADV, we were concerned with proof-of-concept. No effort was placed in determining the minimum pulse-lengths or pressure amplitude needed to cause ADV. It has been seen that there are multiple regimes for inducing ADV when using different values for variables such as frequency, pulse-length, pressure amplitude, and UCA (Kripfgans et al., 2002; Giesecke and Hynynen, 2003; Lo et al., 2007). Further study of these mechanisms and their corresponding thresholds should be performed to see which ones will be most amenable to achieving transcranial ADV with conditions that would be acceptable for in vivo studies. Additionally, the design of future arrays will play a role in determining the pulse-lengths and transmit amplitudes needed based on the relationship between the array’s spatial extent and the corresponding degree of aberration. This in turn will be subject to skull heating limitations (for therapeutic arrays). Here we merely demonstrated that transcranial ADV is achievable.
In addition to transcranial ADV, the above experiments have demonstrated the ability to perform transcranial aberration correction on transmit with a single ADV bubble using time-reversal focusing. We acknowledge that our approach was limited since it employed a synthetic aperture (with an unfocused element), rather than a full one-dimensional or two-dimensional aperture as would be ideal. It was however, a simple and effective means of demonstrating the effect. The use of a synthetic aperture does not allow one to perform the typical spatial lateral-elevational focusing based on interference of multiple simultaneously fired waveforms. Without being able to fire multiple waveforms simultaneously, one does not achieve the “null” spots in the field where the waveforms interfere destructively and thus would not produce an echo if a scatterer were placed there. With a synthetic aperture the “null” does not exist and thus one does receive scattering from the location. The synthetic aperture did allow us to demonstrate the temporal (axial) focusing that was achievable with a single ADV bubble. Having seen that temporal focusing is possible, one can expect spatial (lateral-elevational) focusing will be achieved with a full one-dimensional or two-dimensional array in future work. We draw a parallel between our results and those achieved by Parvulescu and Clay (1965), which both used unfocused sources in time-reversal experiments, in comparison to the more recent time-reversal experiments which have verified that spatial focusing does occur when directional arrays are used. Parvulescu and Clay (1965) also demonstrate how this approach, using non-directional (unfocused) transmitters, takes into account multiple paths and thus differentiates itself from merely adjusting the phases of the waveforms based on arrival times. If multiple paths are not significant, then the two methods become essentially degenerate.
Additionally, these experiments and results point towards a possible in vivo, ultrasound-only based transcranial aberration correction scheme for therapeutic ultrasound. First, a patient would receive an intravenous injection of micron-size, transpulmonary DDFP droplets and UCA. A few circulated droplets would then be vaporized in and near the region-of-interest using geometrical (spherical) focusing as aberrated by the skull. This can be done at low frequencies (500 kHz or less) to minimize the aberration of the beam and allow for vaporization only in and near the desired region. As Yin and Hynynen (2005) showed numerically at 250 kHz, the foci were only shifted by 1.6 ± 0.8 mm and the −3 dB beam width and length were 4.3 ± 1.0 mm and 7.7 ± 1.8 mm, respectively. This should allow for vaporization localization within these limits. The resulting sparse array of ADV bubbles could be used as point-scatterers for aberration correction, leading to higher-resolution and higher-intensity focused ultrasound therapy. If the vaporization is not close enough to the desired region, the aberration information obtained from the created bubbles may be used to more accurately steer the beam to the desired location. If tumor targeting is performed, using the technique described above, with an ultrasound array, preferably a two-dimensional array with independently addressable transmit and receive channels on every sub-wavelength element, aberration correction could be performed for high-resolution diagnosis, targeting, and treatment assessment, with the resolution approaching the value obtained in a water-path only experiment. Based on the experiments reported here, and those previously reported by our group, demonstrating in vivo intravenous injections and vaporization of DDFP droplets, we feel that there is a high probability of realizing the ultrasound-only based transcranial aberration correction scheme just outlined for focusing on transmit.
The next step will be to use one- or two-dimensional arrays to induce ADV and then perform aberration correction with the newly created ADV bubbles. As part of this work, a study of the effect of more closely spaced bubbles and the ability to chose which bubble to focus on should be done. The ability to create an appropriately sparse distribution of bubbles should be demonstrated for focusing throughout a region-of-interest. Additionally, more sophisticated amplitude correction schemes should yield additional improvements to the focusing (Pernot et al., 2003; White et al., 2005).
Currently, the techniques we have reported only demonstrate focusing on transmit, as would be needed in therapy. Image formation however requires focusing on transmit and receive. Focusing on transmit is essentially concerned with minimizing the spatial extent of the focal spot and minimizing sidelobes. Both of these are done so that all returning echos can be associated as coming from the same location (which we described above). Focusing on receive is concerned with properly associating the returning echos with a grayscale value at a particular known location, i.e. creating an actual image from the received data. Knowledge of the precise location of the bubbles is, however, currently unknown, thus making image formation problematic. One might be able to circumvent this problem by obtaining the approximate location of the bubbles from a poor resolution unaberrated image using low frequencies. The aberration corrected data could then be registered to the low frequency image. Alternatively, one could perform matched-filter processing based reconstruction. In this technique, one would use the scatter from individual scatterers to get the correct delays for summing the waveforms appropriately. However to determine the location of the scatterers, the scattered waveforms can be fitted to spherical delays. This technique would clean-up an image by focusing on transmit and receive correctly, but would also result in warping due to determining scatterer location from a best-fit to cylindrical delays. A second technique we envision is transmitting at low frequencies to vaporize and produce echoes from the bubble. Then filtering the receive signal for the second (or higher) harmonic and retransmitting the time-reversed harmonic to focus with greater precision. The filtering may be done individually on each waveform to create a ‘boot-strapping’ technique to focus on the bubbles at higher frequencies iteratively or as a step in the DORT method (Prada et al., 1996). This process could be iterated. More sophisticated receive focusing algorithms may be developed in the future.
Acknowledgments
This work was supported in part by NIH grants 5R01EB000281 and 1R21CA116043.
Footnotes
Publisher's Disclaimer: This is a PDF file of an unedited manuscript that has been accepted for publication. As a service to our customers we are providing this early version of the manuscript. The manuscript will undergo copyediting, typesetting, and review of the resulting proof before it is published in its final citable form. Please note that during the production process errors may be discovered which could affect the content, and all legal disclaimers that apply to the journal pertain.
References
- Apfel RE. Patent. Apfel Enterprises, Inc; 1998. Activatable infusable dispersions containing drops of a superheated liquid for methods of therapy and diagnosis. [Google Scholar]
- Aubry JF, Tanter M, Pernot M, Thomas JL, Fink M. Experimental demonstration of noninvasive transskull adaptive focusing based on prior computed tomography scans. Journal of the Acoustical Society of America. 2003;113(1):84–93. doi: 10.1121/1.1529663. [DOI] [PubMed] [Google Scholar]
- Clement GT, Hynynen K. Correlation of ultrasound phase with physical skull properties. Ultrasound in Medicine and Biology. 2002a;28(5):617–624. doi: 10.1016/s0301-5629(02)00503-3. [DOI] [PubMed] [Google Scholar]
- Clement GT, Hynynen K. A non-invasive method for focusing ultrasound through the human skull. Physics in Medicine and Biology. 2002b;47(5):1219–1236. doi: 10.1088/0031-9155/47/8/301. [DOI] [PubMed] [Google Scholar]
- Duck FA. Physical Properties of Tissue: A Comprehensive Reference Book. Academic Press Inc., Academic Press Limited; 24–28 Oval Road, London NW1 7DX: 1990. [Google Scholar]
- Erikson KR, Banjavic RA, Carson PL. Standard methods for testing single-element pulse-echo ultrasonic transducers - AIUM Interim Standard. Journal of Ultrasound in Medicine. 1981;1(S):1–18. [Google Scholar]
- Fink M. Time-reversal of ultrasonic fields - part I: Basic principles. IEEE Transactions on Ultrasonics, Ferroelectrics, and Frequency Control. 1992;39(5):555–566. doi: 10.1109/58.156174. [DOI] [PubMed] [Google Scholar]
- Flax S, O’Donnell M. Phase-aberration correction using signals from point reflectors and diffuse scatterers: Basic principles. IEEE Transactions on Ultrasonics, Ferroelectrics, and Frequency Control. 1988;35(6):758–767. doi: 10.1109/58.9333. [DOI] [PubMed] [Google Scholar]
- Fry FJ, Barger JE. Acoustical properties of the human skull. Journal of the Acoustical Society of America. 1978;63(5):1578–1590. doi: 10.1121/1.381852. [DOI] [PubMed] [Google Scholar]
- Giesecke T, Hynynen K. Ultrasound-mediated cavitation thresholds of liquid perfluorocarbon droplets in vitro. Ultrasound in Medicine and Biology. 2003;29(9):1359–1365. doi: 10.1016/s0301-5629(03)00980-3. [DOI] [PubMed] [Google Scholar]
- Hynynen K, McDannold N, Clement GT, Jolesz FA, Zadicario E, Killiany R, Moore T, Rosen D. Pre-clinical testing of a phased array ultrasound system for MRI-guided noninvasive surgery of the brain -a primate study. European Journal of Radiology. 2006;59:149–156. doi: 10.1016/j.ejrad.2006.04.007. [DOI] [PubMed] [Google Scholar]
- Kaiser AR, Cain CA, Hwang EY, Fowlkes JB. A cost effective degassing system for use in ultrasonic measurements: The multiple pinhole degassing system. Journal of the Acoustical Society of America. 1996;99(6):3857–3860. [Google Scholar]
- Kripfgans OD, Fabilli ML, Carson PL, Fowlkes JB. On the acoustic vaporization of micrometer-sized droplets. Journal of the Acoustical Society of America. 2004;116(1):272–281. doi: 10.1121/1.1755236. [DOI] [PubMed] [Google Scholar]
- Kripfgans OD, Fowlkes JB, Miller DL, Eldevik OP, Carson PL. Acoustic droplet vaporization for therapeutic and diagnostic applications. Ultrasound in Medicine and Biology. 2000;26(7):1177–1189. doi: 10.1016/s0301-5629(00)00262-3. [DOI] [PubMed] [Google Scholar]
- Kripfgans OD, Fowlkes JB, Woydt M, Eldevik OP, Carson PL. In vivo droplet vaporization for occlusion therapy and phase aberration correction. IEEE Transactions on Ultrasonics, Ferroelectrics, and Frequency Control. 2002;49(2):726–738. doi: 10.1109/tuffc.2002.1009331. [DOI] [PubMed] [Google Scholar]
- Kripfgans OD, Orifici CM, Carson PL, Ives KA, Eldevik OP, Fowlkes JB. Acoustic droplet vaporization for temporal and spatial control of tissue occlusion: A kidney study. IEEE Transactions on Ultrasonics, Ferroelectrics, and Frequency Control. 2005;52(7):1101–1110. doi: 10.1109/tuffc.2005.1503996. [DOI] [PubMed] [Google Scholar]
- Lang SB. Ultrasonic method for measuring elastic coeffcients of bone and results on fresh and dried bovine bones. IEEE Transactions on Biomedical Engineering BME-17. 1970:101–105. doi: 10.1109/tbme.1970.4502706. [DOI] [PubMed] [Google Scholar]
- Lees S, Cleary PF, Heeley JD, Gariepy EL. Distribution of sonic plieso-velocity in a compact bone sample. Journal of the Acoustical Society of America. 1979;66(3):641–646. [Google Scholar]
- Lo AH, Kripfgans OD, Carson PL, Rothman ED, Fowlkes JB. Acoustic droplet vaporization: Effects of pulse duration and contrast agent. IEEE Transactions on Ultrasonics, Ferroelectrics, and Frequency Control. 2007;54(5):933–946. doi: 10.1109/tuffc.2007.339. [DOI] [PubMed] [Google Scholar]
- Parvulescu A, Clay CS. Reproducibility of signal transmissions in the ocean. The Radio and Electronic Engineer. 1965;29:223–228. [Google Scholar]
- Pernot M, Aubry JF, Thomas JL, Fink M. High power transcranial beam steering for ultrasonic brain therapy. Physics in Medicine and Biology. 2003;48:2577–2589. doi: 10.1109/TMI.2010.2076829. [DOI] [PMC free article] [PubMed] [Google Scholar]
- Pernot M, Montaldo G, Tanter M, Fink M. “Ultrasonic stars” for time-reversal focusing using induced cavitation bubbles. Applied Physics Letters. 2006;88(034102):1–3. [Google Scholar]
- Prada C, Manneville S, Spoliansky D, Fink M. Decomposition of the time reversal operator: Detection and selective focusing on two scatterers. Journal of the Acoustical Society of America. 1996;99(4):2067–2076. [Google Scholar]
- Psychoudakis D, Fowlkes JB, Volakis JL, Carson PL. Potential of microbubbles for use as point targets in phase aberration correction. IEEE Transactions on Ultrasonics, Ferroelectrics, and Frequency Control. 2004;51(12):1639–1648. doi: 10.1109/tuffc.2004.1386681. [DOI] [PubMed] [Google Scholar]
- Sun J, Hynynen K. Focusing of therapeutic ultrasound through a human skull: A numerical study. Journal of the Acoustical Society of America. 1998;104:1705–1715. doi: 10.1121/1.424383. [DOI] [PubMed] [Google Scholar]
- Sun J, Hynynen K. The potential of transskull ultrasound therapy and surgery using the maximum available surface area. Journal of the Acoustical Society of America. 1999;105:2519–2527. doi: 10.1121/1.426863. [DOI] [PubMed] [Google Scholar]
- Theismann H, Pfander F. Über die durchlässigkeit des knochens für ultraschall. Strahlentherapie. 1949;80:607–610. [PubMed] [Google Scholar]
- Vignon F, Aubry JF, Tanter M, Fink M. Adaptive focusing for transcranial ultrasound imaging using dual arrays. Journal of the Acoustical Society of America. 2006;120(5):2737–2745. doi: 10.1121/1.2354073. [DOI] [PubMed] [Google Scholar]
- White J, Clement GT, Hynynen K. Transcranial ultrasound focus reconstruction with phase and amplitude correction. IEEE Transactions on Ultrasonics, Ferroelectrics, and Frequency Control. 2005;52(9):1518–1522. doi: 10.1109/tuffc.2005.1516024. [DOI] [PubMed] [Google Scholar]
- White PJ, Hynynen K, Clement GT. Longitudinal and shear mode ultrasound propagation in human skull bone. Therapeutic Ultrasound: 5th International Symposium on Therapeutic Ultrasound. Vol. 5. International Symposium on Therapeutic Ultrasound; American Institute of Physics. 2006. pp. 251–255. [DOI] [PMC free article] [PubMed] [Google Scholar]
- Yin X, Hynynen K. A numerical study of transcranial focused ultrasound beam propagation at low frequency. Physics in Medicine and Biology. 2005;50(8):1821–1836. doi: 10.1088/0031-9155/50/8/013. [DOI] [PubMed] [Google Scholar]
- Zhao D, Trahey GE. Comparisons of image quality factors for phase aberration correction with diffuse and point targets: Theory and experiments. IEEE Transactions on Ultrasonics, Ferroelectrics, and Frequency Control. 1991;38(2):125–132. doi: 10.1109/58.68469. [DOI] [PubMed] [Google Scholar]


