Abstract
The purpose of this work is to study computationally the possibility of the application of a hybrid active noise control technique for MRI acoustic noise reduction.
A hybrid control system combined with both feedforward and feedback loops embedded is proposed for potential application on active MRI noise reduction. A set of computational simulation studies were performed. Sets of MRI acoustic noise emissions measured at the patient's left ear location were recorded and used in the simulation study.
By comparing three different control systems, namely the feedback, the feedforward and the hybrid control, our results revealed that the hybrid control system is the most effective. The hybrid control system achieved approximately a 20 dB reduction at the principal frequency component.
We concluded that the proposed hybrid active control scheme could have a potential application for MRI scanner noise reduction.
Keywords: MRI, acoustic noise, active noise control
INTRODUCTION
Magnetic resonance imaging (MRI) is an important medical imaging modality for the diagnosis of diseases and for biomedical research. However, MRI acoustic noise emission remains a major concern, because it interferes with speech communication between patients and caregivers and it could possibly also be hazardous to their hearing. Safety issues related to the use of MRI, such as the physiological effects of acoustic noise, radio frequency (RF) and magnetic field, were first investigated in 1987 [1]. More recent studies found that exposure to loud MRI sounds could cause psychological consequences including temporary threshold shifts, anxiety, stress, annoyance, mental fatigue and fear, as well as permanent hearing loss [2-6]. Hence, the present recommendation is that all patients and some healthcare workers (for those who are required to stay in or near the scanner chamber) wear ear protection during MRI scanning [7-8]. Noise reduction is important for future MRI functioning because the US Food and Drug Administration (FDA) has adopted the Occupational Safety and Health Administration (OSHA) guideline, which limits the daily noise dosage of a person to the equivalent of 90 dBA (A-weighted decibels) for 8 hours in any given MRI application [9-10]. Additionally, the National Electrical Manufacturers Association (NEMA) has prescribed a mandatory test procedure for measuring the sound pressure levels (SPLs) under the worst-case scenario [11]. Moreover, in recent advanced fMRI research, the acoustic noise level produced during imaging acquisition has become a serious impediment to studies involving auditory pathways and speech [12].
Conventionally, various approaches have been used to reduce MRI noise. These approaches include modifying gradient coil design, minimizing the vibration resonances of the coil assembly, applying sound absorbing materials, designing silent MRI pulse sequences and passive ear-protection. However, these methods demonstrate limited effectiveness. The most challenging aspect is to effectively reduce MRI acoustic noise while preserving other critical factors including gradient strength, slew rate, and linearity [13]. Theoretically, the passive noise control approach is mainly effective for noise at high frequency ranges. For low frequency noises, the passive materials and structures are bulky as well as uncomfortable, making them impractical for MRI application. In general, frequencies above 1 kHz are adequately attenuated by 30 dB using conventional ear protection devices, but lower frequencies around 250 Hz are attenuated by about 10 dB which may not be enough for MRI noise reduction [14]. Except for methods involving the modification of gradient pulse sequences, all other approaches require the MRI scanner to be redesigned, which poses other major challenges. Although the technique of altering the gradient pulse sequence is relatively easy to implement it does have limitations (e.g. reducing the sequence performance) while in practice. Therefore, the majority of existing MRI scanners requires an alternative solution for reducing acoustic noise.
Active noise control (ANC) may offer an alternative solution for reducing MRI acoustic noise. ANC is a well established technique in industry for acoustic noise reduction. The fundamental theory of ANC is based on the introduction of an externally applied control input to suppress the emitted signal. For instance, an anti-phase acoustic wave can be introduced to create a zone of destructive interference at the area of interest in space. This method has already been applied to numerous problems where acoustic noise was severe and traditional passive approaches were not suitable or efficient. However, only a few studies using active control for MRI noise reduction have been reported in the literature [14-20]. To apply the ANC technique on MRI acoustic noise suppression, two things need to be addressed. First, one will need to identify an appropriate actuation approach. Because of the unique magnetic environment, an MRI compatible speaker is required to deliver the control acoustic wave to the desired space. Second, we will need to develop an optimal controller for effectively reducing the SPL. Goldman et al. [15] implemented an active MRI acoustic noise control system by injecting a synthesized anti-phase signal, which is generated by inverting the phase of the major frequencies components of the recorded MRI signal. This synthesized signal was synchronized with the scanner sound with a trigger generated by the scanner computer to align with the pulse sequence. They reported a successful 14 dB reduction. However, this method is not practical due to its lack of flexibility in tracking the change of system and the MRI response signals. Furthermore, their approach, using a tube to deliver the anti-phase sound to the patient, introduced additional time delay of the system and consequently degraded the performance. As recently as 1995, Pla et al. [16] described a system that did not use a headset, but instead used a pair of piezoelectric speakers placed close to the subject's ears. An adaptive controller with a multi-channel filtered-x least mean squares (FXLMS) algorithm was used. Up to 25 dB of noise reduction at frequencies up to 1.2 kHz was reported in their application. However, this study notes that the MRI acoustic noises treated were mainly in the first few harmonics. In 1997, McJury et al. [17] described a noise reduction headset which used a feedforward controller adapted by the filtered-U LMS (FULMS) algorithm. The system was tested in the laboratory using pre-recorded MRI scanner noise presented through a loudspeaker. In this study, a 10−15dB reduction in the frequencies below 350Hz was obtained. However, similar to Pal's study, only fundamental harmonic signals were treated. Chen et al. [18] proposed a feedback controller system with a cascaded neural-network architecture to achieve the reduction of MRI acoustic noise. This system was tested using a loudspeaker that presented pre-recorded scanner noises. Using this approach, they achieved an average sound power reduction of approximately 19dB. Chambers et al. [14] implemented and evaluated an ANC prototype system for MRI noise reduction. In the most intense component of the scanner noises an objective reduction of 30−40dB was obtained for the frequency between 500Hz and 3500Hz. Mechefske and Geris [19] investigated two feedforward ANC systems: a headset-based system and a tube-based system. The former was equipped with non-magnetic components (speakers, microphones, and preamps) inside an ear defender, while the latter used a tube to transmit noise cancellation signals to the ear defender. Both were adapted by the FXLMS algorithm. Their results revealed that the headset-based system provided a satisfactory overall noise attenuation when using EPI sequences, however, it proved less effective when tested inside the MRI scanner versus in a laboratory set-up. In addition, the tube-based system was less effective than the headset-based system due to the time delay created by the length of tube used. More recently, Kahana et al. [20] implemented a feedforward ANC system in an MRI communication system by utilizing an optoacoustical (i.e. a piezoelectric speaker driven by optical signals) ear defender. Their results showed a 35−50 dB attenuation at the fundamental frequency component. This value was in addition to 15dB of passive attenuation resulted from the slim ear defender headset used. However, one should also note that in their case the fundamental frequency is more than 40dB higher than the adjacent broadband response.
In this work, the sound-proof laboratory performance of different active acoustic control algorithms will be tested and compared. We are particularly interested in a hybrid controller, in which both feedforward and feedback loops are embedded, since it has yet to be applied in MRI acoustic noise treatment according to the best of our knowledge. The best algorithm, as determined by this study, will be implemented for our future study in designing an active headset-based acoustic noise reduction system for a Varian 4T scanner.
MATERIALS AND METHODS
MRI noise measurement
A 4-Tesla Varian Unity INOVA whole-body MRI scanner (Palo Alto, CA) operated with an echo planar imaging (EPI) sequence was the control system for this study. The acoustic noise measurement targeted the scanner bore isocenter where the patient's ears and mouth were located. A humanoid dummy (model TP-1500; Dummies Unlimited, Pomona, CA, USA) was used to simulate typical imaging conditions and to also locate the ear and mouth microphones (omni-directional, nonferrous B&K 4189 type). In addition, other identical microphones were used in a roving manner to capture the sound pressure distributions along the axial and radial directions inside the bore space. The detailed description of the study set up can be found elsewhere [21].
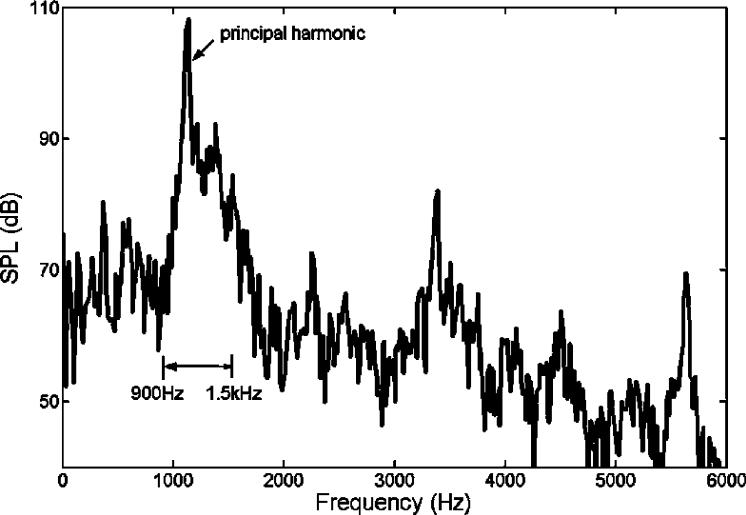
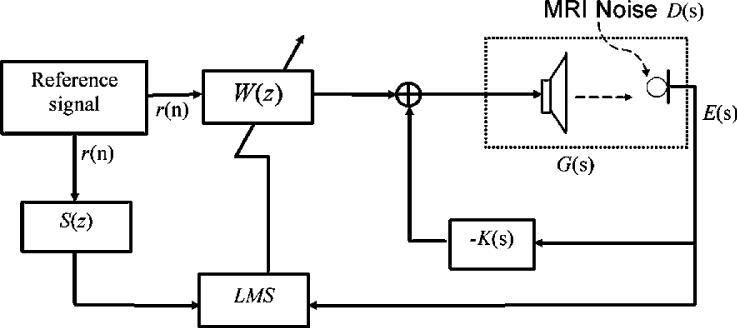
Figure 1 shows the spectrum of MRI acoustic noise signal at the left ear for a typical EPI pulse sequence. From the measured results, it can be seen that the acoustic noise energy is mainly concentrated at the principal harmonic of approximately 1 kHz. In addition, the sideband response is also significant. The bandwidth of the sideband is typically from 900Hz to 1.5 kHz. For a typical ANC application, the effective frequency is generally in the range of hundreds of Hz to ensure that the ANC system can operate well within a given volume space. Utilizing a headset, the upper limit effective frequency may extend up to 1.5 kHz, because the effective operating volume is within 1/8 of the wavelength's upper frequency limit. Furthermore, higher order harmonics can be reduced through a headset with passive means. Hence, for this particular application, the feedforward component of the controller shown in Figure 2 was used to treat the principal harmonic, and the feedback component was used to undertake the sideband noise. Detailed description of the proposed controller (Figure 2) is given below.
Figure 1.
The spectrum of measured MRI acoustic signal from a 4T scanner at the patients' left ear location. The main components of the response include the broadband within 0.9 to 1.5 kHz and the principal harmonic at 1.14 kHz.
Figure 2.
This diagram is the proposed hybrid control structure. K(s) is the feedback controller. Feedforward controller, W(z), is adapted by the FXLMS algorithm. G(s) represents the secondary path transfer function of the speak-microphone system. LMS represents a least mean square control algorithm. E(s) and D(s) represent the ANC treated and un-treated MRI acoustic noise, respectively, at targeted location (i.e. patient's ear location in this case). S(z) represents the estimated model of secondary path transfer function. R(n)is the reference signal.
Actuator System Modeling
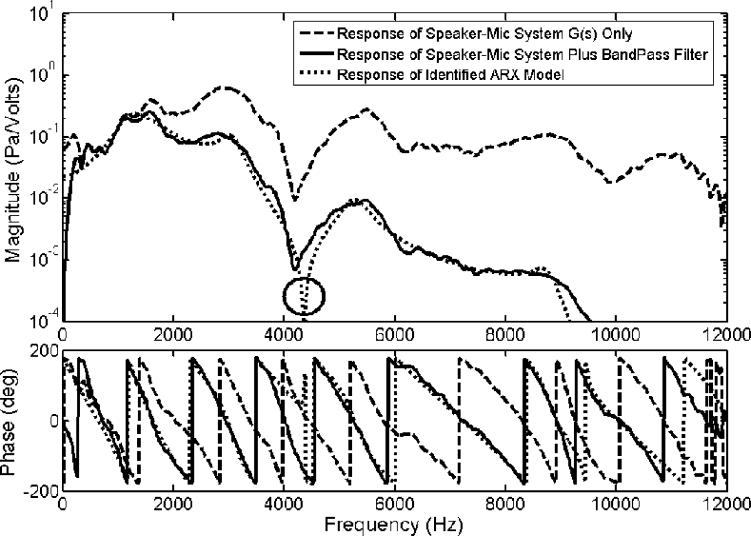
For an ANC in MRI systems, the speakers used should be compatible with a magnetic environment. In this application, the speaker we selected for all tests was purchased from Resonance Technology Inc, CA. The dynamics (frequency response) of the plant system (i.e. the speaker-microphone system) was measured and is shown as a dash line in Figure 3. Because our targeted primary noise is within the 0.9 to 1.5 kHz frequency range (shown in Fig. 1), a band-pass filter with cutoff frequencies at 300Hz and 1.5 kHz were added to the microphone unit of the active control system. The response of the new plant system, G(s) in Figure 2, incorporating the speaker-microphone system with the band-pass filter is shown as a solid line in Figure 3. Furthermore, to simplify the control filter design process, an ARX (AutoRegressive with eXternal input) model representing the plant system was identified and used for analysis. The ARX model can be described by the equation A(q)y(t) = B(q)u(t)+e(t), where e(t) represents noise, q is called forward shift operator as noted by the relation qu(t) = u(t+1), and t is time [22]. Here, AR refers to autoregressive part A(q)y(t), where y(t) is the output signal; while X refers to the input part B(q)u(t), where u(t) is the input signal [22]. The ARX model was implemented using a system identification toolbox from Matlab (The MathWorks, Inc). The frequency response of the ARX model is also illustrated as a dotted line in Figure 3. From the plot, it clearly reveals a close match between the ARX model and the plant system incorporating the speaker-microphone system with the band-pass filter in magnitude and phase. This result ensures that the designed control filter using the ARX model can be suitable for the speaker-microphone system actually used in this application.
Figure 3.
Frequency response functions of the proposed speaker-microphone system G(s) ( ), the speaker-microphone system plus a bandpass filter (
 ) and the identified ARX model that represents the speaker-microphone system with the filter (
 ). The solid circle pinpoints the position of a prominent dip in the dynamic characteristic of the system model.
Controller Design
To design a control system for noise cancellation, two typical structures exist in the literature: feedforward and feedback control schemes. Each of them has its own virtues. For this MRI noise cancellation application, we proposed a hybrid structure, i.e. a feedback control that has a feedback controller K(s) embedded with a feedforward control loop in which an adaptive FIR filter W(z) is used, as illustrated in Figure 2.
(a) Feedforward control
The feedforward loop is an adaptive controller which uses the filtered-x least mean square (FXLMS) algorithm to adjust the filter weights. The FXLMS control algorithm, an extended version of the LMS algorithm typically used for dynamic systems with phase delay secondary paths, is well studied and has been widely applied to many active vibration and noise control applications [14, 16, 19-20, 23-24]. This controller requires detailed information about the secondary path transfer function. For the MRI system being studied here, the secondary path transfer function describes the part of the system from the output of the adaptive controller to the measured acoustic signal near patients' ear positions. The controller also requires a clean reference signal that is coherent with the primary disturbance. The first issue, concerning the need for a secondary path transfer function, can be handled by applying a system identification method that was discussed in detail in the work of Kuo and Morgan [23].
The coherence between the reference signal and the principal harmonic of MRI acoustic noise greatly affects the performance of achievable noise attenuation. To ensure an adequate coherence level between the reference and disturbance signals, the exact principal frequency of MRI noise must be obtained in advance. A frequency estimator [24] uses the acquired signal to estimate in real time the instantaneous principal frequency. Using this frequency estimation technique, the reference signal, r(n), at the target principal frequency can be accurately synthesized.
In the control schematic diagram shown in Figure 2, the secondary path transfer function is given by G(s), which relates the controller output to the receiving point located around patients' ear positions. The sound signal at patients' ear area, E(s), was used as the error signal in the FXLMS algorithm to adjust the adaptive controller W(z). The estimated model of the secondary path transfer function, S(z), is implemented by injecting a small amount of white noise through the loudspeaker.
(b) Feedback control
The feedforward control loop was designed to manage the principal harmonic component. The feedback controller, K(s), was designed using a Matlab control toolbox command, loopsyn. The command loopsyn computes a stabilizing H∞ controller also known as K(s). This is simply an optimization method that minimizes the H∞ norm of the system. The H∞ norm of a dynamic system is the maximum value of its frequency response magnitude in the SISO (single-input single-output) case. The purpose of the computation is to define the open loop transfer function, G(s)·K(s), for a desired loop shape form. More detailed information can be found in the help file of Matlab. To understand the performance of feedback control, the open loop transfer function, G(s)·K(s), needs to be analyzed. The resultant acoustic signal E(s) at the ear positions can be expressed by Equation 1.
| (1) |
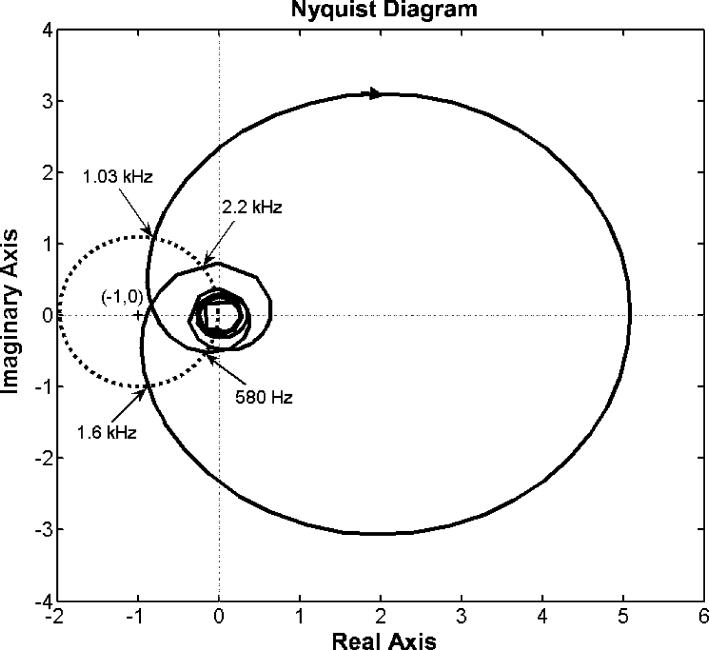
where D(s) is the disturbance signal (i.e. MRI noise) that will need to be suppressed in the application. From Equation 1, it shows that if the absolute value of the denominator is larger than 1 the acoustic signal is reduced, i.e. the amplitude of E(s) is less than that of D(s). Herein, the denominator represents the distance between the point represented by the complex number G(s)·K(s) at any given single frequency and the point (−1, 0) in complex plane. Furthermore, the larger the absolute value of the denominator, the greater the reduction achieved. The denominator term is approximately the magnitude of the open loop transfer function G(s)·K(s) measured to the original point (0, 0) in the Nyquist plot (Figure 6) in most cases. Note that it is impractical to raise the open loop response too high, because the system may become unstable.
Figure 6.
Nyquist diagram for the open loop response of the hybrid ANC control system. The solid curve represents the response of the control system where each point on the curve represents the system open loop response at a given frequency. An arrow on the curve implies the direction of increasing frequency. The dotted circle is centered at (−1, 0) with unit radius. Four frequency points labeled in the plot are intersects between the solid curve and the dotted circle.
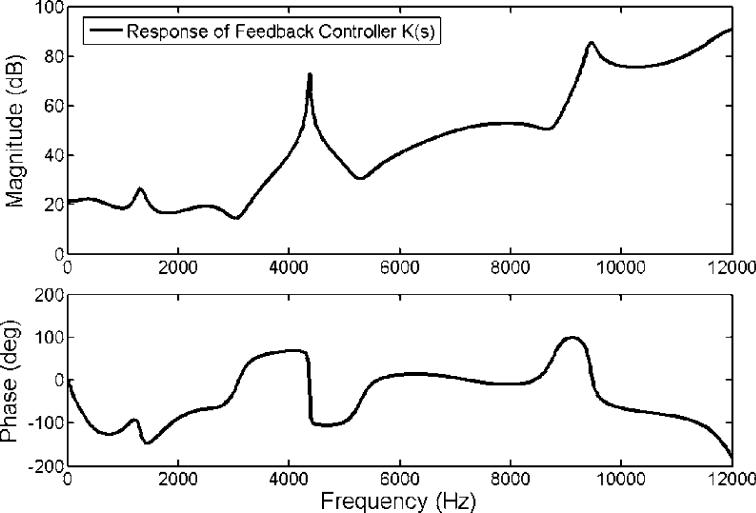
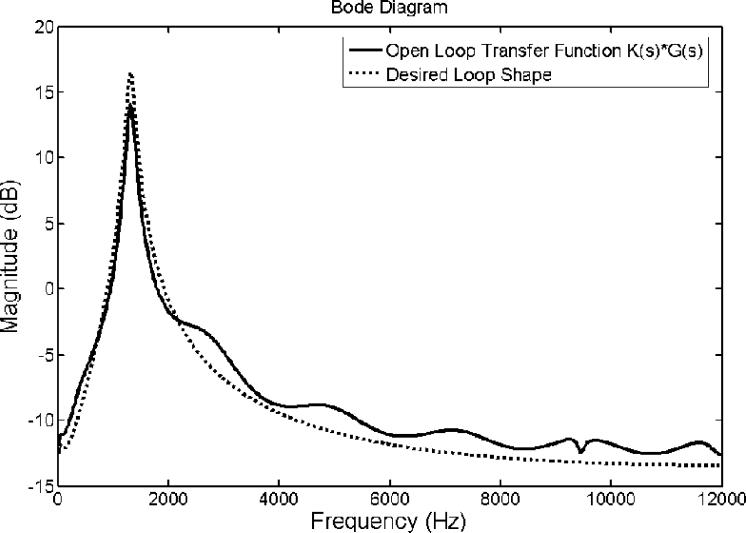
The frequency response of the designed feedback controller is shown in Figure 4. It clearly shows that the control filter possesses a primary narrowband peak at around 4 kHz. This peak's existence is due to the chosen speaker-microphone dynamic system represented as an ARX model, which has a prominent dip at the same frequency as indicated and encircled in Figure 3. Nevertheless, the desired loop transfer function does not depict such a prominent feature as indicated with a dotted line in Figure 5. This is because, in order to achieve the desired loop shape, the loopsyn command produced the controller shown in Figure 4. This loop shape possesses a peak at 4 kHz to compensate for the dip in the inherent dynamic characteristic of the speaker-microphone system. The magnitude parts of the Bode diagrams of the designed open loop control system (solid line) and the desired loop shape (dotted line) are shown in Figure 5. Figure 5 demonstrates that the open loop response of the control system, including the plant dynamics and the controller response designed by the Matlab command, loopsyn, agrees well with the desired loop shape. In addition, the Bode plot (Figure 5) reveals that this control system is expected to reduce the sound response signal in the range from 0.9 to 1.5 kHz with a maximum reduction located at around 1.3 kHz. Its corresponding Nyquist diagram is also shown in Figure 6. Note that the Nyquist diagram plots the real part versus the imaginary part of the open loop transfer function, G(s)·K(s). Each point in the Nyquist diagram represents the open loop transfer function at the specific frequency point. The arrow direction denotes increasing frequency. The Nyquist plot can be used to predict the stability and the performance of a closed loop system by observing its open loop behavior. The Nyquist criterion can also be used to determine the closed loop stability by examining if the curve encloses the critical point (−1, 0) when the Bode plot displays inconclusive information [25]. From the Nyquist diagram in Figure 6, one can see that the control system is stable because the critical point (−1, 0) labeled by a cross symbol is not encircled by the Nyquist path (the solid line). The region inside the unit circle (dotted line) centered at (−1, 0) shows the frequencies at which the resultant MRI response signals are increased. This is because the distance between the point represented by G(s)·K(s) and (−1, 0), which is the absolute value of the denominator of Equation 1, is less than unity. This results in the increase of resultant error signal, E(s,) as shown in Equation 1.
Figure 4.
The plotted frequency response of the designed feedback controller K(s) as a function of magnitude and phase.
Figure 5.
Bode diagram for the open loop response of the hybrid ANC control system. The solid and dotted lines are the open loop response of system and the desired loop shape, respectively.
RESULTS
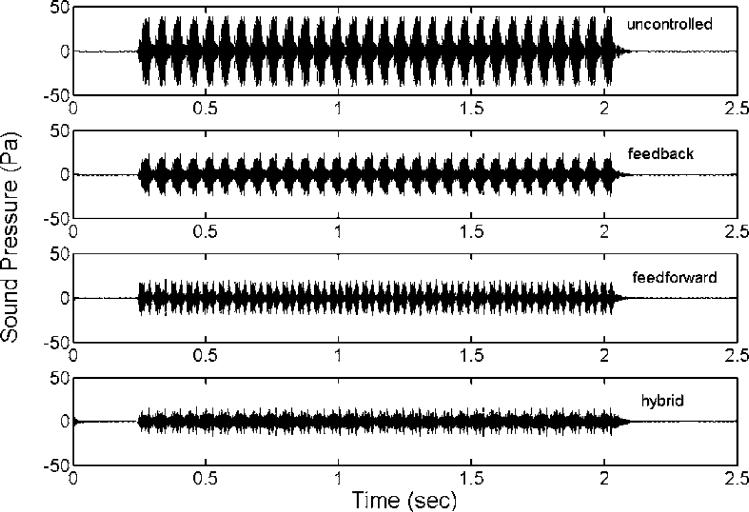
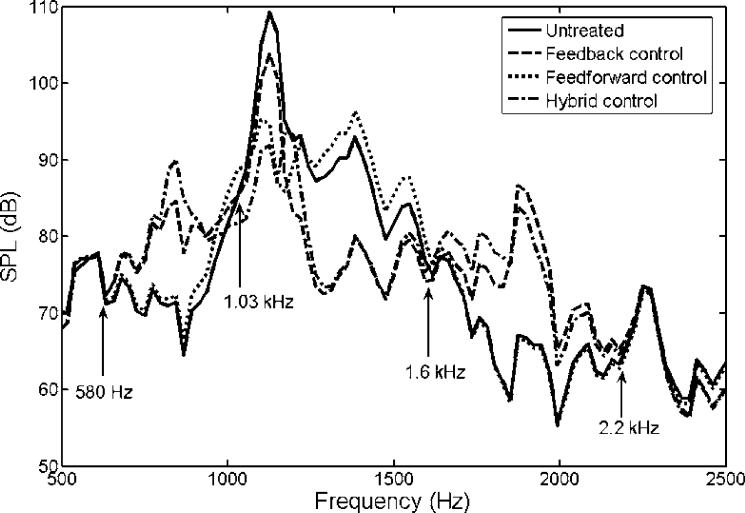
To test the proposed control system's performance, a series of simulation studies were performed. First, three different control systems were compared for their performances: feedback control only, feedforward control only, and hybrid control that combines the previous two systems. Figure 7 shows the recordings of untreated and treated MRI acoustic signals after applying a feedback control only, a feedforward control only, and a hybrid control. It demonstrates that all controls reduce the amplitude of MRI noise signals and that the hybrid control provides the most significant noise reduction. The performances of all controls were listed in the Table 1. These values were calculated from the recorded sound signatures between 1 and 2 seconds. Figure 8 shows the SPLs for a pre-recorded MRI noise with and without control treatments. It is not surprising that the feedforward control manages primarily the principal frequency according to the design, and that it yielded a reduction of 19 dB with the principal frequency at approximately 1.14 kHz. The overall reduction for the entire audible frequency range was about 7.6 dB for the feedforward control. The feedback controller was more effective for the broadband component between 0.9 and 1.6 kHz. A maximum reduction of about 15 dB was achieved within the frequency range between 1.2 and 1.4 kHz. However, the overall reduction was about 5.2 dB, which was due to its lower effectiveness in the controlled frequency range compared to the feedfoward control at the principal frequency where most of the signal energy was concentrated. We also note that the hybrid control structure performs superior to the feedback and feedforward control alone. The hybrid control can handle both the principal (at about 1.14 kHz) and broadband components, and it achieved a 20 dB reduction at the principal frequency and an overall reduction of 11 dB for the whole audible frequency range. Furthermore, the frequencies at which the maximum reduction occurred are different between the feedback control structure and the other two structures as shown in Table 1. This implies that better results can be obtained from the hybrid control if the maximum reduction frequency of the feedback control coincides with the primary harmonic. Hence, one can conclude that the hybrid control structure that includes both the feedback and the feedforward control structures performs better than the feedback or the feedforward control alone. However, when applying the hybrid control, we note that there is an increased SPL from the original sound signal near the frequency ranges from 600 Hz to 900 Hz and from 1.6 kHz to 2.2 kHz. This is known as the waterbed effect [26]. This phenomenon can be explained by the Nyquist plot in Figure 6. As described above, the distances between the points located inside the unit circle and the location (−1, 0) are all less than unity. From Equation 1, the resulting signals at these points (i.e. frequencies) are amplified because the absolute value of the denominator in Equation 1 is less than one for those frequencies. We have labeled the four critical points (the intersections of the solid and dotted lines) as 580 Hz, 1.03 kHz, 1.6 kHz and 2.2 kHz in Figure 6. Examining the solid line and these four points, one can find that the points of 580 Hz and 1.03 kHz are the beginning and ending points of one segment (an arrow shows the direction from the beginning to the ending point), and points of 1.6 kHz and 2.2 kHz are the beginning and ending points of the other segment. From Figure 6, the points on these two segments are all located inside the unit circle shown as a dotted line. Hence, at these frequencies, noise increases are expected to occur. These exactly correspond to the segmented frequency ranges (from 580 Hz to 1.03 kHz and from 1.6 kHz to 2.2 kHz) as indicated in Figure 8. Also, from the Nyquist plot as shown in Figure 6, one can see the point (frequency) of the Nyquist path (the solid line) with the shortest distance from location (−1, 0) is roughly at 1.9 kHz. At this frequency, the real and the imaginary part of the open loop transfer function of control system is −0.905 and −0.0678, respectively. Hence, the distance to (−1, 0) is about 0.117. Based on this distance, the estimated attenuation is −18.6 dB. However, the negative sign of the attenuation represents an increase in SPL rather than a decrease. The results in Figure 8 also confirm this finding, which shows that the maximum of the increased SPL is around 19.5 dB at 1875 Hz.
Figure 7.
Measured sound signatures of (a) untreated MRI noises, (b) treated MRI noises with the feedback control only, (c) treated MRI noises with the feedforward control only, and (d) treated MRI noises with the hybrid control.
Table 1.
List of typical values of simulation results
| Overall SPL | Overall Reduction | Maximum Reduction | Max. Reduction Frequency | |
|---|---|---|---|---|
| Uncontrolled | 117.8 dB | |||
| Feedback | 112.6 dB | 5.2 dB | 15.7 dB | 1312 Hz |
| Feedforward | 110.2 dB | 7.6 dB | 19.3 dB | 1148 Hz |
| Hybrid | 106.9 dB | 10.9 dB | 19.6 dB | 1148 Hz |
Figure 8.
Spectrum of untreated MRI noise ( ), treated acoustic signal after applying feedback control only (
 ), treated acoustic signal after applying feedforward control only (
 ) and treated acoustic signal after applying hybrid control (
 ). Note that the response in the two frequency ranges, 580 Hz ∼ 1.03 kHz and 1.6 kHz ∼ 2.2 kHz, are increased slightly after applying control.
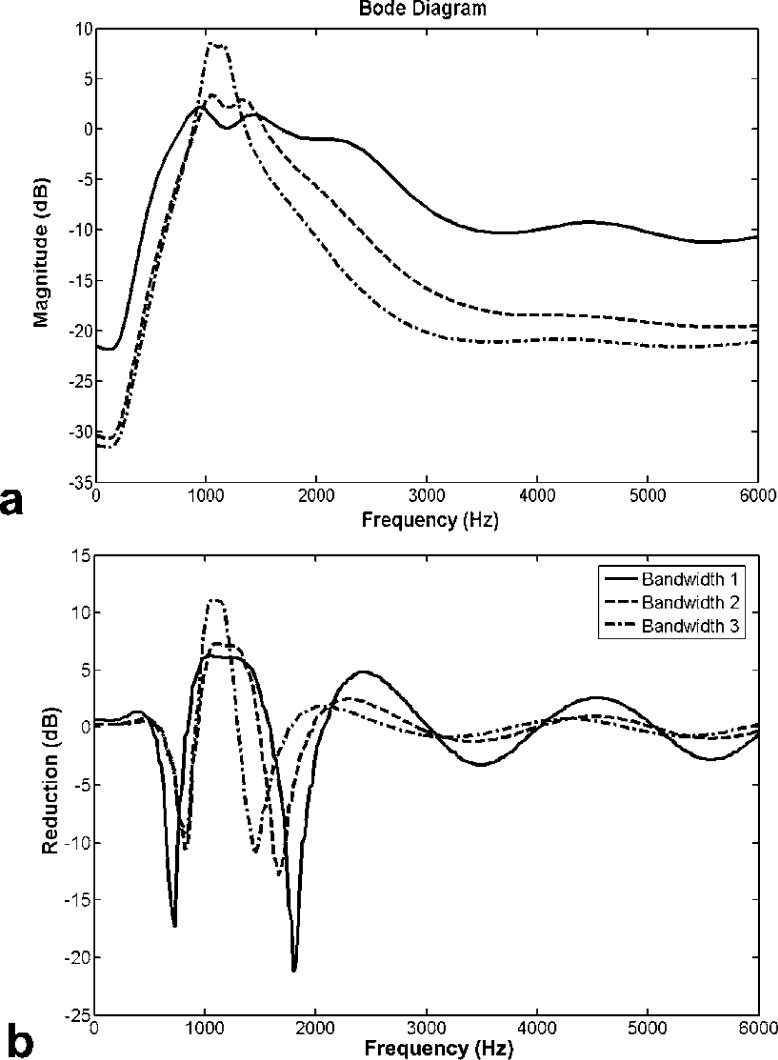
To design the feedback controller, one should consider the balance between the desired attenuation and the filter bandwidth of the transfer function. To demonstrate this point, controllers with three different filter bandwidths are considered. Note that these controllers are not optimized here. The examples listed here are used to demonstrate the general relations between attenuation and bandwidth, and to provide a guideline of controller design. The filters used were Butterworth with three different bandwidths: 0.9 kHz ∼ 1.5 kHz, 1 kHz ∼ 1.4 kHz and 1 kHz ∼ 1.2 kHz. Figure 9a shows the open loop frequency response of the designed control system. Figure 9b shows attenuations of three feedback controllers designed from the above three different bandwidth filters, where a negative value means an increased SPL and a positive term implies a reduced SPL in the sound measures. The frequency responses for the filters with a bandwidth between 0.9 kHz ∼ 1.5 kHz, 1kHz ∼ 1.4 kHz, and 1 kHz ∼ 1.2 kHz are represented by a solid, dash, dash-dotted line, respectively, in Figure 9. Figure 9b shows that the third case (1 kHz ∼ 1.2 kHz) yielded a reduction of more than 10 dB within its frequency band. However, the first case (0.9 kHz ∼ 1.5 kHz) achieved only about 5 dB in attenuation within its frequency band while resulting in more than 20 dB increase at certain frequencies outside of the band. To alleviate the waterbed effect, one can simply insert a pure gain unit that is less than 1 in the loop. This means that the new transfer function is the original one multiplied by a less than unity constant value. The use of a smaller gain can lessen the undesirable increase in the resulting SPL. However, the achievable noise reduction level is also reduced. Since the waterbed effect cannot be avoided, its effect must be minimized by tuning the controller such that the out-of-band overshoots are placed inside frequency ranges with a lower baseline response. This is conducted so that the degradation in the net response is less obvious. From these results, we conclude that filters with a narrow bandwidth yield a high reduction gain within the frequency bandwidth and a small effect for frequencies outside of the bandwidth. Thus, to design a suitable feedback controller, the characteristics of the target frequency response should be considered in order to select a suitable bandwidth for designing the best controller.
Figure 9.
(a) Open loop transfer functions, and (b) Reductions of three different desired loop shaping functions with bandwidth 1 ( : 900 Hz ∼ 1.5 kHz), bandwidth 2 (
 : 1 kHz ∼ 1.4 kHz) and bandwidth 3 (
 : 1 kHz ∼ 1.2 kHz).
DISCUSSIONS
Effort towards applying ANC technology on MRI acoustic noise has been incubated for many years; however, high noise intensity, a rather broad bandwidth and the lack of good response non-magnetic speakers have presented challenges to a successful application. In this research, the simulation study conducted was based on a non-magnetic speaker and recorded MRI acoustic signals from a 4T scanner. The results are expected to guide future studies targeted at actual implementation of the proposed technology. Although the hybrid structure was used in some ANC applications [27], to the best of our knowledge, it has not been applied to MRI acoustic noise cancellation.
We analyzed not only the principal harmonic for feedforward but also a full estimate of the whole signal. However, due to the significance of the principal harmonic and the inherent delay of a secondary path (i.e. signals flow from speaker to microphone), the results of the feedforward controller using the full estimation of the whole signal were no better than those using simply the single principal harmonic. Thus, we only presented the feedforward controller that deals with the principal harmonic. It should be noted that human hearing varies considerably in sensitivity across the frequency range. However, only linear SPL is targeted here because, for this case, our frequency range of interest is that in which human hearing is most sensitive, from 900Hz to 1.5 kHz. Higher frequencies such as 2kHz and 4kHz were not treated because the corresponding short wavelength limits the applicability of the ANC system. Furthermore, responses at higher frequencies can be effectively reduced by passive means. Finally, bone conduction is not expected to pose a serious problem for this case because it is relatively insignificant especially when compared to air-borne noise transmission [28].
By studying the three different control systems: namely feedback, feedforward and hybrid control, it has been demonstrated that the hybrid control system possesses the most desirable performance. The hybrid control achieved a reduction of around 20 dB at the principal frequency (1.14 kHz) and also more than 10 dB in the frequency range between 0.9 kHz and 1.6 kHz. Even though some increases in response at the out-of-band frequencies were observed, the achievable overall noise reduction was still 10 dB better than the performances of the other two controllers when considering the entire audible frequency range of interest. Furthermore, studies of how the bandwidth of the designed controller affect the performance revealed that a controller with a small bandwidth filter would typically achieve more reductions in the target noise range and be less influential in the out-of-band components. In order to optimize the performance of a controller for acoustic noise reduction, it is necessary to understand the original MRI noise characteristics in depth. These include the frequency range and bandwidth of the acoustic noise spectrum, and at which frequencies requiring the primary treatment. With this information, one would be able to design a desired loop shape function and consequently an optimized controller. Noise control in the MRI environment is highly complex, and the proposed hybrid system that combines the feedforward and feedback controls performs reasonably well when applied to treat the main frequency components of the MRI acoustic noise signal including both harmonic and broadband components. However, we anticipate that the implementation of such system in a scanner could be complicated. Further studies are required to further reduce the MRI acoustic noise by integrating more sophisticated techniques with the hybrid control system, as well as to test with other scanners and imaging sequences.
ACKNOWLEDGEMENTS
We thank the National Institutes of Health (R21 EB005042) for support of this work and the College of Medicine of the University of Cincinnati (Deans Discovery Fund) for support of the initial work.
Footnotes
Publisher's Disclaimer: This is a PDF file of an unedited manuscript that has been accepted for publication. As a service to our customers we are providing this early version of the manuscript. The manuscript will undergo copyediting, typesetting, and review of the resulting proof before it is published in its final citable form. Please note that during the production process errors may be discovered which could affect the content, and all legal disclaimers that apply to the journal pertain.
REFERENCES
- 1.Gangarosa RE, Minnis JE, Nobbe J, Praschan D, Genberg RW. Operational safety issues in MRI. Magnetic Resonance Imaging. 1987;5:287–92. doi: 10.1016/0730-725x(87)90006-3. [DOI] [PubMed] [Google Scholar]
- 2.Quirk ME, Letendre A, Ciottone RA, Lingley JF. Anxiety in patients undergoing imaging. Radiology. 1989;170:463–466. doi: 10.1148/radiology.170.2.2911670. [DOI] [PubMed] [Google Scholar]
- 3.McJury M, Shellock F. Auditory noise associated with MR procedures: A review. Journal of Magnetic Resonance Imaging. 2000;12:37–45. doi: 10.1002/1522-2586(200007)12:1<37::aid-jmri5>3.0.co;2-i. [DOI] [PubMed] [Google Scholar]
- 4.Foster JR, Hall DA, Summerfield AQ, Palmer AR, Bowtell RW. Sound-level measurements and calculations of safe noise dosage during EPI at 3 T. Journal of Magnetic Resonance Imaging. 2000;12:157–163. doi: 10.1002/1522-2586(200007)12:1<157::aid-jmri17>3.0.co;2-m. [DOI] [PubMed] [Google Scholar]
- 5.Brummett RE, Talbot JM, Charubas P. Potential hearing loss resulting from MR imaging. Radiology. 1988;169:539–540. doi: 10.1148/radiology.169.2.3175004. [DOI] [PubMed] [Google Scholar]
- 6.Counter SA, Bjelke B, Klason T, Chen Z, Borg E. Magnetic resonance imaging of the cochlea, spiral ganglia and eighth nerve of the guinea pig. Neuroreport. 1999;10:473–479. doi: 10.1097/00001756-199902250-00006. [DOI] [PubMed] [Google Scholar]
- 7.Ravicz ME, Melcher JR. Isolating the auditory system from acoustic noise during functional magnetic resonance imaging: examination of noise conduction through the ear canal, head, and body. J Acoust Soc Am. 2001;109:216–231. doi: 10.1121/1.1326083. [DOI] [PMC free article] [PubMed] [Google Scholar]
- 8.Mechefske CK, Wu Y, Rutt BK. Acoustic noise reduction in a 4T whole body MR imager. Proc Intl Soc Magn Reson Med. 2001;9:1752. [Google Scholar]
- 9.Occupational Safety and Health Administration (OSHA) Occupational Noise Exposure, 29CRF-1988, Part 1910.95 (1988)
- 10.Food and Drug Administration Magnetic resonance diagnostic device: panel recommendation and report on petitions for MR reclassification. Federal Register. 1998;53:7575–7579. [PubMed] [Google Scholar]
- 11.Acoustic Noise Measurement Procedure for Diagnostic Magnetic Resonance Imaging Devices, NEMA MS-4. 1989.
- 12.Cusack R, Cumming N, Bor D, Norris D, Lyzenga J. Automated post-hoc noise cancellation tool for audio recordings acquired in an MRI scanner. Hum Brain Mapp. 2005;24:299–304. doi: 10.1002/hbm.20085. [DOI] [PMC free article] [PubMed] [Google Scholar]
- 13.Jezzard P, Clare S. Sources of distortion in functional MRI data. Hum Brain Mapp. 1999;8:80–85. doi: 10.1002/(SICI)1097-0193(1999)8:2/3<80::AID-HBM2>3.0.CO;2-C. [DOI] [PMC free article] [PubMed] [Google Scholar]
- 14.Chambers J, Akeroyd MA, Summerfield AQ, Palmer AR. Active control of the volume acquisition noise in functional magnetic resonance imaging: method and psychoacoustical evaluation. J. Acoust. Soc. Am. 2001;110:3041–3054. doi: 10.1121/1.1408948. [DOI] [PubMed] [Google Scholar]
- 15.Goldman AM, Gossman WE, Friedlander PC. Reduction of sound levels with antinoise in MR imaging. Radiology. 1989;173:519–550. doi: 10.1148/radiology.173.2.2798889. [DOI] [PubMed] [Google Scholar]
- 16.Pla FG, Sommerfeldt SD, Hedeen RA. Active control of noise in magnetic resonance imaging; Proceeding of Active 95; Newport Beach, CA, USA. 1995.pp. 573–582. [Google Scholar]
- 17.Mcjury M, Stewart RW, Crawford D, Toma E. The use of active noise control (ANC) to reduce acoustic noise generated during MRI scanning: some initial results. Magn Reson Imaging. 1997;15:319–322. doi: 10.1016/s0730-725x(96)00337-2. [DOI] [PubMed] [Google Scholar]
- 18.Chen CK, Chiueh TD, Chen JH. Active cancellation system of acoustic noise in MR imaging. IEEE Trans Biomed Eng. 1999;46:186–191. doi: 10.1109/10.740881. [DOI] [PubMed] [Google Scholar]
- 19.Mechefske CK, Geris R. Acoustic Noise Reduction in a 4T MRI Scanner; 10th Asia Pacific Vibration Conference; Gold Coast, Queensland, Australia. 2003.pp. 10–14. [Google Scholar]
- 20.Kahana Y, Kots Alexander, Mican S, Chambers J, Bullock D. Optoacoustical ear defenders with active noise reduction in an MRI communication systems; Proceeding of Active 04; Williamsburg, Virginia, USA. 2004; paper a04_067. [Google Scholar]
- 21.More SR, Lim TC, Li M, Holland CK, Boyce SE, Lee J-H. Acoustic noise characteristics of a 4 Telsa MRI scanner. J Magn Reson Imaging. 2006;23:388–397. doi: 10.1002/jmri.20526. [DOI] [PubMed] [Google Scholar]
- 22.Ljung L. System identification: theory for the user. Prentice-Hall, Inc.; New Jersey: 1987. pp. 71–72. [Google Scholar]
- 23.Kuo SM, Morgan DR. Active noise control systems: algorithms and DSP implementations. John Wiley & Sons, Inc; New York: 1996. pp. 62–77. [Google Scholar]
- 24.Li M, Lim TC, Shepard WS., Jr. Modeling active vibration control of a geared rotor system. Smart Materials and Structures. 2004;13(3):449–458. [Google Scholar]
- 25.Franklin GF, Powell JD, Emami-Naeini A. Reading. 3rd edition Addison-Wesley Publishing Company; Massachusetts: 1994. Feedback control of dynamic systems; pp. 361–374. [Google Scholar]
- 26.Doyle JC, Francis BA, Tannenbaum AR. Feedback control theory. Macmillan Publishing Company; New York: 1992. pp. 97–99. [Google Scholar]
- 27.Elliott SJ. Signal processing for active control. Academic Press; London: 2001. pp. 349–354. [Google Scholar]
- 28.Moelker A, Maas RAJJ, Vogel MW, Ouhlous M, Pattynama PMT. Importance of bone-conducted sound transmission on patient hearing in the MR scanner. J Magn Reson Imaging. 2005;22:163–169. doi: 10.1002/jmri.20341. [DOI] [PubMed] [Google Scholar]


