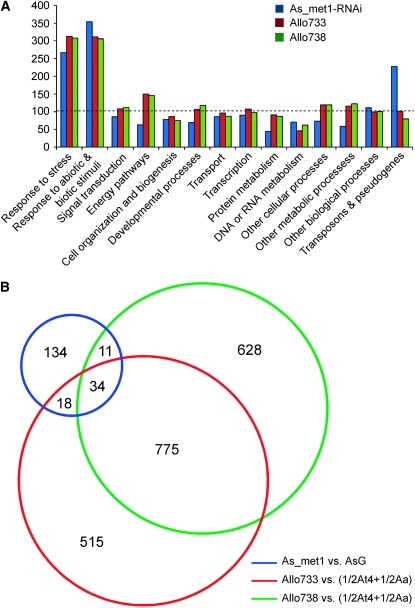
Figure 2.—
(A) The percentages of the genes in each functional category that are differentially expressed in met1-RNAi A. suecica and two resynthesized allotetraploids (Allo733 and -738) (Wang et al. 2006). The ratios in the y-axis were calculated using the observed percentage of the genes that are differentially expressed in each functional category in a microarray experiment divided by the expected percentage of all annotated genes in the Arabidopsis genome. The dashed line shows the observed percentage of the genes that are differentially expressed in a microarray experiment (e.g., the met1-RNAi line) equal to that of the expected genes in the whole genome (100%). Original microarray data were deposited in GEO (accession no. GSE9512). (B) Venn diagram showing comparison among the numbers of up- or downregulated genes in met1-RNAi A. suecica (blue) and nonadditively expressed genes in two allotetraploids, Allo733 (red) and Allo738 (green). AsG, A. suecica transformed with a GUS reporter.

