

Abstract
Traumatic brain injury (TBI) is one of the most common causes of long-term disability. Despite the importance of identifying neuropathology in individuals with chronic TBI, methodological challenges posed at the stage of inter-subject image registration have hampered previous voxel-based MRI studies from providing a clear pattern of structural atrophy after TBI. We used a novel symmetric diffeomorphic image normalization method to conduct a tensor-based morphometry (TBM) study of TBI. The key advantage of this method is that it simultaneously estimates an optimal template brain and topology preserving deformations between this template and individual subject brains. Detailed patterns of atrophies are then revealed by statistically contrasting control and subject deformations to the template space. Participants were 29 survivors of TBI and 20 control subjects who were matched in terms of age, gender, education, and ethnicity. Localized volume losses were found most prominently in white matter regions and the subcortical nuclei including the thalamus, the midbrain, the corpus callosum, the mid- and posterior cingulate cortices, and the caudate. Significant voxel-wise volume loss clusters were also detected in the cerebellum and the frontal/temporal neocortices. Volume enlargements were identified largely in ventricular regions. A similar pattern of results was observed in a subgroup analysis where we restricted our analysis to the 17 TBI participants who had no macroscopic focal lesions (total lesion volume> 1.5 cm 3). The current study confirms, extends, and partly challenges previous structural MRI studies in chronic TBI. By demonstrating that a large deformation image registration technique can be successfully combined with TBM to identify TBI-induced diffuse structural changes with greater precision, our approach is expected to increase the sensitivity of future studies examining brain-behavior relationships in the TBI population.
Keywords: Traumatic brain injury, Atrophy, Tensor-based morphometry, Diffeomorphic, Magnetic resonance imaging
Introduction
Each year, approximately 1.5 million people sustain traumatic brain injury (TBI) in the United States alone, causing billions of dollars of economic cost. Among the survivors, 80,000 to 90,000 individuals are left with significant long-term cognitive and motor disabilities (Jacobs, 1988; Max, Rice, & MacKenzie, 1990; McKinlay, Brooks, Bond, Martinage, & Marshall, 1981; Rutland-Brown, Langlois, Thomas, & Xi, 2006; Thomsen, 1984; Thurman, Alverson, Dunn, Guerrero, & Sniezek, 1999). However, efforts to identify the neuropathologic correlates of these deficits have gained only limited success to date (Bigler, 2001a; Levine et al., 2006). As Levine and colleagues (2002, 2006) appropriately pointed out, using more sensitive and reliable in vivo neuroimaging protocols may facilitate the identification of specific brain-behavior relationships in the TBI population.
Developing an imaging protocol that allows precise quantification of TBI-induced structural changes has proven to be challenging. The complicated nature of traumatic brain injuries typically involves a combination of focal and diffuse injury mechanisms (Gennarelli & Graham, 2005). While it is relatively easy to locate and quantify focal lesions such as contusions or hematom as through visual inspection and manual tracing, diffuse lesions such as diffuse axonal injury (DAI) have not been directly am enable to this traditional volumetric measurement. Instead, generalized atrophy is typically assessed using indirect measures such as total brain volume, ventricular enlargement, or ventricle to brain ratio. For more localized volume losses, individual structures hypothesized to be vulnerable to atrophy have been targeted as regions of interest (ROIs) for subsequent volum etric analysis. However, methodological limitations of these traditional volumetric approaches (cf. Bermudez & Zatorre, 2001; Dubb, Xie, Gur, & Gee, 2005) are likely to have undermined the accuracy and sensitivity of previous studies in identifying the common areas of volume loss in TBI. First, using gross volume or length measures of an anatomical structure fails to capture more localized shape variations within the region, decreasing the sensitivity of the measure. Second, selecting a small set of structures a priori leaves out other potentially relevant areas. This may be a particularly inefficient strategy for TBI, considering the diffuse nature of the injury. Third, manual slice-by-slice delineation makes it very hard to make ROIs where no clear boundary between two structures exists, limiting the analysis to clearly definable structures (e.g., lateral ventricles).
Reflecting these difficulties, previous volumetric neuroimaging studies have not been able to provide a definitive picture of TBI-induced structural changes. For example, Bigler (Bigler, 2001b, 2005) summarized the results from a large number of volumetric studies conducted over the last two decades and classified the degree of atrophy reported by each study into three categories: “major” atrophy was reported in the total brain volume, the lateral ventricles, and the corpus callosum; “moderate” volume changes were found in the third ventricle, the amygdala, and the hippocampus; “minimal” atrophy was found in the basal ganglia, the thalamus, the fornix, the mammillary body, the cingulate gyrus, the midbrain, the cerebellum , the internal capsule, and the corticospinal tracts. However, since different regions were measured in separate studies with different participants and imaging protocols, it is hard to know whether a subset of regions is more affected than others or there is only a generalized, non-specific pattern of atrophy in TBI.
This limitation of previous volumetric approaches in providing a more comprehensive and unbiased picture of structural changes motivated some TBI researchers to adopt a fully automated, whole brain image processing pipeline such as voxel-based morphometry (VBM; Gale, Baxter, Roundy, & Johnson, 2005; Salmond, Chatfield, Menon, Pickard, & Sahakian, 2005; Tomaiuolo et al., 2005). In VBM, individual structural images are normalized to a common sterotaxic space, segmented based on intensity (into gray matter, white matter, and CSF), and smoothed to calculate tissue composition maps. These maps are then statistically compared voxel-wise to detect group differences (Ashburner & Friston, 2000; Good et al., 2001). This approach enables researchers to examine gray and/or white matter concentrations over the whole brain simultaneously without any a priori hypotheses. To date, only three studies have used this procedure in an attempt to characterize the structural consequences of TBI. Tomaiuolo and colleagues (2005) compared 19 TBI patients and 19 control subjects in terms of white matter density throughout the whole brain except the brainstem and the cerebellum . They observed white matter reduction in the corpus callosum, the fornix, the para-hippocam palgyrus, the optic radiation, the optic chiasm, the internal capsule, and the superior frontal gyrus. Gale and colleagues (2005) examined the gray matter density in nine patients and nine controls. They reported reduced density in a widespread area of gray matter including the subcortical gray matter, the cingulate gyrus, the frontal and temporal cortices, and the cerebellum. Salmond and colleagues (2005) evaluated both gray and white matter density in 22 patients and 23 controls. Compared to controls, patients were reported to have reduced density of gray matter in the basal forebrain, the hippocampal formation, the insula, the thalamus, the cerebellum , and the areas of neocortex (temporal, occipital, and parietal lobes). Less marked white matter density reduction was found in the lateral capsular pathway and the corpus callosum.
Although the results from these VBM studies are encouraging, they still do not provide a detailed, reliable picture of the pattern of volume loss associated with TBI for the following reasons. First, the biggest concern is related to the step of spatially registering each brain to a reference template. Since the tissue density calculation of the VBM procedure is based on the assumption of successful normalization, any misregistration during the normalization process can potentially lead researchers to falsely identify registration errors as true anatomic differences (Bookstein, 2001). In fact, achieving accurate normalization with minimal registration error is most critical in any voxel-based structural MRI study designed for a between-group comparison. However, the brains of TBI survivors present a great challenge to this process because they can exhibit severe global and focal atrophy. These structural abnormalities manifested in the brains of TBI subjects violate the basic assumptions of small deformations and/or simple intensity relationships used in many existing image registration methods (cf. Studholme et al., 2004). Unfortunately, none of the previous VBM studies of TBI used deformation models that are able to capture the expansive, large deformation atrophy induced by TBI. Because previous VBM studies all used a linear or coarse-resolution spatial normalization, results from those studies are bound to be ambiguous. The next step of VBM involves segmenting the normalized brain into different tissue types. Since segmentation requires a good separation of intensities, hypointense lesion areas of TBI subjects pose another challenge for the VBM method. Thus, the results of prior VBM studies may be confounded by unreliability in segmenting affected brain regions. The smoothing process is another limitation. In the VBM procedure, spatial smoothing of the segmented map is required to obtain normally distributed tissue concentration values for each voxel. However, image blurring caused by the smoothing further prevents one from doing a fine-grained analysis on localized atrophy. Lastly, previous VBM studies, except the one by Tomaiuolo et al. (2005), did not control for the effects of macroscopic focal lesions on the preprocessing steps of VBM such as segmentation and normalization. A subgroup analysis excluding participants with macroscopic focal lesions should be done to rule out the confounding effects of large focal lesions on the pattern of volume loss.
The purpose of the present study was to delineate the pattern of diffuse volume changes after TBI with more detail and certainty by using a processing protocol that is more optimally suited to TBI data. Compared to prior VBM studies, the following methodological improvements have been made in the current study. First, tensor-based morphometry (TBM; Ashburner et al., 1998; Chung et al., 2001; Davatzikos, Genc, Xu, & Resnick, 2001; Gaser, Volz, Kiebel, Riehemann, & Sauer, 1999; Studholme et al., 2004; Thompson et al., 2000) was used. TBM methods utilize information from high resolution deformation tensor fields obtained from the non-linear transformations of individual images to the template. Anatomic differences can be directly characterized from the properties of these deformation tensor fields. In addition, since the TBM method does not require a segmentation step, one can avoid the difficult issue of accurate tissue classification complicated, in particular, by unpredictable changes in tissue appearance due to TBI. TBM has been validated against an expert tracing method (Gaser, Nenadic, Buchsbaum, Hazlett, & Buchsbaum, 2001) and also used to detect group differences between healthy controls and various patient populations including schizophrenia (Gaser et al., 1999), dementia (Studholme et al., 2004), and HIV/AIDS (Chiang et al., 2007). It has been recently shown that, compared to the traditional volumetric method, TBM yields more statistical power to associate structure with other biological and demographic variables (Lee et al., 2007). It was also demonstrated that the method is well suited to track longitudinal changes of individual brains (e.g., Brambati et al., 2007; Cardenas, Studholme, Gazdzinski, Durazzo, & Meyerhoff, 2007; Leow et al., 2006).
Second, to further enhance the accuracy and sensitivity of TBM protocol, a novel algorithm, symmetric normalization (SyN ; Avants, Epstein, Grossman, & Gee, in press; Avants, Schoenemann, & Gee, 2006) was employed for the inter-subject image normalization. SyN is a recently developed, high-resolution diffeomorphic image registration algorithm that uses large deformation capabilities to maximize the sensitivity of neuroimaging studies (for diffeomorphic image matching technique, see Avants & Gee, 2004; Miller, 2004). Its ability to capture large deformation shape change minimizes the well-known shortcomings of SPM 2 (Ashburner et al., 1998), which underestimates the shape transformations required when analyzing atypical brains such as those of TBI patients. This technique has been successfully used to quantify spatial and longitudinal atrophy patterns of neurodegenerative disorders (Avants et al., in press; Avants, Grossman, & Gee, 2005).
Third, the current study was performed with an optimal, population-specific template that fairly represents both controls and TBI patients. To construct such a template, symmetric normalization uses a shape and appearance averaging technique (Avants & Gee, 2004; Avants et al., 2006) to estimate the most representative brain for a population of images. Our approach weighted each individual in such a way that controls and patients contributed equally to the final template. The resulting custom template contains sharp features, shared across the population, that are necessary for successful high-resolution image normalization. This custom template also enables statistically fair comparisons between the two groups while guaranteeing the ability to capture the finest shape differences. It has been previously shown that normalization to a custom template improves localization accuracy, reduces bias in statistical testing, and ultimately yields more biologically plausible results (Kochunov et al., 2005; Kochunov et al., 2001; Leow et al., 2006; Senjem, Gunter, Shiung, Petersen, & Jack, 2005; Woods, 2003). Lastly, the present study also attempted to control for the effects of the macroscopic focal lesions on the group differences by conducting a subgroup analysis after excluding subjects with such lesions. These methodological improvements are expected to help in revealing more reliable and fine-grained patterns of structural consequences resulting from TBI.
Materials and Methods
Participants
The data were collected as part of a larger study investigating the neural correlates of attention deficits and treatment responses of various psychoactive drugs in the survivors of TBI (principal investigator: J.W.). Thirty individuals with TBI and 20 healthy volunteers were recruited. We planned to recruit more TBI participants because data of TBI survivors are more likely to be discarded in a typical functional neuroimaging study due to movements in the scanner and poor behavioral performance. TBI participants were recruited from a variety of clinical services at MossRehab and through a consent-based registry of individuals with TBI who are interested in participating in rehabilitation research. To be included, participants had to be between the ages of 16 and 60, and to have a history of non-penetrating traumatic brain injury of at least moderate severity at least 3 months prior to enrollment. Severity level was defined by significant and well-documented loss or alteration of consciousness following injury (i.e., lowest Glasgow Coma Scale (GCS) score of less than 12, or prospectively documented post-traumatic amnesia (PTA) of greater than 1 hour), or focal abnormality on a neuroimaging study that was attributable to traumatic injury. A subjective complaint of attention difficulties by the participant, treating clinician, or caregiver was also required. Potential participants were excluded if they had a history of prem orbid neurologic disease, psychosis, major affective disorder, mental retardation, Attention Deficit Hyperactivity Disorder, or if they were currently abusing alcohol or recreational drugs. Persons who were taking psychoactive medications other than anticonvulsants were also excluded. Participants and/or their involved caregivers (depending on the participant’s cognitive capacity) provided informed consent. The study protocol was approved by the Albert Einstein Healthcare Network and the University of Pennsylvania IRBs. Twenty healthy volunteers, matched to patients for age, gender, handedness, years of education, and ethnicity, participated in the study. Control participants were recruited based on the same inclusion/exclusion criteria as patients, with the exception that they never had a TBI resulting in loss or alteration of consciousness, nor suffered attention complaints. Control participants were recruited through the family and friendship networks of the participants with TBI, and through public advertising.
Data from one TBI participant whose MRI scan showed a large area of encephalom alacia over almost the entire right hemisphere were excluded. The remaining 29 subjects with TBI included 21 men and 8 women aged between 18 and 58 years (mean age = 36.9, SD = 11.4) with a mean education of 13.1 years (SD = 2.8). Twenty three of them were right-handed (Edinburgh Handedness Inventory, Oldfield, 1971). Fourteen of them were Caucasians, 10 African Americans, 4 Hispanics, and 1 Asian. Selected demographic and clinical characteristics of the TBI survivors are reported in Table 1. Control participants included 17 men and 3 women aged between 21 and 50 years (mean age = 34.9, SD = 9.8) with a mean education of 13.1 years (SD = 1.7). Sixteen of them were right-handed. Eleven of them were Caucasians, 7 African Americans, 1 Asian, and 1 unknown. The two groups did not differ significantly in terms of age, gender, ethnicity, handedness or years of education (tested with t-test or Fisher’s exact test, as appropriate).
Table 1.
Selected demographic and clinical characteristics of TBI survivors*
| Patient ID | Age | Gender | Months post injury | Mechanism | Lesion location | Total lesion volume (cm3) |
|---|---|---|---|---|---|---|
| 1 | 25.7 | M | 31.6 | NK | ||
| 3 | 47.9 | M | 67.1 | MVA | L temporal pole; R occipital | 43.8 |
| 4 | 46.0 | M | 330.2 | MVA | R temporal and orbitofrontal | 32.4 |
| 5 | 31.3 | M | 72.1 | MVA | R superior frontal | 0.7 |
| 7 | 48.7 | M | 121.9 | Assault | L superior temporal and orbitofrontal; L superior frontal | 9.9 |
| 8 | 42.4 | F | 224.6 | MVA | ||
| 9 | 23.3 | M | 78.0 | MVA | L frontal pole and orbitofrontal lesion extending to superior frontal | 64.5 |
| 10 | 18.8 | M | 16.5 | Fall | R temporal pole; R orbitofrontal; L orbitofrontal | 87.7 |
| 11 | 38.4 | M | 184.4 | MVA | ||
| 12 | 22.9 | M | 16.2 | Car/ped | R temporal pole; L superior frontal | 23.7 |
| 13 | 39.0 | F | 219.1 | Car/ped | R temporal and orbitofrontal | 41.3 |
| 14 | 42.7 | M | 18.6 | MVA | ||
| 15 | 23.1 | M | 47.1 | MVA | R thalamus | 0.2 |
| 16 | 58.4 | F | 160.8 | MVA | ||
| 17 | 42.5 | M | 8.1 | Assault | ||
| 18 | 23.9 | F | 6.4 | NK | R superior frontal; posterior body of corpus callosum | 0.9 |
| 19 | 30.0 | M | 160.3 | MVA | L subcortical lesion involving thalamus, basal ganglia, and internal/external capsule extending into centrum semiovale | 17.1 |
| 20 | 34.5 | M | 5.0 | MVA | L putamen | 1.1 |
| 21 | 24.7 | M | 4.1 | Car/ped | ||
| 22 | 56.2 | M | 15 | Fall | Bilateral orbitofrontal extending into frontal pole superiorly | 113.3 |
| 23 | 43.9 | M | 4.8 | MVA | ||
| 24 | 24.6 | M | 25.3 | MVA | ||
| 25 | 39.7 | M | 5.0 | MVA | ||
| 26 | 33.1 | F | 4.5 | MVA | ||
| 27 | 47.2 | M | 95.5 | Assault | L frontal lesion extending into anterior temporal; L superior temporal; R temporal, occipital, and parietal cortices | 203.3 |
| 28 | 53.4 | F | 7.4 | Fall | L superior frontal; L temporal; R internal capsule; R putamen; L thalamus | 2.3 |
| 29 | 43.0 | M | 7.2 | Car/bike | ||
| 31 | 21.6 | F | 8.2 | MVA | L temporal and bilateral superior frontal; R putamen | 43.6 |
| 32 | 44.1 | F | 15.7 | MVA | L orbitofrontal | 1.4 |
M=Male. F=Female. MVA=Motor Vehicle Accident. Car/ped=Car/Pedestrian Accident. Car/bike=Car/bike Accident. NK=Not Known. R=Right. L=Left.
Image acquisition
The functional imaging was conducted on a Siemens 3.0 T Trio whole-body scanner (Siemens AG, Erlangen, Germany), using a standard Transmit/Receive head coil. High resolution T1-weighted anatomic images were obtained using 3D M PRAGE imaging sequence using the following acquisition parameters: TR = 1620ms, TI = 950ms, TE = 3ms, flip angle = 15°, 160 contiguous slices of 1.0 mm thickness, FOV = 192×256m m2, matrix = 192× 256, 1NEX with a scan time of 6 minutes. The resulting voxel size was 1 mm3.
Lesion assessment
To quantify the volume of lesions, a trained observer (J.P.) manually segmented the lesion area under supervision of a neurologist (H.B.C.) with extensive experience in lesion assessment. Focal lesions included any cystic cavities and other focal regions of abnormal signal in the white or gray matter. The ITK-SN AP software (Yushkevich et al., 2006; http://www.itk.org) was used for a 3D -based segmentation. Total lesion volume was calculated using a stand-alone utility provided by VoxBo software (Center for Functional Neuroimaging, Philadelphia, PA, http://www.voxbo.org).
Image analysis
Creation of an optimal custom template
The first stage of image processing involved constructing an optimal, population-specific template representing the average shape and intensity of the brain images of both controls and patients utilizing a diffeomorphic shape and intensity averaging technique (Avants & Gee, 2004; Avants et al., 2006). The custom template was derived from a set of 29 individuals with TBI and 20 demographically matched healthy controls included in the final data analysis of the study.1 This procedure is fully automated, given a user-selected set of parameters for the registration. These parameters consist of choosing the multi-resolution strategy (here, a four level Gaussian pyramid) as well as the similarity metric for the optimization, along with a maximum number of iterations. We used the region-based cross-correlation similarity metric which is robust to locally varying inhomogeneity in the appearance of images (Avants et al., in press). The maximum number of iterations in the normalization was set to 200, although convergence may occur before the maximum is reached. The output of this stage is an unbiased average shape and appearance template, as well as the set of diffeomorphisms and inverse diffeomorphisms that map from tem plate to each individual. Two templates were initially built: one derived from controls (Figure 1,a) and the other from patients (Figure 1, b). Then, the average shape and appearance map of these two templates was constructed to serve as the optimal custom template (Figure 1, c). Given the unequal group size (29 vs. 20), averaging all images simultaneously would have biased the template by the relative numbers of TBI subjects and to controls. Thus, by averaging the TBI and control templates, we intended to give equal weight to both TBI and control brain structures. The resulting template brain has enough sharp features (see Figure 2) to be able to serve as a reference template for spatially normalizing both control and TBI neuroanatomy.
Figure 1.

Illustration of the key stages of the approach employed by the current study. First, an optimized custom tem plate (c) is constructed by obtaining the shape and appearance average of the control (a) and patient (b) templates. A rigid-body transformed brain of a patient (one example brain is shown as d) is normalized to the custom template via SyN algorithm producing a large deformation field map (e). The resulting normalized brain (f) shows a high degree of alignment with the tem plate. A Jacobian map (g) is then calculated from the deformation field tensors to quantify the regional alterations of brain volume.
Figure 2.

Areas of significant volume differences between TBI survivors and healthy controls displayed on the custom template brain (FDR p < .05 after multiple comparison correction; cluster size > 10 for display purpose). Volume losses are coded with hot colors (yellow and red) and volume enlargements with cold colors (green and blue).
Symmetric diffeomorphic image normalization
After going through a 6-parameter rigid-body transformation, each individual brain was registered to the final optimal custom template using the symmetric normalization algorithm (SyN; Avants et al., in press; Avants et al., 2006). While allowing large deformations, SyN constrains the deformations to be physically reasonable. That is, no folds or tears are created in the estimate. Anatomy is assumed to deform smoothly such that the topology of the brain is preserved; structures that are neighbors before transformation are also neighbors after transformation. Because of these constraints, the resulting map is both invertible and differentiable. When a normalization map has these properties, it is called a diffeomorphism (Avants & Gee, 2004; Avants et al., 2005; Miller, Trouve, & Younes, 2002). SyN’s novel formulation builds on prior work by guaranteeing that each mapping is a diffeomorphism that has intrinsic symmetry properties. Symmetry, in this context, indicates that the method’s output is ‘consistent’, that is, not biased to which image is chosen as template or target. The map computed from template to target is guaranteed to be the exact inverse of the map computed from target to template. The reverse is also true. In a recent evaluation study, SyN, with a cross-correlation similarity term, was shown to significantly and systematically outperform other state-of-the-art algorithms such as the Demons algorithm (Thirion, 1998) and a closely related elastic cross-correlation registration method. The methods were evaluated with respect to their ability to reproduce manually generated segmentations of brain structures in healthy elderly and neurodegenerative subjects (Avants et al., in press). SyN is implemented within our extended version of the ITK deformable image registration framework (cf. Yoo, 2003).
Tensor-based morphometry
The nonlinear transformations resulting from the SyN algorithm also provide deformation tensor fields, defined in the optimal template space, that describe the voxel-wise shape change from the template to each subject’s brain. Jacobian determinant values derived from these tensor fields indicate the fractional volume expansion and contraction at each voxel (e.g., Chung et al., 2001; Davatzikos et al., 1996). In other words, the resulting Jacobian map quantifies the magnitude of regional volume alterations required to match the template. To account for the individual differences in brain size, the Jacobian determinants were adjusted for the total within-skull volume of each subject. Before the statistical testing, this adjusted Jacobian map was subjected to a log transformation to make the distribution closer to the normal distribution (Avants et al., 2006; Leow et al., 2006). Comparing the log-tranformed Jacobian determinant values allowed us to identify regions of systematic volumetric differences between the healthy controls and the individuals with TBI. No voxels survived the family-wise error correction in the group comparison. Thus, statistical significance was defined using a whole-brain false-discovery-rate (FDR) of 5% (p < .05) after multiple comparison correction (Genovese, Lazar, & Nichols, 2002). Statistical group comparison and thresholding was performed with Statistical Parametric Mapping software (SPM 2, Wellcome Department of Cognitive Neurology, London, UK, http://www.fil.ion.ucl.ac.uk/spm). A public domain software package MRIcro (http://www.psychology.nottingham.ac.uk/staff/crl/mricro.html) was used to project the results to our custom template. The peak coordinates were mapped to MNI space by registering the custom template to the Colin brain (Van Essen et al., 2001) using SyN. Those peaks were then converted to Talaraich coordinates (Talairach & Trounoux, 1988), as presented in Table 2 and Table 3, to allow comparison with locations of activations from previous studies. This non-linear conversion was achieved using a MATLAB program provided with SPM extensions (http://www.mrccbu.cam.ac.uk/Imaging/Common/mnispace.shtml). However, due to the errors inherent to this transformation process (Chau & McIntosh, 2005), the labels of the peaks in the custom template were manually obtained using a human atlas of neuroanatomy (Mai, Assheuer, & Paxinos, 2004), instead of using the Talairach Daem on (Lancaster et al., 2000).
Table 2.
Regions of significant volume loss in 29 TBI survivors compared with 20 healthy control subjects*
| Cluster number | Size (voxel) | Peak T | Talairach Coordinates (x y z) | Side | Location | Tissue type | ||
|---|---|---|---|---|---|---|---|---|
| 1 | 1095 | 6.27 | −1 | −15 | 6 | L | thalamus (mediodorsal nucleus) | GM |
| 4.62 | −7 | −21 | 13 | L | thalamus (pulvinar) | GM | ||
| 4.42 | −12 | −32 | 9 | L | thalamus (pulvinar) | GM | ||
| 2 | 510 | 4.85 | 29 | −59 | −34 | R | cerebellum (posterior lobe) | GM |
| 4.52 | 31 | −67 | −33 | R | cerebellum (posterior lobe) | GM | ||
| 4.52 | 21 | −75 | −32 | R | cerebellum (posterior lobe) | GM | ||
| 3 | 179 | 4.62 | −6 | 11 | −3 | L | head of caudate | GM |
| 4 | 131 | 4.62 | 17 | −30 | 6 | R | thalamus (pulvinar/geniculate nucleus) | GM |
| 5 | 130 | 4.77 | −11 | 3 | 40 | L | midcingulate cortex | GM |
| 3.96 | −11 | −5 | 43 | L | midcingulate cortex | GM | ||
| 6 | 64 | 4.93 | 12 | 20 | −4 | R | head of caudate | GM |
| 7 | 61 | 4.77 | −12 | −52 | −11 | L | cerebellum (anterior lobe) | GM |
| 8 | 49 | 4.42 | 34 | 5 | −5 | R | putamen | GM |
| 9 | 44 | 4.28 | 52 | 5 | −20 | R | superior temporal cortex | GM |
| 10 | 32 | 4.29 | 56 | −23 | −9 | R | middle temporal cortex | GM |
| 11 | 27 | 4.1 | 11 | −77 | 1 | R | occipital cortex | GM |
| 12 | 26 | 4.13 | −9 | −35 | −17 | L | midbrain (tectum) | GM |
| 13 | 24 | 4.58 | 4 | −10 | −9 | R | mammillary body/substantia nigra | GM |
| 14 | 12 | 4.2 | −1 | 38 | −7 | L | anterior cingulate cortex | GM |
| 15 | 789 | 5.43 | −5 | −23 | −14 | L | midbrain (cerebral peduncle) | WM |
| 4.34 | 0 | −18 | −8 | midbrain (cerebral peduncle) | WM | |||
| 16 | 604 | 6.36 | 18 | 8 | 28 | R | midcingulate cortex | WM |
| 17 | 521 | 4.67 | −11 | −38 | 13 | L | splenium of corpus callosum | WM |
| 4.49 | −7 | −35 | 21 | L | splenium of corpus callosum | WM | ||
| 4.03 | 9 | −33 | 20 | R | splenium of corpus callosum | WM | ||
| 18 | 417 | 5.59 | 2 | −28 | 29 | R | posterior cingulate gyrus/body of corpus callosum | WM |
| 4.36 | 4 | −11 | 25 | R | body of corpus callosum | WM | ||
| 19 | 304 | 4.62 | 27 | −3 | 32 | R | frontal cortex | WM |
| 20 | 213 | 5 | 27 | −30 | 32 | R | posterior cingulate cortex | WM |
| 4.08 | 22 | −33 | 41 | R | posterior cingulate cortex | WM | ||
| 21 | 148 | 4.96 | −11 | 6 | 30 | L | midcingulate cortex | WM |
| 22 | 137 | 5.35 | −24 | 29 | 22 | L | frontal cortex | WM |
| 23 | 96 | 4.97 | −12 | 33 | 13 | L | anterior cingulate cortex | WM |
| 24 | 81 | 4.31 | 7 | −39 | 16 | R | splenium of corpus callosum | WM |
| 25 | 70 | 4.58 | 13 | 28 | 2 | R | genu of corpus callosum | WM |
| 26 | 64 | 4.47 | 23 | −17 | 46 | R | midcingulate cortex | WM |
| 27 | 62 | 4.54 | 16 | −10 | −10 | R | midbrain (cerebral peduncle) | WM |
| 28 | 49 | 4.72 | −48 | −31 | −2 | L | middle temporal cortex | WM |
| 29 | 45 | 4.35 | 9 | −64 | 25 | R | precuneus/cuneus | WM |
| 30 | 42 | 4.27 | 3 | −32 | −13 | R | midbrain (tectum) | WM |
| 31 | 36 | 4.24 | −10 | −27 | −2 | L | midbrain (cerebral peduncle) | WM |
| 32 | 34 | 4.12 | 12 | −28 | −32 | R | pons | WM |
| 33 | 32 | 4.32 | −41 | −43 | 2 | L | temporal cortex | WM |
| 34 | 32 | 4.24 | 23 | 12 | 38 | R | frontal cortex | WM |
| 35 | 19 | 4.45 | −21 | −44 | −32 | L | cerebellum (tonsil) | WM |
| 36 | 18 | 4.06 | −26 | −1 | 36 | L | frontal cortex | WM |
| 37 | 14 | 4.17 | −17 | 31 | −13 | L | frontal cortex (orbital) | WM |
| 38 | 13 | 4.28 | −42 | −9 | −18 | L | temporal cortex | WM |
| 39 | 13 | 4.15 | −22 | 9 | 39 | L | frontal cortex (superior) | WM |
| 40 | 13 | 3.97 | −2 | −30 | −13 | L | midbrain (tectum) | WM |
Coordinates of local maxima at least 8 mm apart are reported per each cluster (maximum 3 maxima). When more than one tissue type is located within a cluster, only the more prominent tissue type is reported. R=Right. L=Left. BA=Brodmann area. GM=gray matter. WM=white matter.
Table 3.
Regions of significant volume expansion in 29 TBI survivors compared with 20 healthy control subjects*
| Cluster number | Size (voxel) | Peak T | Talairach coordinate (x y z) | Side | Location | Tissue type | ||
|---|---|---|---|---|---|---|---|---|
| 1 | 15797 | 5.35 | −2 | −4 | −4 | L | third ventricle | CSF |
| 5.19 | 4 | 5 | 7 | R | lateral ventricle | CSF | ||
| 4.99 | 6 | 20 | 6 | R | lateral ventricle | CSF | ||
| 2 | 1137 | 4.58 | 25 | −45 | 4 | R | lateral ventricle/temporal lobe | CSF |
| 4.1 | 27 | −42 | −2 | R | lateral ventricle/temporal lobe | CSF | ||
| 3.72 | 23 | −36 | 9 | R | lateral ventricle/temporal lobe | CSF | ||
| 3 | 845 | 5.34 | 0 | −23 | 2 | R | third ventricle | CSF |
| 5.12 | 2 | −30 | 10 | R | third ventricle | CSF | ||
| 4 | 317 | 4.6 | 61 | −5 | 41 | R | central sulcus/precentral gyrus | CSF |
| 4.09 | 57 | −7 | 48 | R | central sulcus/precentral gyrus | CSF | ||
| 5 | 139 | 4.39 | −47 | −81 | 15 | L | occipital cortex | CSF |
| 6 | 127 | 4.43 | 45 | 34 | 38 | R | CSF next to superior frontal cortex | CSF |
| 7 | 124 | 4.29 | −13 | −48 | −22 | L | fourth ventricle/cerebellum | CSF |
| 8 | 103 | 4.72 | 24 | −38 | −37 | R | CSF next to cerebellum/cerebellum | CSF |
| 9 | 83 | 4.4 | −1 | 69 | 12 | L | CSF next to superior frontal cortex | CSF |
| 10 | 78 | 4.35 | −18 | −29 | −14 | L | CSF next to brainstem | CSF |
| 11 | 67 | 3.9 | −55 | −68 | 9 | L | middle temporal sulcus/gyrus | CSF |
| 12 | 65 | 3.95 | 3 | −50 | −20 | R | fourth ventricle/cerebellum | CSF |
| 13 | 61 | 4.15 | 14 | −31 | −17 | R | CSF next to brainstem | CSF |
| 14 | 54 | 3.85 | −50 | 21 | 20 | L | CSF next to inferior frontal cortex | CSF |
| 15 | 52 | 4.4 | −41 | −39 | −30 | L | CSF next to cerebellum | CSF |
| 16 | 50 | 4.04 | 24 | −8 | −33 | R | CSF next to temporal cortex/temporal cortex | CSF |
| 17 | 28 | 4.09 | −15 | 15 | 54 | L | superior frontal sulcus | CSF |
| 18 | 26 | 3.87 | 23 | 66 | 5 | R | CSF next to superior frontal cortex | CSF |
| 19 | 26 | 3.85 | 51 | 50 | 15 | R | CSF next to superior frontal cortex | CSF |
| 20 | 22 | 3.91 | −14 | −9 | −20 | L | CSF next to parahippocampal gyrus | CSF |
| 21 | 21 | 3.95 | −7 | −71 | −25 | L | CSF next to cerebellum | CSF |
| 22 | 20 | 4 | 38 | −43 | −28 | R | CSF next to cerebellum | CSF |
| 23 | 18 | 4.15 | 27 | 38 | 47 | R | CSF next to superior frontal cortex | CSF |
| 24 | 15 | 3.78 | 34 | 35 | 45 | R | CSF next to superior frontal cortex | CSF |
| 25 | 13 | 4.06 | 58 | −11 | −37 | R | CSF next to temporal cortex | CSF |
| 26 | 89 | 4.22 | −36 | 3 | −5 | L | external capsule/insula | WM |
| 27 | 75 | 4.14 | −48 | −27 | 51 | L | postcentral gyrus | WM |
| 28 | 33 | 3.84 | 25 | 15 | 12 | R | internal capsule | WM |
| 29 | 30 | 3.72 | −15 | 8 | 7 | L | internal capsule | WM |
| 30 | 21 | 3.87 | −48 | 29 | 16 | L | inferior frontal cortex | WM |
The details of this table are the same as those of Table 2. CSF=cerebrospinal fluid.
Subgroup analyses
Additional analyses were conducted to examine the effects of macroscopic focal lesions on the main findings. Participants with TBI were split into two groups using the criterion of their total volume of focal lesions. Seventeen TBI participants who had a total lesion volume less than 1.5 cm3 formed the first group (the subgroup without macroscopic lesions). The remaining 12 TBI participants formed the second group (the subgroup with such lesions). Statistical group comparisons between the control group and each subgroup were performed. Since the purpose of conducting the subgroup analyses was to compare the overall pattern of atrophy qualitatively rather than quantitatively, we present arbitrarily thresholded maps (uncorrected, p < .005) for comparison purposes.
Results
Figure 2 shows the profile of local volume differences between individuals with TBI (N = 29) and healthy controls (N = 20). Compared to controls, survivors of TBI showed volume reductions in widespread areas of both gray and white matter. Table 2 reports the details of the regions where significant volume losses were found in TBI survivors. The largest area of volume loss was found in the thalamus clusters (mediodorsal nucleus and pulvina), followed by the midbrain clusters (cerebral peduncle and tectum), the cingulate cortex cluster (midcingulate, posterior, and anterior cingulate cortices; the corpus callosum clusters (genu, body, and splenium of corpus callosum), the cerebellum, the caudate, and the frontal and temporal cortices. As shown in Table 3, TBI participants also showed volume expansions, mainly in the ventricular system (the lateral, the third, and the fourth ventricles). Volume enlargements were also found in the spaces between various brain structures and some white matter regions. In the tables, only clusters larger than 0.1 cm3 are reported.
Subgroup analyses
Figure 3 shows the pattern of TBI-related atrophy found in the subgroup analysis after excluding 12 subjects with macroscopic focal lesions (total lesion volume > 1.5 cm3). Twenty control subjects and 17 TBI survivors were included in the analysis. As can be seen in the figure, major areas of volume loss in the main analysis were also visible in the subgroup analysis (the thalamus, the midbrain, the cingulate cortex, the corpus callosum, the cerebellum, the caudate, and the frontal/temporal neocortex areas). This result strongly suggests that the findings in the main analysis truly reflect the diffuse brain injury in TBI without large confounding effects of macroscopic lesions.
Figure 3.
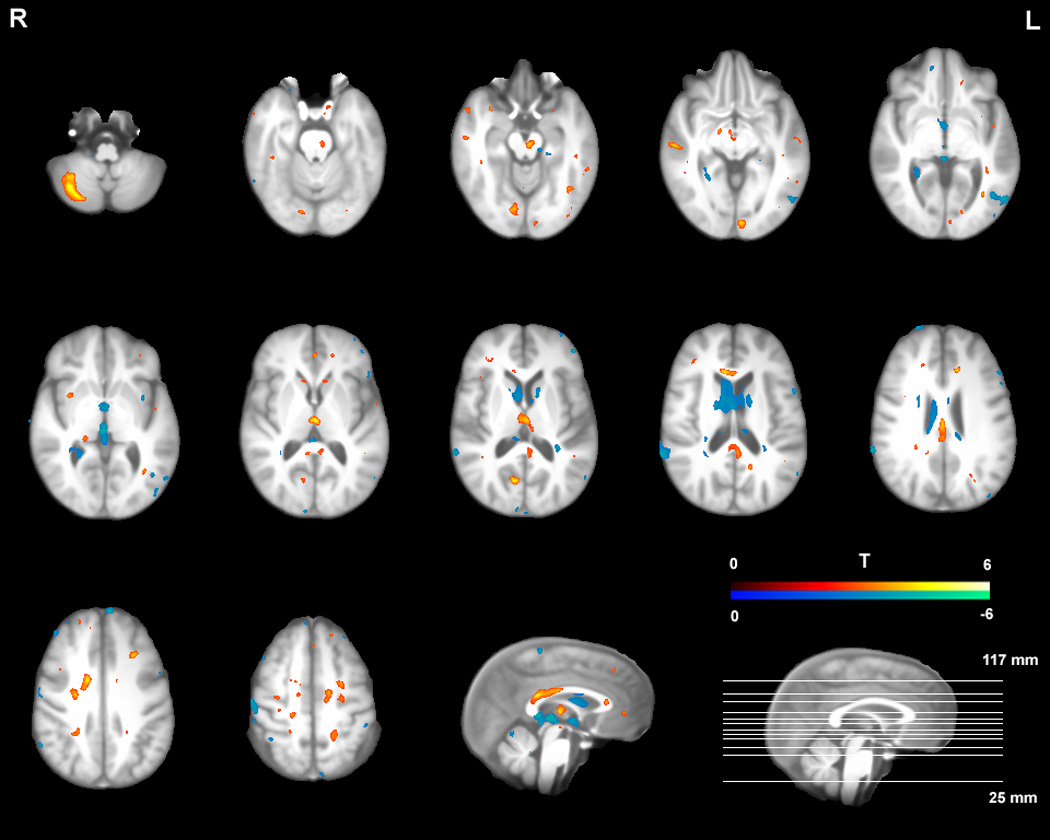
Pattern of volume differences between TBI survivors and healthy controls in the subgroup analysis including only 17 TBI participants without macroscopic focal lesions (p < .005 uncorrected; cluster size > 10 for comparison purpose). Volume losses are coded with hot colors (red and yellow) and volume enlargements with cold colors (blue and green).
Results from the contrast between the controls and 12 TBI participants with macroscopic lesions also show a similar pattern (Figure 4), supporting the notion that our results from the main analysis were not distorted by including the TBI survivors with large lesions. In fact, a direct statistical comparison (independent sample t-test) between the two TBI subgroups did not yield significant group differences. No voxel survived even when a more lenient threshold was used (an FDR of 10%), indicating the atrophy patterns are similar in both groups. However, visual inspection of the Figure 3 and Figure 4 still shows much more widespread volume losses (midbrain, basal ganglia, medial prefrontal cortex) and enlargements (posterior ventricular regions) for the TBI survivors with macroscopic lesions. This is not surprising given the fact the individuals with macroscopic lesions are likely to be also the ones with greater injury severity.
Figure 4.

Pattern of volume differences between TBI survivors and healthy controls in the subgroup analysis including only 12 TBI participants with macroscopic focal lesions (p < .005 uncorrected; cluster size > 10 for comparison purpose). Volume losses are coded with hot colors (red and yellow) and volume enlargements with cold colors (blue and green).
Discussion
The present study demonstrates that a large deformation image registration technique (SyN) can be successfully combined with a TBM method to delineate a 3D pattern of TBI-induced volume changes with greater precision. Localized volume losses were found mainly in the deep nuclei and the white matter regions including the thalamus, the midbrain, the cingulate cortex (white matter portion), the corpus callosum, and the caudate. Significant volume loss clusters were also detected in the cerebellum and the frontal/temporal cortices. Localized volume expansions were also found largely in the ventricular system . These results were replicated in our subgroup analysis w here only 17 TBI participants who had no macroscopic focal lesions (> 1.5 cm3) were included, indicating that those results were not due to the effects of the focal lesions. These results provide further support for the notion that common areas of diffuse atrophy associated with TBI can be identified by a fully automated protocol despite the individual variability of the injury characteristics in this population.
Although the current study basically agrees with most of the prior volumetric and VBM investigations in that it reports a widespread pattern of atrophy in chronic TBI, there are important differences in the specific pattern of volume loss that merit further discussion. Since our study is the first one in which the whole brain (gray matter, white matter, and CSF) volume abnormalities in TBI are examined simultaneously with greater precision (see Introduction for more detailed description of methodological improvements of the current study), we believe new observations from the current study may provide clues to resolving some of the inconsistent findings among previous in vivo and post-mortem neuropathologic investigations of TBI survivors.
First, we detected the largest significant volume loss cluster in the thalamus. This was not an expected finding because thalamic atrophy was regarded as minimal in previous volumetric studies (Bigler, 2001b, 2005). Prior volumetric studies’ relative insensitivity to thalamic abnormality might be due to the facts that 1) only part of the thalamus is vulnerable to the atrophy and that 2) tracing the thalamus is not easy due to its unclear lateral boundary on T1 images. The two VBM studies that examined the gray matter concentration reduction (Gale et al., 2005; Salmond et al., 2005) reported significant clusters including the thalamus. However, they were not able to isolate the thalamus from other subcortical structures due to their low-resolution spatial normalization and smoothing. In contrast, our high-resolution normalization technique (SyN) enabled us to examine the volume loss of the thalamus on the sub-nucleus level. The majority of volume loss was found in the mediodorsal nucleus and the pulvina. In fact, it is well-known that the mediodorsal nucleus and the pulvina are heavily connected to the prefrontal cortex (Goldman-Rakic & Porrino, 1985; Romanski, Giguere, Bates, & Goldman-Rakic, 1997), a key region in which TBI survivors frequently show structural and functional alterations. Our results also agree well with the post-mortem neuropathologic studies reporting thalamic damage in patients in a vegetative state after head injury (Adams, Graham, & Jennett, 2000; Graham, Maxwell, Adams, & Jennett, 2005; Kinney & Samuels, 1994). In particular, Graham and colleagues (2005) report that their patients had a greater amount of neuronal loss in mediodorsal nucleus, compared to more ventral or lateral parts of the thalamus.
Second, an extensive volume loss was detected in the midbrain, another area that was not emphasized in past in vivo volumetric analyses. Combined with the thalamic volume loss, how ever, this pattern of atrophy has striking resemblance with the data from the recent simulation experiments of brain injury mechanisms. For example, according to a recent biomechanical study using finite element modelling, the structures going through the most shearing stress turned out to be the thalamus and the brainstem (Mendez, Hurley, Lassonde, Zhang, & Taber, 2005; Zhang, Yang, & King, 2004). Our finding of midbrain volume loss also agrees with the autopsy studies reporting a substantial diffuse axonal injury in this area (Adams et al., 1989; Gennarelli & Graham, 2005). In fact, Gennarelli and Graham (2005) reported that hemorrhages and tissue tears were found in the dorsolateral sector of the upper brainstem in 95% of severe cases of diffuse traumatic axonal injury.
Third, the present study detected volume losses in the basal ganglia nuclei such as the caudate and the putamen. This finding does not agree with the results from the Salmond et al. study (2005) that did not detect gray matter abnormalities in this region. They claimed that the intactness of basal ganglia that is rich in dopamine and serotonin favors the selective cholinergic deficit hypothesis in TBI survivors, but not the diffuse damage hypothesis. However, our study refutes this strong form of cholinergic hypothesis in TBI by reporting robust atrophies in the basal ganglia region. Furthermore, the current study reports volume losses in areas such as pons and substantia nigra, which are known to be part of the serotonergic and dopam inergic pathways respectively.
Fourth, statistical significance of the volume differences between the two groups were generally greater in the areas of gray and white matter where the volume losses were found, compared to the ventricular CSF regions where volume enlargements were detected. Given that numerous volumetric studies in the past had focused on ventricular enlargements to indirectly measure TBI-induced atrophy, we wanted to examine the relative strengths of the signal from the areas of volume losses and expansions. To illustrate this point, we re-ran our analysis with a more stringent threshold (FDR p < .01). Only some of the volume loss clusters (the thalamus, the midbrain, the cingulate cortex, the corpus callosum, and a white matter area of the frontal cortex) remained as significant while no regions of volume expansions (the ventricular system) survived at the new threshold. Based on this observation, it can be stated that ventricular enlargement might not be the most sensitive measure to be correlated with other clinical and neuropsychological variables.
A few potential limitations of the current study should be examined. First, unequal group sizes (29 patients and 20 controls) could have prevented us from finding out more subtle differences between the two groups by reducing the statistical power. Second, it should be pointed out that the weaknesses of the voxel-based methods in general also apply to the present study. For example, voxel-based analysis is sensitive only to local effects (Davatzikos, 2004). Thus, a multi-variate approach is desirable in the future to pick up more subtle and global changes of the brain; how ever, we note that traditional univariate analyses are required to properly interpret multivariate results. Another limitation of voxel-wise structural analysis is that it may have less sensitivity to the areas with greater inter-subject anatomical variability (cf. Tisserand et al., 2002). Thus, it is possible that the volume loss/expansion patterns in anatomically variable areas such as cortical gyri and sulci are likely to contain more false-negatives. This also explains our method’s relative insensitivity to the macroscopic lesions, because the lesion locations in our patients were largely in the cortical areas. Third, the present study has not “proved” the usefulness of our protocol in exploring the brain-behavior relationship in this population. A follow-up study quantitatively evaluating different approaches (volumetry, VBM, and TBM) in terms of the sensitivity to finding such relationships will be valuable. Fourth, one of our participant inclusion criteria was the presence of a subjective com plaint of attention difficulties. This criterion was adopted since the present study was a part of larger study investigating attention deficits in TBI. One might argue that this sampling strategy might have biased the common characteristics of volume losses we found in this study. However, given the fact that attention complaints are nearly ubiquitous among survivors of moderate to severe TBI (Ponsford & Kinsella, 1992) and that very few subjects were excluded solely because they had no attention complaints, it is unlikely that screening for attention deficit biased the current results significantly. Lastly, it should be noted that the TBM method compares the volumes, not the integrity of the tissue. For example, we found volume expansions in some white matter regions including the internal capsule. These changes are likely to be secondary, reflecting reduced compression of axonal tracts resulting from heavy atrophy of surrounding areas (e.g., the thalamus and the caudate nucleus). Another direction for future studies may be directly measuring the tissue integrity using neuroimaging techniques such as diffusion tensor imaging (DTI). A future DTI study may provide complementary data for the current findings of white matter volume loss/expansion in providing a more complete picture of structural consequences of TBI.
Acknowledgements
The authors wish to thank Monica Vaccaro, M. S., Patricia Grieb-Neff, M. A., Kathy Z. Tang, B.A., and Chris Weber for their help in subject recruitment and data analysis. The assistance of MRI technicians Doris Cain, Patricia O’Donnell, and Norman Butler is also gratefully acknowledged. This study is supported by grant R24H D 39621 from the NCMRR, NICHD, NIH, H 133G050219 from the NIDRR, U.S. Department of Education, and P30N S045839 from the NINDS, NIH. This project is also funded, in part, under a grant with the Pennsylvania Department of Health. The Department specifically disclaims responsibility for any analyses, interpretations, or conclusions.
Footnotes
In our earlier version of the manuscript, a template created from 17 individuals of TBI and 12 control subjects were used. An anonymous reviewer of the manuscript recommended using a template based on the full cohort. Using the new template produced minor differences in the pattern of significant volume loss under the same statistical threshold. The most notable one was the emergence of the cerebellum as the fifth largest volume loss cluster. This result indicates that using the full-cohort based template can affect the sensitivity of statistical testing in some regions.
Publisher's Disclaimer: This is a PDF file of an unedited manuscript that has been accepted for publication. As a service to our customers we are providing this early version of the manuscript. The manuscript will undergo copyediting, typesetting, and review of the resulting proof before it is published in its final citable form. Please note that during the production process errors may be discovered which could affect the content, and all legal disclaimers that apply to the journal pertain.
References
- Adams JH, Doyle D, Ford I, Gennarelli TA, Graham DI, McLellan DR. Diffuse axonal injury in head injury: definition, diagnosis and grading. Histopathology. 1989;15(1):49–59. doi: 10.1111/j.1365-2559.1989.tb03040.x. [DOI] [PubMed] [Google Scholar]
- Adams JH, Graham DI, Jennett B. The neuropathology of the vegetative state after an acute brain insult. Brain. 2000;123(Pt 7):1327–1338. doi: 10.1093/brain/123.7.1327. [DOI] [PubMed] [Google Scholar]
- Ashburner J, Friston KJ. Voxel-based morphometry--the methods. Neuroimage. 2000;11(6 Pt 1):805–821. doi: 10.1006/nimg.2000.0582. [DOI] [PubMed] [Google Scholar]
- Ashburner J, Hutton C, Frackowiak R, Johnsrude I, Price C, Friston K. Identifying global anatomical differences: deformation-based morphometry. Hum Brain Mapp. 1998;6(5–6):348–357. doi: 10.1002/(SICI)1097-0193(1998)6:5/6<348::AID-HBM4>3.0.CO;2-P. [DOI] [PMC free article] [PubMed] [Google Scholar]
- Avants B, Epstein CL, Grossman M, Gee JC. Symmetric diffeomorphic image registration with cross-correlation: evaluating automated labeling of elderly and neurodegenerative brain. Med Image Anal. doi: 10.1016/j.media.2007.06.004. in press. [DOI] [PMC free article] [PubMed] [Google Scholar]
- Avants B, Gee JC. Geodesic estimation for large deformation anatomical shape averaging and interpolation. Neuroimage. 2004;23 Suppl 1:S139–S150. doi: 10.1016/j.neuroimage.2004.07.010. [DOI] [PubMed] [Google Scholar]
- Avants B, Grossman M, Gee JC. The correlation of cognitive decline with frontotemporal dementia induced annualized gray matter loss using diffeomorphic morphometry. Alzheimer Dis Assoc Disord. 2005;19 Suppl 1:S25–S28. doi: 10.1097/01.wad.0000183083.14939.82. [DOI] [PubMed] [Google Scholar]
- Avants B, Schoenemann PT, Gee JC. Lagrangian frame diffeomorphic image registration: Morphometric comparison of human and chimpanzee cortex. Med Image Anal. 2006;10(3):397–412. doi: 10.1016/j.media.2005.03.005. [DOI] [PubMed] [Google Scholar]
- Bermudez P, Zatorre RJ. Sexual dimorphism in the corpus callosum: methodological considerations in MRI morphometry. Neuroimage. 2001;13(6 Pt 1):1121–1130. doi: 10.1006/nimg.2001.0772. [DOI] [PubMed] [Google Scholar]
- Bigler ED. Distinguished Neuropsychologist Award Lecture 1999. The lesion(s) in traumatic brain injury: implications for clinical neuropsychology. Arch Clin Neuropsychol. 2001a;16(2):95–131. [PubMed] [Google Scholar]
- Bigler ED. Quantitative magnetic resonance imaging in traumatic brain injury. J Head Trauma Rehabil. 2001b;16(2):117–134. doi: 10.1097/00001199-200104000-00003. [DOI] [PubMed] [Google Scholar]
- Bigler ED. Structural imaging. In: Silver JM, McAllister TW, Yudofsky SC, editors. Textbook of traumatic brain injury. Washington DC: American Psychiatric Publishing, Inc.; 2005. pp. 79–105. [Google Scholar]
- Bookstein FL. "Voxel-based morphometry" should not be used with imperfectly registered images. Neuroimage. 2001;14(6):1454–1462. doi: 10.1006/nimg.2001.0770. [DOI] [PubMed] [Google Scholar]
- Brambati SM, Renda NC, Rankin KP, Rosen HJ, Seeley WW, Ashburner J, et al. A tensor based morphometry study of longitudinal gray matter contraction in FTD. Neuroimage. 2007;35(3):998–1003. doi: 10.1016/j.neuroimage.2007.01.028. [DOI] [PMC free article] [PubMed] [Google Scholar]
- Cardenas VA, Studholme C, Gazdzinski S, Durazzo TC, Meyerhoff DJ. Deformation-based morphometry of brain changes in alcohol dependence and abstinence. Neuroimage. 2007;34(3):879–887. doi: 10.1016/j.neuroimage.2006.10.015. [DOI] [PMC free article] [PubMed] [Google Scholar]
- Chau W, McIntosh AR. The Talairach coordinate of a point in the MNI space: how to interpret it. Neuroimage. 2005;25(2):408–416. doi: 10.1016/j.neuroimage.2004.12.007. [DOI] [PubMed] [Google Scholar]
- Chiang MC, Dutton RA, Hayashi KM, Lopez OL, Aizenstein HJ, Toga AW, et al. 3D pattern of brain atrophy in HIV/AIDS visualized using tensor-based morphometry. Neuroimage. 2007;34(1):44–60. doi: 10.1016/j.neuroimage.2006.08.030. [DOI] [PMC free article] [PubMed] [Google Scholar]
- Chung MK, Worsley KJ, Paus T, Cherif C, Collins DL, Giedd JN, et al. A unified statistical approach to deformation-based morphometry. Neuroimage. 2001;14(3):595–606. doi: 10.1006/nimg.2001.0862. [DOI] [PubMed] [Google Scholar]
- Davatzikos C. Why voxel-based morphometric analysis should be used with great caution when characterizing group differences. Neuroimage. 2004;23(1):17–20. doi: 10.1016/j.neuroimage.2004.05.010. [DOI] [PubMed] [Google Scholar]
- Davatzikos C, Genc A, Xu D, Resnick SM. Voxel-based morphometry using the RAVENS maps: methods and validation using simulated longitudinal atrophy. Neuroimage. 2001;14(6):1361–1369. doi: 10.1006/nimg.2001.0937. [DOI] [PubMed] [Google Scholar]
- Davatzikos C, Vaillant M, Resnick SM, Prince JL, Letovsky S, Bryan RN. A computerized approach for morphological analysis of the corpus callosum. J Comput Assist Tomogr. 1996;20(1):88–97. doi: 10.1097/00004728-199601000-00017. [DOI] [PubMed] [Google Scholar]
- Dubb A, Xie Z, Gur R, Gee J. Characterization of brain plasticity in schizophrenia using template deformation. Acad Radiol. 2005;12(1):3–9. doi: 10.1016/j.acra.2004.06.009. [DOI] [PubMed] [Google Scholar]
- Gale SD, Baxter L, Roundy N, Johnson SC. Traumatic brain injury and grey matter concentration: a preliminary voxel based morphometry study. J Neurol Neurosurg Psychiatry. 2005;76(7):984–988. doi: 10.1136/jnnp.2004.036210. [DOI] [PMC free article] [PubMed] [Google Scholar]
- Gaser C, Nenadic I, Buchsbaum BR, Hazlett EA, Buchsbaum MS. Deformation-based morphometry and its relation to conventional volumetry of brain lateral ventricles in MRI. Neuroimage. 2001;13(6 Pt 1):1140–1145. doi: 10.1006/nimg.2001.0771. [DOI] [PubMed] [Google Scholar]
- Gaser C, Volz HP, Kiebel S, Riehemann S, Sauer H. Detecting structural changes in whole brain based on nonlinear deformations-application to schizophrenia research. Neuroimage. 1999;10(2):107–113. doi: 10.1006/nimg.1999.0458. [DOI] [PubMed] [Google Scholar]
- Gennarelli TA, Graham DI. Neuropathology. In: Silver JM, McAllister TW, Yudofsky SC, editors. Textbook of traumatic brain injury. Washington DC: American Psychiatric Publishing, Inc.; 2005. pp. 27–50. [Google Scholar]
- Genovese CR, Lazar NA, Nichols T. Thresholding of statistical maps in functional neuroimaging using the false discovery rate. Neuroimage. 2002;15(4):870–878. doi: 10.1006/nimg.2001.1037. [DOI] [PubMed] [Google Scholar]
- Goldman-Rakic PS, Porrino LJ. The primate mediodorsal (MD) nucleus and its projection to the frontal lobe. J Comp Neurol. 1985;242(4):535–560. doi: 10.1002/cne.902420406. [DOI] [PubMed] [Google Scholar]
- Good CD, Johnsrude IS, Ashburner J, Henson RN, Friston KJ, Frackowiak RS. A voxel-based morphometric study of ageing in 465 normal adult human brains. Neuroimage. 2001;14(1 Pt 1):21–36. doi: 10.1006/nimg.2001.0786. [DOI] [PubMed] [Google Scholar]
- Graham DI, Maxwell WL, Adams JH, Jennett B. Novel aspects of the neuropathology of the vegetative state after blunt head injury. Prog Brain Res. 2005;150:445–455. doi: 10.1016/S0079-6123(05)50031-1. [DOI] [PubMed] [Google Scholar]
- Jacobs HE. The Los Angeles Head Injury Survey: procedures and initial findings. Arch Phys Med Rehabil. 1988;69(6):425–431. [PubMed] [Google Scholar]
- Kinney HC, Samuels MA. Neuropathology of the persistent vegetative state. A review. J Neuropathol Exp Neurol. 1994;53(6):548–558. doi: 10.1097/00005072-199411000-00002. [DOI] [PubMed] [Google Scholar]
- Kochunov P, Lancaster J, Hardies J, Thompson PM, Woods RP, Cody JD, et al. Mapping structural differences of the corpus callosum in individuals with 18q deletions using targetless regional spatial normalization. Hum Brain Mapp. 2005;24(4):325–331. doi: 10.1002/hbm.20090. [DOI] [PMC free article] [PubMed] [Google Scholar]
- Kochunov P, Lancaster JL, Thompson P, Woods R, Mazziotta J, Hardies J, et al. Regional spatial normalization: toward an optimal target. J Comput Assist Tomogr. 2001;25(5):805–816. doi: 10.1097/00004728-200109000-00023. [DOI] [PubMed] [Google Scholar]
- Lancaster JL, Woldorff MG, Parsons LM, Liotti M, Freitas CS, Rainey L, et al. Automated Talairach atlas labels for functional brain mapping. Hum Brain Mapp. 2000;10(3):120–131. doi: 10.1002/1097-0193(200007)10:3<120::AID-HBM30>3.0.CO;2-8. [DOI] [PMC free article] [PubMed] [Google Scholar]
- Lee AD, Leow AD, Lu A, Reiss AL, Hall S, Chiang MC, et al. 3D pattern of brain abnormalities in Fragile X syndrome visualized using tensor-based morphometry. Neuroimage. 2007;34(3):924–938. doi: 10.1016/j.neuroimage.2006.09.043. [DOI] [PMC free article] [PubMed] [Google Scholar]
- Leow AD, Klunder AD, Jack CR, Jr., Toga AW, Dale AM, Bernstein MA, et al. Longitudinal stability of MRI for mapping brain change using tensor-based morphometry. Neuroimage. 2006;31(2):627–640. doi: 10.1016/j.neuroimage.2005.12.013. [DOI] [PMC free article] [PubMed] [Google Scholar]
- Levine B, Fujiwara E, O'Connor C, Richard N, Kovacevic N, Mandic M, et al. In vivo characterization of traumatic brain injury neuropathology with structural and functional neuroimaging. J Neurotrauma. 2006;23(10):1396–1411. doi: 10.1089/neu.2006.23.1396. [DOI] [PMC free article] [PubMed] [Google Scholar]
- Levine B, Katz D, Dade L, Black S. Novel approaches to assessment of frontal damage and executive deficits in traumatic brain injury. In: Stuss DT, Knight RT, editors. Principles of frontal lobe function. New York: Oxford University Press; 2002. pp. 448–465. [Google Scholar]
- Mai JK, Assheuer JK, Paxinos G. Atlas of the human brain. 2nd ed. San Diego: Academic Press; 2004. [Google Scholar]
- Max W, Rice DP, MacKenzie EJ. The lifetime cost of injury. Inquiry. 1990;27(4):332–343. [PubMed] [Google Scholar]
- McKinlay WW, Brooks DN, Bond MR, Martinage DP, Marshall MM. The short-term outcome of severe blunt head injury as reported by relatives of the injured persons. J Neurol Neurosurg Psychiatry. 1981;44(6):527–533. doi: 10.1136/jnnp.44.6.527. [DOI] [PMC free article] [PubMed] [Google Scholar]
- Mendez CV, Hurley RA, Lassonde M, Zhang L, Taber KH. Mild traumatic brain injury: neuroimaging of sports-related concussion. J Neuropsychiatry Clin Neurosci. 2005;17(3):297–303. doi: 10.1176/jnp.17.3.297. [DOI] [PubMed] [Google Scholar]
- Miller MI. Computational anatomy: shape, growth, and atrophy comparison via diffeomorphisms. Neuroimage. 2004;23 Suppl 1:S19–S33. doi: 10.1016/j.neuroimage.2004.07.021. [DOI] [PubMed] [Google Scholar]
- Miller MI, Trouve A, Younes L. On the metrics and euler-lagrange equations of computational anatomy. Annu Rev Biomed Eng. 2002;4:375–405. doi: 10.1146/annurev.bioeng.4.092101.125733. [DOI] [PubMed] [Google Scholar]
- Oldfield RC. The assessment and analysis of handedness: the Edinburgh inventory. Neuropsychologia. 1971;9(1):97–113. doi: 10.1016/0028-3932(71)90067-4. [DOI] [PubMed] [Google Scholar]
- Ponsford J, Kinsella G. Attentional deficits following closed-head injury. J Clin Exp Neuropsychol. 1992;14(5):822–838. doi: 10.1080/01688639208402865. [DOI] [PubMed] [Google Scholar]
- Romanski LM, Giguere M, Bates JF, Goldman-Rakic PS. Topographic organization of medial pulvinar connections with the prefrontal cortex in the rhesus monkey. J Comp Neurol. 1997;379(3):313–332. [PubMed] [Google Scholar]
- Rutland-Brown W, Langlois JA, Thomas KE, Xi YL. Incidence of traumatic brain injury in the United States, 2003. J Head Trauma Rehabil. 2006;21(6):544–548. doi: 10.1097/00001199-200611000-00009. [DOI] [PubMed] [Google Scholar]
- Salmond CH, Chatfield DA, Menon DK, Pickard JD, Sahakian BJ. Cognitive sequelae of head injury: involvement of basal forebrain and associated structures. Brain. 2005;128(Pt 1):189–200. doi: 10.1093/brain/awh352. [DOI] [PubMed] [Google Scholar]
- Senjem ML, Gunter JL, Shiung MM, Petersen RC, Jack CR., Jr. Comparison of different methodological implementations of voxel-based morphometry in neurodegenerative disease. Neuroimage. 2005;26(2):600–608. doi: 10.1016/j.neuroimage.2005.02.005. [DOI] [PMC free article] [PubMed] [Google Scholar]
- Studholme C, Cardenas V, Blumenfeld R, Schuff N, Rosen HJ, Miller B, et al. Deformation tensor morphometry of semantic dementia with quantitative validation. Neuroimage. 2004;21(4):1387–1398. doi: 10.1016/j.neuroimage.2003.12.009. [DOI] [PubMed] [Google Scholar]
- Talairach J, Trounoux P. Co-planar stereotaxic atlas of the human brain. New York: Thieme Medical Publishers; 1988. [Google Scholar]
- Thirion JP. Image matching as a diffusion process: an analogy with Maxwell's demons. Med Image Anal. 1998;2(3):243–260. doi: 10.1016/s1361-8415(98)80022-4. [DOI] [PubMed] [Google Scholar]
- Thompson PM, Giedd JN, Woods RP, MacDonald D, Evans AC, Toga AW. Growth patterns in the developing brain detected by using continuum mechanical tensor maps. Nature. 2000;404(6774):190–193. doi: 10.1038/35004593. [DOI] [PubMed] [Google Scholar]
- Thomsen IV. Late outcome of very severe blunt head trauma: a 10–15 year second follow-up. J Neurol Neurosurg Psychiatry. 1984;47(3):260–268. doi: 10.1136/jnnp.47.3.260. [DOI] [PMC free article] [PubMed] [Google Scholar]
- Thurman DJ, Alverson C, Dunn KA, Guerrero J, Sniezek JE. Traumatic brain injury in the United States: A public health perspective. J Head Trauma Rehabil. 1999;14(6):602–615. doi: 10.1097/00001199-199912000-00009. [DOI] [PubMed] [Google Scholar]
- Tisserand DJ, Pruessner JC, Sanz Arigita EJ, van Boxtel MP, Evans AC, Jolles J, et al. Regional frontal cortical volumes decrease differentially in aging: an MRI study to compare volumetric approaches and voxel-based morphometry. Neuroimage. 2002;17(2):657–669. [PubMed] [Google Scholar]
- Tomaiuolo F, Worsley KJ, Lerch J, Di Paola M, Carlesimo GA, Bonanni R, et al. Changes in white matter in long-term survivors of severe non-missile traumatic brain injury: a computational analysis of magnetic resonance images. J Neurotrauma. 2005;22(1):76–82. doi: 10.1089/neu.2005.22.76. [DOI] [PubMed] [Google Scholar]
- Van Essen DC, Lewis JW, Drury HA, Hadjikhani N, Tootell RB, Bakircioglu M, et al. Mapping visual cortex in monkeys and humans using surface-based atlases. Vision Res. 2001;41(10–11):1359–1378. doi: 10.1016/s0042-6989(01)00045-1. [DOI] [PubMed] [Google Scholar]
- Woods RP. Characterizing volume and surface deformations in an atlas framework: theory, applications, and implementation. Neuroimage. 2003;18(3):769–788. doi: 10.1016/s1053-8119(03)00019-3. [DOI] [PubMed] [Google Scholar]
- Yoo T. Insight into images: Principles and practices for segmentation, registration, and image analysis. Wellesey, MA: A K Peters, Ltd.; 2003. [Google Scholar]
- Yushkevich PA, Piven J, Hazlett HC, Smith RG, Ho S, Gee JC, et al. User-guided 3D active contour segmentation of anatomical structures: significantly improved efficiency and reliability. Neuroimage. 2006;31(3):1116–1128. doi: 10.1016/j.neuroimage.2006.01.015. [DOI] [PubMed] [Google Scholar]
- Zhang L, Yang KH, King AI. A proposed injury threshold for mild traumatic brain injury. J Biomech Eng. 2004;126(2):226–236. doi: 10.1115/1.1691446. [DOI] [PubMed] [Google Scholar]