

Abstract
Protein aggregation is commonly observed during protein refolding. To better understand this phenomenon, the intermolecular interactions experienced by a protein during unfolding and refolding are inferred from second virial coefficient (SVC) measurements. It is accepted that a negative SVC is indicative of protein–protein interactions that are attractive, whereas a positive SVC indicates net repulsive interactions. Lysozyme denatured and reduced in guanidinium hydrochloride exhibited a decreasing SVC as the denaturant was diluted, and the SVC approached zero at approximately 3 M GdnHCl. Further dilution of denaturant to renaturation conditions (1.25 M GdnHCl) led to a negative SVC, and significant protein aggregation was observed. The inclusion of 500 mM L-arginine in the renaturation buffer shifted the SVC to positive and suppressed aggregation, thereby increasing refolding yield. The formation of mixed disulfides in the denatured state prior to refolding also increased protein solubility and suppressed aggregation, even without the use of L-arginine. Again, the suppression of aggregation was shown to be caused by a shift from attractive to repulsive intermolecular interactions as reflected in a shift from a negative to a positive SVC value. To the best of our knowledge, this is the first time that SVC data have been reported for renaturation studies. We believe this technique will aid in our understanding of how certain conditions promote renaturation and increase protein solubility, thereby suppressing aggregation. SVC measurements provide a useful link, for protein folding and aggregation, between empirical observation and thermodynamics.
Keywords: Second virial coefficient, aggregation, refolding, light scattering, denaturant
Knowledge of the interactions between protein molecules and other solutes, such as ions and other macromolecules, is essential if we are to fundamentally understand the behavior of proteins both in vitro and in vivo. These interactions determine whether an individual protein molecule will remain as a monomer, become unfolded, or associate with other proteins to form either active complexes or biologically inactive aggregates. A detailed understanding of protein interactions would enable a fundamental understanding of in vitro protein aggregation processes, and also has the potential to increase our understanding of the molecular processes leading to aggregation-related disease states.
Osmotic second virial coefficients provide a thermodynamic link between molecular structure and the potential of attraction between proteins at various solution conditions (Curtis et al. 1998, 2001a). Second virial coefficient (SVC) measurements have been used to assess and partially explain the likelihood of protein crystallization (George and Wilson 1994; George et al. 1997), and have also been used to model and understand protein precipitation conditions (Curtis et al. 1998, 2001a,b). A theoretical and experimental link between solubility and the SVC has been established (Rosenbaum and Zukoski 1996; George et al. 1997; Haas et al. 1999; Ruppert et al. 2001), and the SVC has been related to the various forces, including ionic and van der Waals, that drive interactions (Curtis et al. 1998; Neal et al. 1999). Qualitatively, a positive SVC value indicates that repulsive interactions between protein molecules dominate, so that protein–solvent interactions are favored over those between solute molecules. As attractive interactions between protein molecules strengthen, the potential of intermolecular interaction becomes attractive and the SVC becomes negative (George and Wilson 1994; Neal et al. 1999). In some cases this attractive interaction, reflected in a negative SVC value, will result in the nucleation and subsequent aggregation of protein molecules. In general, the occurrence of macroscopic aggregation at an observable rate will be favored by attractive interactions (a negative SVC), a sufficiently small intermolecular distance (a high concentration), and an irreversible nucleation-growth process.
Static light scattering (SLS) is routinely used to determine SVCs. Proteins in solution scatter radiation in the Rayleigh region (Wyatt 1993), and measurement of the excess scattering in dilute polymer solutions enables the SVC to be determined from Equation 1.
 |
1 |
In Equation 1, Rex is the excess Rayleigh ratio (in cm−1) that can be determined from SLS experiments using commercial instruments, c is the protein concentration (in grams per cubic centimeter), M is molecular weight (in grams per mole), SVC is the second virial coefficient (in milliliters per mole per gram squared), and the optical constant, K (in milliliters mole per gram squared per centimeter), is given by Equation 2 :
 |
2 |
In Equation 2, no is the solution refractive index, ∂n/∂c is the specific refractive index increment (in cubic centimeters per gram), λ is the wavelength of the incident light (in centimeters), and NA is Avogadro’s number (in mole−1). Application of this technique is possible when aggregation does not occur, so that c is known precisely.
An increasing need for the efficient production of genetically engineered proteins presents a growing optimization challenge of converting inactive and misfolded inclusion-body proteins into soluble bioactive products (Clark 1998; Lilie et al. 1998; Misawa and Kumagai 1999). Upon in vitro renaturation after inclusion body solubilization, it is frequently observed that the yield of correctly renatured proteins is highly concentration-dependent. The formation of incorrectly folded species and aggregates causes decreased renaturation yields (Goldberg et al. 1991; Kiefhaber et al. 1991). Protein concentration is believed to be the predominant factor governing aggregation (Hevehan and Clark 1997), and it should therefore be maintained below the solubility limit to prevent nucleation. Knowledge of protein solubility under the solvent conditions suitable for protein refolding would be valuable in optimizing a refolding protocol to increase or even maximize yield.
In this paper, we demonstrate that SVC measurements can be used to predict the likelihood of aggregation during protein renaturation. We also demonstrate that certain solution conditions inhibit aggregation during renaturation, and that these conditions change the intermolecular potentials and hence the SVC such that repulsive interactions are favored over those driving aggregation. To the best of our knowledge, this represents the first attempt to measure the protein–protein interactions, quantified as second virial coefficients, that a protein experiences during unfolding and refolding.
Results
Solubility during protein unfolding
Denaturants, such as guanidine hydrochloride (GdnHCl), alter the solubility and structure of proteins. Denaturants increase the solubility of polar molecules by hydrogen bonding and by altering water structure (Roseman and Jencks 1975; Makhatadze and Privalov 1992). These protein–solvent and solvent–solvent interactions can be probed by measuring protein–protein interactions. In Figure 1 ▶, starting from native protein, the second virial coefficient (SVC) is graphed against increasing denaturant concentration. The measured SVC decreases with increasing denaturant concentration. It has been established that a decrease in overall system repulsion results in a decrease in SVC (George and Wilson 1994; Neal et al. 1999), thus the result in Figure 1 ▶ indicates that the repulsion between protein molecules decreases with increasing denaturant concentration when starting with native protein. As the protein unfolds, more aggregative or hydrophobic regions of the protein, which are normally buried internally, become exposed. This increases the protein–protein attraction in the solution, thereby decreasing the overall repulsion in the system to cause SVC to decrease.
Figure 1.

Second virial coefficient (SVC) as a function of guanidinium hydrochloride concentration for native lysozyme added to buffer (GdnHCl, 50 mM Tris at pH 8.0) containing either no DTT or 32 mM DTT.
The native structure of some proteins is further stabilized in solution by internal disulfide bonds. To fully denature a protein with disulfide bonds, a reducing agent, such as dithiothreitol (DTT), can be used in combination with denaturant to break these covalent bonds, giving a fully denatured and reduced structure. A different dependence of SVC on denaturant concentration is obtained in the presence of DTT (Fig. 1 ▶). Increasing the GdnHCl concentration leads to a decrease and then an increase in SVC and hence protein solubility. This behavior is of interest as GdnHCl and DTT are common agents used during protein refolding, and this behavior affects our understanding of the molecular forces that drive protein aggregation and refolding, as discussed below. Our recent studies confirm that SVC shows the same dependencies on DTT and denaturant concentration when urea is used in place of GdnHCl. The result is not denaturant-specific.
The minimum in SVC and hence protein solubility, observed in Figure 1 ▶, arises from a coupling between aggregation behavior and the folding |Zu unfolding equilibrium. Increasing the denaturant concentration has two effects: It (1) denatures the protein, increasing the concentration of aggregation prone molecules in solution, but at the same time, it (2) weakens protein–protein attractions, by increasing protein–denaturant and denaturant–water interactions, reducing the effective protein “hydrophobicity.” The denaturation process is the dominant factor at low denaturant concentrations, whereas solubility is increased at high denaturant concentrations because of (2). The observed minimum is the crossover point between these two competing effects. This minimum appears to occur at around the midpoint of protein denaturation reported for lysozyme by Greene and Pace (1974). This solubility minimum has been previously observed by De Young and co-workers (1993) for apomyoglobin in urea and theoretically explained using mean field theory by Stigter and Dill (1993).
Solubility during dilution from the denatured-reduced state
The competing effects of denaturant displayed in Figure 1 ▶ may be used to explain aspects of aggregation during the protein refolding process. In Figure 2 ▶, starting from the fully denatured and reduced state, the measured virial coefficient as a function of GdnHCl concentration indicates a decrease in overall system repulsion with decreasing denaturant concentration. At an intermediate GdnHCl concentration (<3 M GdnHCl), the virial coefficient extrapolates to become negative, indicating that attractive interactions will begin to dominate. This will increase the likelihood of protein aggregation if the GdnHCl concentration is further reduced in an attempt to refold the protein. Aggregation was indeed observed at GdnHCl concentrations <3 M, preventing SVC measurement.
Figure 2.

Second virial coefficient as a function of guanidinium hydrochloride concentration for denatured-reduced lysozyme diluted with buffer (GdnHCl, 50 mM Tris at pH 8.0, 32 mM DTT).
The denaturant acts as a barrier to aggregation during protein refolding, because of the chaotropic effect of the denaturant and protein–denaturant interactions. However, as the denaturant concentration is reduced, this “denaturant” barrier to aggregation is reduced, hence reducing the measured repulsion between proteins. Assuming the observed interaction trends are correct, the aggregative intermediates enter a chemical environment where there is insufficient denaturant in solution to prevent aggregation, and attractive interactions therefore dominate. The denaturant concentration may be too low to prevent aggregation, but sufficient to hamper complete renaturation.
Oxidative refolding with GSSG
A chemical condition that has been previously reported for successful lysozyme refolding uses 1.25 M GdnHCl and 6 mM GSSG (Hevehan and Clark 1997). Denatured-reduced lysozyme was diluted with buffer to give a final composition of 1.25 M GdnHCl, 50 mM Tris (pH 8.0), 6 mM GSSG, and 5 mM DTT, and the virial coefficient was determined using Equation 3 (Materials and Methods). As seen in Figure 3 ▶, these conditions yielded a light-scattering plot having a negative gradient and hence a negative SVC from Equation 1, indicating that attractive forces dominate. Sensitivity to protein concentration, and therefore low solubility, was confirmed by measuring the turbidity of the refolding protein solution at two final concentrations (1 mg/mL and 3 mg/mL; Fig. 4 ▶). Aggregation began to occur within 1 h of dilution for the protein solution at 3 mg/mL, whereas there was still no measurable turbidity after 50 h for the solution at 1 mg/mL. As stated above, aggregation at an appreciable rate is favored by attractive interactions and a high protein concentration, and SVC values can only be determined in the absence of significant aggregation. This extended solubility at low concentration enabled determination of the SVC plot presented in Figure 3 ▶. The lack of turbidity at 1 mg/mL agrees with the results reported by Hevehan and Clark (1997), which assert that at this protein concentration the aggregation kinetics are suppressed by the presence of 1.25 M GdnHCl. Figure 5A ▶ shows the diffusion coefficient plot for native lysozyme in buffer, measured using dynamic light scattering. Figure 5B ▶ shows the corresponding plot for the 1-mg/mL renaturation case. The similarity of these two distributions confirms the absence of significant aggregation, indicating that 1 mg/mL is below the critical protein concentration for aggregation.
Figure 3.

Kc/Rex from Equation 1 versus protein concentration for denatured and reduced lysozyme in renaturation buffer (final composition: 1.25 M GdnHCl, 6 mM GSSG, 5 mM DTT, 50 mM Tris at pH 8.0) with either no L-arginine or with 500 mM L-arginine. The gradient gives the second virial coefficient, which changes from negative (attractive) to positive (repulsive) in the presence of 500 mM L-arginine.
Figure 4.

Turbidity versus time for denatured and reduced lysozyme added to renaturation buffer (final composition: 1.25 GdnHCl, 6 mM GSSG, 5 mM DTT, 50 mM Tris at pH 8.0) at a final protein concentration of 1 mg/mL or 3 mg/mL. Turbidity at 3 mg/mL decreases at extended times because of the sedimentation of aggregates.
Figure 5.
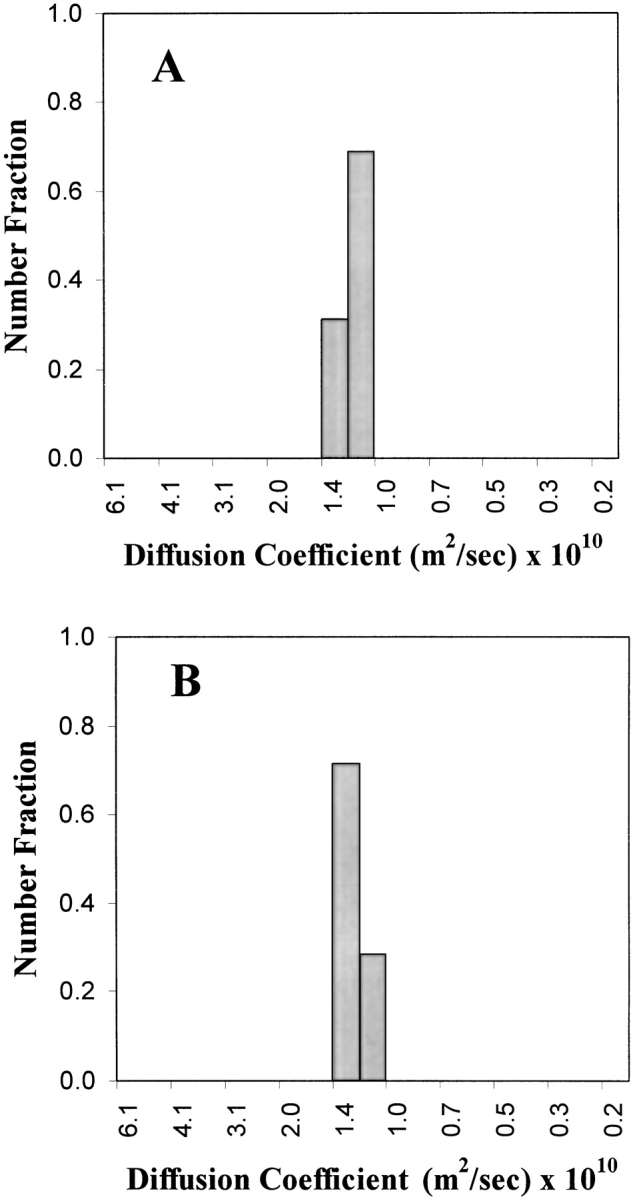
Diffusion coefficients for (A) native lysozyme (1 mg/mL) in 50 mM Tris (pH 8.0), and for (B) lysozyme renatured in buffer (final composition: 1.25 GdnHCl, 6 mM GSSG, 5 mM DTT, 50 mM Tris at pH 8.0) at a final protein concentration of 1 mg/mL.
Protein solubility can be changed by controlling the environment in which a protein folds. Low-molecular-weight additives, such as L-arginine, have been suggested to enhance renaturation yields by inhibiting intermolecular hydrophobic interactions that lead to precipitation (Clark et al. 1999). The virial coefficient was measured for denatured-reduced lysozyme refolding in the same buffer used above, but with the addition of 0.5 M L-arginine. As seen in Figure 3 ▶ and Table 1, the gradient of the plot and hence the measured SVC shifts from negative to positive. Protein–protein attractions have been inhibited by the addition of L-arginine to the renaturation buffer. The inhibition of aggregation is confirmed in Figure 6 ▶, where turbidity and recovered activity are compared for refolding at 3 mg/mL in the presence or absence of L-arginine. The addition of L-arginine suppressed aggregation as assessed by turbidity, and this suppression increased the fractional recovered activity from ~45% to ~70%. This shift from a negative to a positive second virial coefficient in the presence of L-arginine reflects an increase in protein solubility that prevents aggregation. To our knowledge, this is the first quantification of the impact of L-arginine on aggregation propensity, as assessed by the SVC. This result provides direct proof of the empirical suggestion that L-arginine suppresses aggregation by increasing protein solubility.
Table 1.
The measured second virial coefficient and recovered activity after 50 h
| Starting sample | L-arginine addition | Turbidity after 50 h | SVC (mL mole/g2) × 103 | Recovered activity (%) |
| Denatured-reduced | − | + | −1.97 ± 0.51 | 46 ± 1 |
| Denatured-reduced | + | − | 0.71 ± 0.61 | 67 ± 1 |
| Mixed disulfide | − | − | 1.71 ± 0.76 | 59 ± 1 |
| Mixed disulfide | + | − | 4.76 ± 1.02 | 55 ± 1 |
The “denatured-reduced” tests involved the renaturation of denatured-reduced lysozyme in buffer (final composition: 1.25 M GdnHCl, 6 mM GSSG, 5 mM DTT, 50 mM Tris at pH 8.0). The “mixed disulfide” tests involved preoxidation of the denatured protein using GSSG as described in Materials and Methods. In both cases, tests were conducted with (+) or without (−) 500 mM L-arginine. Protein concentrations ranging from 0.2 to 3.0 mg/mL were used to determine each SVC value (e.g., as in Fig. 3 ▶).
Figure 6.

Turbidity and refolding yield versus time for the renaturation of denatured-reduced lysozyme in buffer (1.25 M GdnHCl, 6 mM GSSG, 5 mM DTT, 50 mM Tris at pH 8.0) containing either 500 mM L-arginine or no L-arginine. Turbidity in the absence of arginine decreases at extended times because of the sedimentation of aggregates.
Oxidative refolding in the absence of GSSG
The importance of including a disulfide component in the renaturation buffer for oxidative refolding is demonstrated in Figure 7 ▶. Without GSSG to provide an oxidized disulfide component for protein disulfide formation, the recovered activity was ~10%. The only mechanism for protein disulfide formation was air oxidation, which is slow because of mass transfer limitations. The rate and yield of correct disulfide bond formation by air oxidation are known to be generally low (Rudolph and Lilie 1996), thus this result is unsurprising. However, the corresponding turbidity measurements show some interesting trends. For the case without GSSG (Fig. 7 ▶), solution turbidity was not detected until 24 h after initial dilution, indicating that aggregation may have been enhanced by slow air oxidation of the protein thiol groups. Early aggregation events have been shown to be in equilibrium with monomeric protein for bovine carbonic-anhydrase (Cleland and Wang 1991), enabling disassociation of nuclei unless a critical size is reached. Even though individual protein molecules are constantly interacting with each other, the molecular collisions do not necessarily initiate an irreversible nucleation event. This reversibility of nucleation may be inhibited when the environment becomes oxidative and intermolecular disulfide-bond formation is possible. In our tests, SDS-PAGE analysis under reducing and nonreducing conditions confirmed the presence of dimers and trimers that were stabilized by intermolecular disulfide bonds (data not shown). Interestingly, in the absence of GSSG, L-arginine inhibited but did not completely suppress aggregation (Fig. 7 ▶). It must also be noted that aggregation is unlikely to be due entirely to intermolecular disulfide bonds; Goldberg et al. (1991) showed that the aggregation of lysozyme is a nonspecific phenomenon.
Figure 7.

Turbidity and refolding yield following renaturation of denatured-reduced lysozyme in buffer (final composition: 1.25 M GdnHCl, 5 mM DTT, 50 mM Tris at pH 8.0) lacking GSSG and containing either 500 mM L-arginine or no L-arginine.
Refolding by the prior formation of mixed disulfides
Another method of oxidative protein folding relies on the formation of mixed disulfides on the protein prior to dilution refolding. The introduction of mixed disulfides to the denatured state increases the solubility of the unfolded protein by enhancing the hydrophilic character of the unfolded polypeptide chain (Rudolph 1990). Disulfide-bond formation within the protein is triggered after dilution into buffer containing a low concentration of reducing agent. As seen in Figure 8 ▶, dilution from the mixed-disulfide state prevented aggregation as assessed by turbidity. Protein solubility increased and protein–protein attraction decreased, as assessed by second virial coefficient measurements (Table 1). Even in the absence of L-arginine, the SVC was positive for the mixed-disulfide case, providing evidence that dilution from the mixed-disulfide state decreases the strength of the protein–protein attraction. Interestingly, the complete suppression of aggregation using mixed disulfides does not lead to the same yield as that obtained for denatured-reduced protein diluted into buffer containing L-arginine (Table 1). From the denatured-reduced state, a yield of 67% was achieved when aggregation was suppressed by the inclusion of L-arginine in the renaturation buffer. Aggregation suppression by the use of mixed disulfides gave a lower yield (59% maximum), suggesting that something other than aggregation was decreasing yield.
Figure 8.

Turbidity and refolding yield for denatured lysozyme with preformed mixed disulfides renatured in buffer (final composition: 1.25 M GdnHCl, 6 mM GSSG, 2 mM DTT, 50 mM Tris at pH 8.0) containing either 500 mM L-arginine or no L-arginine.
It is known that, apart from aggregation, yields are strongly dependent on the redox environment during renaturation (Lyles and Gilbert 1991; Hevehan and Clark 1997). Clearly, aggregation is an important factor contributing to decreased protein yield, but it is not the only factor. Misfolded proteins, especially when disulfide bonds are present, can contribute greatly to yield reduction. Goldberg and coworkers (Roux et al. 1999) have reported that 20%–30% of lysozyme molecules during oxidative renaturation are misfolded to inactive protein. The maximum renaturation yield of ~67% reported in this paper is consistent with their study, and indicates that the redox conditions we selected provided an adequate refolding environment from the reduced-denatured state. However, no optimization of redox environment has been done for the mixed-disulfides study in this work, and it is therefore likely that the reduced yield we report in Table 1 (59% vs. 67%) is caused by an increase in misfolded and inactive monomer. Subsequent work will need to directly prove this suggestion by determination of the distribution of disulfide isomers in the renaturation solution.
Discussion
Chemical equilibrium
The second virial coefficient is derived from osmotic pressure, which is a measured physical property of a solution at chemical equilibrium. This presents the greatest challenge in using the SVC to probe or measure protein–protein interactions. If the measured solution conditions are at thermodynamic equilibrium, then SVC measurement is possible; macroscopic aggregation is generally not a reversible process, and consequently SVC measurement is limited to refolding conditions in which aggregation is suppressed. The case least likely to be in equilibrium in this study is that presented in Figure 3 ▶—the protein interactions are attractive, and thus equilibrium assumptions may not be valid. However, Figures 4 ▶ and 5 ▶ indicate no aggregation over an extended period of time, and consequently a quasi-equilibrium assumption is valid.
A strong dependence of aggregation on protein concentration is demonstrated in Figure 4 ▶, even though the net potential of interaction is attractive at both 1 mg/mL and 3 mg/mL. Active protein can be successfully recovered without aggregation at a renaturation concentration of 1 mg/mL despite the net attraction between proteins. This demonstrates that the second virial coefficient is a thermodynamic parameter that does not simplistically predict whether an actual scenario (e.g., aggregation) will occur. The net interaction potential must be related to a phase diagram for the system using statistical mechanics, and an estimate of the rate at which a given process occurs must also be made. Nevertheless, at 3 mg/mL the phase boundary for aggregation has clearly been crossed, as the intermolecular distance is sufficiently small to permit aggregation under the solution conditions investigated.
Renaturation at high protein concentration
When intra- and intermolecular interactions driving protein refolding are not correctly balanced, aggregation will occur during the renaturation process. Aggregation may be minimized by renaturation at low protein concentrations (0.01–0.2 mg/mL); however, this is not a cost-effective refolding strategy at industrial scale. Although the driving forces for refolding are qualitatively understood at a molecular level, detailed understanding of the aggregation process is presently lacking. Optimizing the refolding of a given protein often involves an empirical screening of chemical environments. This is in part owing to the lack of understanding of the competition between folding and aggregation, and therefore protein solubility during refolding.
The impact of solubility, and the importance of understanding and quantifying solubility through SVC measurement, is demonstrated throughout this study. Two routes of protein refolding were investigated, as summarized in Figure 9 ▶. An aggregation-prone route begins with denatured and reduced protein that is refolded through chemical or air oxidation. A less aggregative route uses oxidized glutathione to create mixed disulfides from the denatured-reduced protein, prior to renaturation in buffer containing reducing agent. Oxidation prior to dilution refolding increases protein solubility as shown by the measured second virial coefficients in Table 1. This increase in solubility may be caused by the tripeptide of glutathione attached to the oxidized and denatured protein. Whereas cysteine and glycine are neither strongly hydrophobic nor hydrophilic, the third amino acid, glutamate, is highly hydrophilic. This hydrophilicity is transferred to the protein when a mixed-disulfide state is formed.
Figure 9.

Schematic representation of two routes for protein renaturation. Renaturation is possible via an aggregation-prone route by direct dilution from the denatured-reduced state, in the presence of a thiol/disulfide couple. Alternatively, renaturation can occur from a denatured mixed-disulfide state, in which the hydrophilicity of the denatured protein chains is increased by the addition of glutathione to the polypeptide prior to dilution. Glutathione is the tripeptide of glutamate–cysteine–glycine.
Solubility may be maintained in the aggregation-prone route by the inclusion of L-arginine in the refolding buffer, and this increase in solubility is shown to be caused by a reduction in attractive protein–protein interactions as assessed by SVC measurements (Table 1). It has been suggested that L-arginine increases solubility through the guanidinio group in this additive (Clark et al. 1999); similar to guanidine, L-arginine protects hydrophobic regions on the unfolded and partially folded molecules, which would normally interact with each other to form aggregates (Hevehan and Clark 1997). Aggregation occurs when either air or GSSG is used as the oxidant in the refolding buffer, and aggregate stabilization is through disulfide bonding. Overall yield is also sensitive to the formation of misfolded isomers when the redox environment has not been optimized.
Conclusions
It has been widely recognized that the relative stabilities of the native protein, correctly folded intermediates, misfolded monomers, and higher-order aggregates depend on the renaturation environment. Empirically, certain additives such as L-arginine have been used to suppress aggregation, as have novel methods of refolding such as the preparation of mixed disulfides in the denatured state. In this paper, we rationalize these empirical observations by presenting a quantitative method for assessing both the sign and the magnitude of protein–protein interactions. We have shown that the addition of L-arginine to renaturation buffer shifts protein interactions from attractive to repulsive, and we have also shown that the use of mixed disulfides increases protein solubility and inhibits aggregation. To the best of our knowledge, this is the first time that such measurements have been reported for renaturation studies. We believe this technique will find utility in studies designed to rationally screen renaturation conditions for new proteins, and will help our understanding of why certain conditions promote renaturation in preference to aggregation. Importantly, this technique provides a link between empirical practice and fundamental thermodynamics.
Materials and methods
Proteins and chemicals
Hen egg-white lysozyme for all experiments was obtained from Fluka (Catalog no. 62971). To determine protein concentration, lysozyme samples (100 μL) were diluted into 0.1 M acetic acid (10 mL), and the concentration of native or denatured-reduced lysozyme was calculated using absorbance at 280 nm and extinction coefficients of 2.63 or 2.37 cm mL/mg, respectively (Saxena and Wetlaufer 1970). Guanidinium hydrochloride (GdnHCl), oxidized glutathione (GSSG), L-arginine, acetic acid, tris(hydroxymethyl) aminomethane (Tris), dithiothreitol (DTT), and Micrococcus lysodeikticus were purchased from Sigma.
Preparation of lysozyme solutions for light scattering
Light-scattering experiments were conducted on samples of lysozyme from two starting states: denatured-reduced or oxidized. Denatured-reduced lysozyme (DRL) stock solution was prepared by incubating native lysozyme (100 mg/mL) in denaturation buffer (8 M GdnHCl, 50 mM Tris, 32 mM DTT at pH 8.0) at room temperature for 2 h. Complete denaturation and reduction were confirmed by activity and HPLC analyses. For specific experiments investigating the effect of denaturant concentration, DRL was diluted with buffer (50 mM Tris, 32 mM DTT at pH 8.0) to give a final denaturant concentration of 2 M, 3 M, 4 M, 5 M, or 7 M while maintaining the same redox environment. At each denaturant concentration, protein solutions were further diluted for light-scattering measurements to protein concentrations ranging from 0.2 to 4.5 mg/mL. Such dilutions maintained the selected chemical environment. The preparation of stock solutions of oxidized lysozyme involved the dissolution of 20 mg/mL lysozyme in nonreducing buffer (50 mM Tris pH 8.0, supplemented with 0 M, 0.5 M, 2 M, 3 M, 5 M, or 7 M GdnHCl). For light-scattering experiments, these solutions were diluted such that only protein concentration was controllably varied. Some tests were also conducted under these same solution conditions, but with the inclusion of 32 mM DTT in the buffer.
Refolding experiments
For all refolding experiments starting with denatured-reduced lysozyme, renaturation buffers were prepared so that chemical conditions after dilution would be 1.25 M GdnHCl, 50 mM Tris (pH 8.0), with or without 500 mM L-arginine and with or without 6 mM oxidized glutathione (GSSG). The reducing agent (DTT) in the initial denatured protein solution was carried into the refolding buffer (to a final concentration of 5 mM), except when specifically removed prior to dilution. Final protein concentrations ranged from 0.2 to 2 mg/mL, depending on the specific experiment. Some refolding experiments were also conducted using lysozyme that had been preoxidized with GSSG. In these tests, DRL (8 M GdnHCl, 32 mM DTT, 50 mM Tris at pH 8.0) was loaded on a PD-10 column (Amersham Biosciences) equilibrated and eluted using 8 M GdnHCl, 50 mM Tris, 6 mM GSSG, pH 8.0 (to remove reducing agent). Protein renaturation was then accomplished by dilution into buffer (50 mM Tris, 2 mM DTT at pH 8.0) with or without the addition of 500 mM L-arginine. Solution turbidity and renaturation yield were routinely monitored, as a function of time, during refolding experiments. Solution turbidity was determined with a UV/VIS spectrometer operating at 600 nm (UV-160A Shimadzu). Recovered lysozyme activity at each time point was measured by dissolving Micrococcus lysodeikticus to a final concentration of 0.15 mg/mL in phosphate buffer at pH 6.2. Then 20 μL of native or renatured lysozyme was mixed with 980 μL of cell suspension, and the turbidity was monitored for 40 sec at 450 nm. The percentage renaturation yield was defined by comparing, at the same total protein concentration, the activity of native and renatured samples. All measurements were made in triplicate.
Light scattering
Static light-scattering measurements to determine Rex in Equation 1 were performed using a light photometer PD2020 flowthrough system with measurement of scattering at 90°. Light-scattering intensity was measured for each protein solution at varying protein concentrations (0.2–3.0 mg/mL), and this was converted to values of Rex using standard equations provided by the instrument manufacturer (Precision Detectors, Inc.) and available in standard textbooks (Chu 1991). Independent validation of the manufacturer’s procedures are available elsewhere (Ho 2003). Samples were filtered with 0.1-μm Anotop syringe filters (Whatman) during injection into the system. All buffers were filtered with 0.02-μm Anotop filter membranes (Whatman) prior to use in the system. A rearrangement of Equation 1 gives the following relationship between Rex and concentration:
 |
3 |
SLS data sets were regressed to give K and SVC subject to the constraint that M equals the known protein molecular weight. From Equation 2, K is proportional to (∂n/∂c)2, which is not known at λ = 800 nm for the solution conditions investigated. Our calculations yielded (∂n/∂c) values consistent with reported values at shorter wavelengths. The use of Equation 3 requires a precise knowledge of c and M, which are only defined in the absence of aggregation. Dynamic light scattering (DLS) was therefore used to confirm the absence of aggregation for those samples where SVC data were obtained. DLS measurements were conducted at room temperature (25°C) with a PDDLS/Batch instrument (Precision Detectors, Inc.) at a fixed angle of 90°. Insoluble components and dust were removed from samples by filtration through 0.1-μm Anotop syringe filters (Whatman) into the sample cell, which was then ultrasonicated in an FS100 ultrasonic bath (Whatman) before measurement. Data were analyzed with the PrecisionDeconvolve software (Precision Detectors, Inc.). A translational diffusional coefficient is the physical parameter measured directly by DLS and is reported in this paper, whereas other parameters (e.g., molecular mass and hydrodynamic radius) rely on assumed models for molecular shape (Schonfeld and Behlke 1998).
Acknowledgments
The financial support provided by Novartis Pharma AG (Basel, Switzerland) is gratefully acknowledged.
The publication costs of this article were defrayed in part by payment of page charges. This article must therefore be hereby marked “advertisement” in accordance with 18 USC section 1734 solely to indicate this fact.
Article and publication are at http://www.proteinscience.org/cgi/doi/10.1110/ps.0233703.
References
- Chu, B. 1991. Laser light scattering: Basic principles and practice, Chap. 2. Academic Press, London.
- Clark, E.D. 1998. Refolding of recombinant proteins. Curr. Opin. Biotechnol. 9 157–163. [DOI] [PubMed] [Google Scholar]
- Clark, E.D., Schwarz, E., and Rudolph, R. 1999. Inhibition of aggregation side reactions during in vitro protein folding. Methods Enzymol. 309 217–237. [DOI] [PubMed] [Google Scholar]
- Cleland, J.L. and Wang, D.I.C. 1991. Equilibrium association of a molten globule intermediate in the refolding of bovine carbonic-anhydrase. ACS Symp. Ser. 470 169–179. [Google Scholar]
- Curtis, R.A., Prausnitz, J.M., and Blanch, H.W. 1998. Protein–protein and protein–salt interactions in aqueous protein solutions containing concentrated electrolytes. Biotechnol. Bioeng. 58 11–21. [DOI] [PubMed] [Google Scholar]
- Curtis, R.A., Blanch, H.W., and Prausnitz, J.M. 2001a. Calculation of phase diagrams for aqueous protein solutions. J. Phys. Chem. B 105 2445–2452. [Google Scholar]
- Curtis, R.A., Newman, J., Blanch, H.W., and Prausnitz, J.M. 2001b. McMillan-Mayer solution thermodynamics for a protein in a mixed solvent. Fluid Phase Equilibr. 192 131–153. [Google Scholar]
- De Young, L.R., Dill, K.A., and Fink, A.L. 1993. Aggregation and denaturation of apomyoglobin in aqueous urea solutions. Biochemistry 32 3877–3886. [DOI] [PubMed] [Google Scholar]
- George, A. and Wilson, W.W. 1994. Predicting protein crystallization from a dilute-solution property. Acta Cryst. D 50 361–365. [DOI] [PubMed] [Google Scholar]
- George, A., Chiang, Y., Guo, B., Arabshahi, A., Cai, Z., and Wilson, W.W. 1997. Second virial coefficient as predictor in protein crystal growth. Methods Enzymol. 276 100–110. [DOI] [PubMed] [Google Scholar]
- Goldberg, M.E., Rudolph, R., and Jaenicke, R. 1991. A kinetic study of the competition between renaturation and aggregation during refolding of denatured-reduced egg white lysozyme. Biochemistry 30 2790–2797. [DOI] [PubMed] [Google Scholar]
- Greene, R.F. and Pace, C.N. 1974. Urea and guanidine hydrochloride denaturation of ribonuclease, lysozyme, α-chymotrypsin, and β-lactoglobulin. J. Biol. Chem. 249 5388–5393. [PubMed] [Google Scholar]
- Haas, C., Drenth, J., and Wilson, W.W. 1999. Relation between the solubility of proteins in aqueous solutions and the second virial coefficient of solution. J. Phys. Chem. B 103 2808–2811. [Google Scholar]
- Hevehan, D.L. and Clark, E.D. 1997. Oxidative renaturation of lysozyme at high concentrations. Biotechnol. Bioeng. 54 221–230. [DOI] [PubMed] [Google Scholar]
- Ho, J.G.S. 2003. “An investigation of protein–protein interactions during renaturation.” Ph.D. thesis, University of Cambridge, UK.
- Kiefhaber, T., Rudolph, R., Kohler, H.H., and Buchner, J. 1991. Protein aggregation in vitro and in vivo—A quantitative model of the kinetic competition between folding and aggregation. Bio/Technology 9 825–829. [DOI] [PubMed] [Google Scholar]
- Lilie, H., Schwarz, E., and Rudolph, R. 1998. Advances in refolding of proteins produced in E. coli. Curr. Opin. Biotechnol. 9 497–501. [DOI] [PubMed] [Google Scholar]
- Lyles, M.M. and Gilbert, H.F. 1991. Catalysis of the oxidative folding of ribonuclease A by protein disulfide isomerase: Dependence of the rate on the composition of the redox buffer. Biochemistry 30 613– 619. [DOI] [PubMed] [Google Scholar]
- Makhatadze, G.I. and Privalov, P.L. 1992. Protein interactions with urea and guanidinium chloride—A calorimetric study. J. Mol. Biol. 226 491–505. [DOI] [PubMed] [Google Scholar]
- Misawa, S. and Kumagai, I. 1999. Refolding of therapeutic proteins produced in Escherichia coli as inclusion bodies. Biopolymers 51 297–307. [DOI] [PubMed] [Google Scholar]
- Neal, B.L., Asthagiri, D., Velev, O.D., Lenhoff, A.M., and Kaler, E.W. 1999. Why is the osmotic second virial coefficient related to protein crystallization? J. Crystal Growth 196 377–387. [Google Scholar]
- Roseman, M. and Jencks, W. 1975. Interactions of urea and other polar compounds in water. J. Am. Chem. Soc. 97 631–640. [Google Scholar]
- Rosenbaum, D.F. and Zukoski, C.F. 1996. Protein interactions and crystallization. J. Crystal Growth 169 752–758. [Google Scholar]
- Roux, P., Ruoppolo, M., Chaffotte, A., and Goldberg, M.E. 1999. Comparison of kinetics of S—S bond, secondary structure, and active site formation during refolding of reduced denatured hen egg white lysozyme. Protein Sci. 8 2751–2760. [DOI] [PMC free article] [PubMed] [Google Scholar]
- Rudolph, R. 1990. Renaturation of recombinant disulfide-bonded proteins from inclusion bodies. In Modern methods in protein and nucleic acid research (ed. H. Tschesche), pp. 149–172. Walter de Gruyter, New York.
- Rudolph, R. and Lilie, H. 1996. In vitro refolding of inclusion body proteins. FASEB J. 10 49–56. [PubMed] [Google Scholar]
- Ruppert, S., Sandler, S.I., and Lenhoff, A.M. 2001. Correlation between the osmotic second virial coefficient and the solubility of proteins. Biotechnol. Prog. 17 182–187. [DOI] [PubMed] [Google Scholar]
- Saxena, V.P. and Wetlaufer, D.B. 1970. Formation of three-dimensional structure in proteins. I. Rapid nonenzymatic reactivation of reduced lysozyme. Biochemistry 9 5015–5022. [DOI] [PubMed] [Google Scholar]
- Schonfeld, H.J. and Behlke, J. 1998. Molecular chaperones and their interactions investigated by analytical ultracentrifugation and other methodologies. Methods Enzymol. 290 269–296. [DOI] [PubMed] [Google Scholar]
- Stigter, D. and Dill, K.A. 1993. Theory for protein solubilities. Fluid Phase Equilibr. 82 237–249. [Google Scholar]
- Wyatt, P.J. 1993. Light-scattering and the absolute characterization of macromolecules. Analyt. Chim. Acta 272 1–40. [Google Scholar]