

Abstract
Galactose mutarotase catalyzes the first step in normal galactose metabolism by catalyzing the conversion of β-d-galactose to α-d-galactose. The structure of the enzyme from Lactococcus lactis was recently solved in this laboratory and shown to be topologically similar to domain 5 of β-galactosidase. From this initial X-ray analysis, four amino acid residues were demonstrated to be intimately involved in sugar binding to the protein: His 96, His 170, Asp 243, and Glu 304. Here we present a combined X-ray crystallographic and kinetic analysis designed to examine the role of these residues in the reaction mechanism of the enzyme. For this investigation, the following site-directed mutant proteins were prepared: H96N, H170N, D243N, D243A, E304Q, and E304A. All of the structures of these proteins, complexed with either glucose or galactose, were solved to a nominal resolution of 1.95 Å or better, and their kinetic parameters were measured against d-galactose, d-glucose, l-arabinose, or d-xylose. From these studies, it can be concluded that Glu 304 and His 170 are critical for catalysis and that His 96 and Asp 243 are important for proper substrate positioning within the active site. Specifically, Glu 304 serves as the active site base to initiate the reaction by removing the proton from the C-1 hydroxyl group of the sugar substrate and His 170 functions as the active site acid to protonate the C-5 ring oxygen.
Keywords: Protein structure, galactose mutarotase, Leloir pathway, catalytic mechanism
Galactose mutarotase plays a key role in normal galactose metabolism by catalyzing the first step in the Leloir pathway, namely the conversion of β-d-galactose to α-d-galactose (Bouffard et al. 1994). The enzyme from Lactococcus lactis was recently cloned, overexpressed, and targeted for both structural and kinetic analyses (Thoden and Holden 2002; Thoden et al. 2002). From these initial studies, the overall architecture of the enzyme was revealed and the manner in which galactose binds in the active site was defined. Each monomer of the dimeric enzyme is dominated by extensive layers of β-sheet and, despite the lack of any significant amino acid sequence identity, is topologically similar to domain 5 of β-galactosidase (Jacobson et al. 1994), copper amine oxidase (Parsons et al. 1995), hyaluronate lyase (Li et al. 2000), chondroitinase (Féthière et al. 1999), and maltose phosphorylase (Egloff et al. 2001).
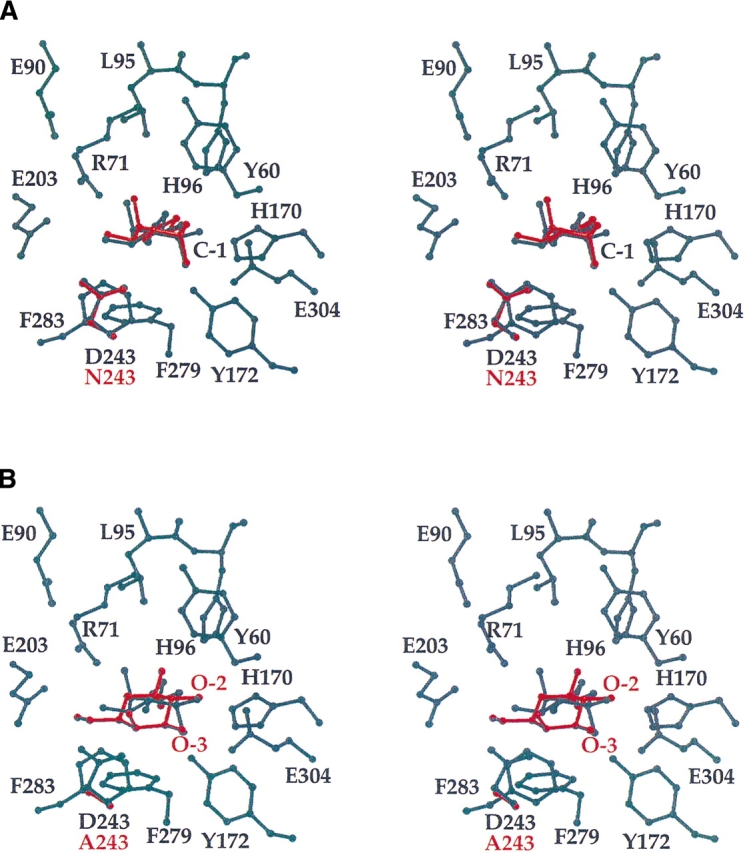
A close-up view of the active site of galactose mutarotase with bound galactose is displayed in Figure 1A ▶. Strikingly, the side chains of His 96 and His 170 are positioned within hydrogen bonding distance to the C-5 oxygen of the substrate while the carboxylate of Glu 304 is situated near the C-1 hydroxyl group of the sugar. On the basis of this initial investigation, a possible role for Glu 304 as the general acid/base group in catalysis was put forth as outlined in Scheme 1 ▶. Accordingly, the carboxylate group of Glu 304 abstracts the sugar C-1 hydroxyl group hydrogen to initiate the reaction. A proton is delivered to the C-5 oxygen by a side-chain acidic group, thereby resulting in ring cleavage. Subsequent rotation about the C-1/C-2 bond, followed by abstraction of the proton on the C-5 oxygen and donation of a proton back to the C-1 oxygen leads to product formation. Given that both His 96 and His 170 lie within 3 Å of the C-5 oxygen, either are positioned to function as the active site acid required to protonate this oxygen and thus it could not be speculated from the original X-ray investigation of the enzyme, which one serves in this capacity. In a previous site-directed mutagenesis analysis on the galactose mutarotase from Escherichia coli, it was demonstrated that replacement of His 104 (corresponding to His 96 in the L. lactis enzyme) with a glutamine residue reduced the kcat/Km by 4000-fold while the catalytic activity of the H175A mutant protein (corresponding to His 170 in the L. lactis enzyme) was too low to measure (Beebe and Frey 1998).
Figure 1.

Active site of galactose mutarotase from L. lactis. A close-up view of the active site within ~5 Å of the galactose ligand is displayed in (A). Ordered water molecules surrounding the sugar ligand were omitted for figure clarity. Both the α- and β-anomers of galactose were observed in the electron density map. A close-up view of the active site within ~5 Å of bound glucose is presented in (B). All figures in this article were prepared with the software package MOLSCRIPT (Kraulis 1991).
Scheme 1.

Following the initial X-ray study of the L. lactis mutarotase, an additional investigation was conducted to address the manner in which other known sugar substrates are accommodated in the active site region of the enzyme (Thoden et al. 2002). High-resolution X-ray models for the enzyme complexed with d-glucose, d-fucose, d-quinovose, l-arabinose, or d-xylose were obtained. Quite strikingly, these investigations revealed several distinct binding modes for these sugars, which were dependent upon the spatial orientation of the C-4 hydroxyl group. In those sugars with the same C-4 hydroxyl group orientation as galactose, namely d-fucose and l-arabinose, their C-1 hydroxyl groups were invariably located near Glu 304. For those sugars, which have the same C-4 hydroxyl group configuration as glucose (d-quinovose and d-xylose), the C-1 hydroxyls were typically located near Asp 243 as shown in Figure 1B ▶. From the analyses of these enzyme/sugar complexes, it was concluded that when the C-4 hydroxyl group of the sugar is in the “galactose” orientation, the C-1 hydroxyl group orients towards His 96, His 170, and Glu 304 and these are the best substrates for the enzyme as evidenced by higher kcat/Km values of between 0.68 × 10⁵ and 1.85 × 10⁵ M−1sec−1. In contrast, when the C-4 hydroxyl groups of the sugars are in the “glucose” configuration, the molecules bind in alternate orientations, at least in the crystalline enzyme, and these “nonproductive” binding modes are reflected in the reduced kcat/Km values of between 0.13 × 10⁵ to 0.20 × 10⁵ M−1sec−1.
Although these combined X-ray and kinetic analyses of galactose mutarotase were informative, several key questions remain regarding the catalytic mechanism. First, and perhaps foremost is the identity of the active site acid. Does His 96 or His 170 protonate the C-5 oxygen of the sugar? Additionally, the reduced kcat value for glucose (430 sec−1) versus galactose (3700 sec−1) as a substrate was speculated to be due to nonproductive binding modes of glucose within the active site region. An alternative explanation, albeit somewhat unusual, however, exists. It could have been argued that the active site of galactose mutarotase contains two constellations of spatially distinct active site bases and acids: one set that operates on galactose and its derivatives, and one that acts upon those sugars belonging to the “glucose” family. Indeed, given the orientation of glucose in the active site as shown in Figure 1B ▶, it could have been postulated that Asp 243 serves as the active site base to abstract the C-1 hydroxyl proton of the sugar. To address these questions, the following site-directed mutant proteins were constructed: D243N, D243A, E304Q, E304A, H96N, and H170N. Note, that of the 40 amino acid sequences surveyed in the SwissProt database (some of which were tentatively assigned as mutarotases), both His 96 and His 170 are strictly conserved. Asp 243 and Glu 304 are conserved in 38 of the 40 amino acid sequences. X-ray structures of complexes of all of the above-mentioned mutant proteins with bound galactose or glucose were subsequently determined to 1.95 Å resolution or better, and their kinetic properties were measured against d-galactose, d-glucose, d-xylose, and l-arabinose. From these combined structural and functional studies, it is clear that both Glu 304 and His 170 play key roles in catalysis and that the reduced kcat values for those sugars belonging to the “glucose” family are, indeed, most likely due to nonproductive binding modes.
Results and Discussion
For this investigation, 12 different mutant protein complexes of galactose mutarotase with either bound galactose or glucose were determined: D243N, D243A, E304Q, E304A, H96N, and H170N. The electron densities corresponding to the sites of substitution were unambiguous. Additionally, the electron densities for all of the polypeptide chains in the crystalline complexes were continuous throughout the map. The α-carbon atoms for all of the structures described here superimpose upon one another with root-mean-square deviations of 0.20 Å or less. As such, the changes in kinetic parameters listed in Table 3 are due directly to the substitutions at positions 96, 170, 243, and 304, and not to gross overall changes in three-dimensional structures.
Table 3.
Kinetic parameters for galactose mutarotase from L. lactis
| d-glucose | d-galactose | d-xylose | l-arabinose | |||||
| kcat (s−1) | Km (mM) | kcat (s−1) | Km (mM) | kcat (s−1) | Km (mM) | kcat (s−1) | Km (mM) | |
| WT | 430 ± 32 | 34 ± 6 | 3700 ± 240 | 20 ± 3 | 410 ± 38 | 21 ± 5 | 5500 ± 600 | 32 ± 9 |
| E304Q | <1a | NDb | <1 | ND | <1 | ND | <1 | ND |
| E304A | <1 | ND | <1 | ND | <1 | ND | <1 | ND |
| D243N | 250 ± 24 | 120 ± 24 | 2400 ± 230 | 38 ± 9 | 140 ± 13 | 33 ± 10 | 1500 ± 200 | 170 ± 40 |
| D243A | 2.1c | ND | 50 ± 6 | 52 ± 14 | 1.0c | ND | 9.0 ± 0.6 | 19 ± 3 |
| H96N | 17 ± 1 | 46 ± 8 | 170 ± 10 | 18 ± 4 | 92 ± 4 | 86 ± 13 | 62 ± 5 | 58 ± 13 |
| H170N | <1 | ND | <1 | ND | <1 | ND | <1 | ND |
Assay solution contains 25 mM HEPES (pH 7.6), 50 mM KCl, and varying amounts of the appropriate substrate. Assays were performed at 25°C.
aDetection limit.
bNot determined.
cMeasured at 200 mM concentration of substrate.
In the first set of site-directed mutagenesis experiments conducted for this investigation, Glu 304 was replaced with either a glutamine or an alanine residue to confirm its postulated role in acid/base catalysis. As can be seen from the kinetic data listed in Table 3, the removal of the carboxylate group at position 304 results in a nearly complete loss of enzymatic activity with any of the sugar substrates tested. In the E304Q protein/galactose structure, the sugar moiety binds in the same orientation as observed for the wild-type protein with His 96 and His 170 lying near its C-5 oxygen (Fig. 2A ▶). Both the α- and β-anomeric configurations at C-1 for galactose are observed in the electron density map. The carboxamide group of Gln 304 in the mutant protein lies within ~2.9 Å to the sugar C-1 oxygen in its β-anomeric configuration. Likewise, in the E304A protein/galactose structure, the sugar moiety binds in the same orientation as that observed for the wild-type protein (Fig. 2A ▶) and the electron density for the sugar indicates that both C-1 anomeric configurations are present. Interestingly, this E304A cavity-creating mutation results in virtually no structural perturbations in the enzyme. Indeed, all atoms for the wild-type and the E304A mutant proteins superimpose with a root-mean-square deviation of 0.40 Å.
Figure 2.

Active sites of the E304Q and E304A mutant proteins. Shown in (A) are the active sites of the E304Q and E304A mutant proteins with bound galactose superimposed onto that of the wild-type enzyme with bound galactose. For the sake of simplicity, only the site of the mutation and the positions of the galactose moieties are depicted for the E304Q and E304A mutant enzymes. All of the other side chains shown are those of the wild-type protein. The E304Q and E304A proteins are indicated in red and blue, respectively. Shown in (B) are the active sites of the E304Q and E304A mutant proteins with bound glucose superimposed onto that of the wild-type enzyme with bound galactose. The E304Q and E304A mutant enzymes are displayed in red and blue, respectively. Only the β-anomers are observed for the sugars in the E304Q and E304A mutant proteins.
The situation for the E304Q and E304A mutant proteins with bound glucose is more complex. In the wild-type enzyme with bound glucose, Glu 304 is not located within hydrogen bonding distance of the ligand as can be seen in Figure 1B ▶. Consequently, it was expected that mutation of this residue would not affect the manner in which glucose binds to the crystalline enzyme. Surprisingly, however, the glucose molecules did bind to the E304Q and E304A mutant proteins in a mode more similar to that observed for galactose in the wild-type enzyme, as can be seen in Figure 2B ▶. Only the β-anomers for the glucose moieties are observed in the active sites of the E304Q and E304A mutant proteins. A comparison of the hydrogen bonding patterns between galactose and the wild-type protein versus glucose and the E304Q mutant protein is depicted in Figure 3 ▶. The glucose moiety in the E304Q mutant protein is slightly shifted (Fig. 3B ▶) with respect to that observed for galactose in the wild-type protein (Fig. 3A ▶). As a result of this shift, its C-1 hydroxyl group hydrogen bonds with the imidazole nitrogens of histidines 96 and 170. Gln 304 in the mutant protein is not involved in hydrogen bonding with the glucose molecule. As seen for galactose in the wild-type enzyme, Asp 243 in the E304Q mutant protein bridges the C-2 and C-3 hydroxyl groups of glucose. Arg 71 is involved in hydrogen bonding to the glucose in the E304Q mutant protein but with only the C-3 hydroxyl rather than with both the C-3 and C-4 hydroxyl groups as is the case with galactose. This difference is undoubtedly due to the different spatial orientations of the C-4 hydroxyl groups of glucose versus galactose. Clearly, the orientation of the glucose ligands in the E304Q and E304A mutant proteins indicate that, as speculated in a previous study, at some point glucose (and its corresponding family members) must position into the mutarotase active site with its C-1 hydroxyl oxygen located near Glu 304.
Figure 3.

Schematics of hydrogen bonding patterns. Shown in (A) is the observed hydrogen bonding pattern between the wild-type protein and galactose. Both the α- and β-anomers at C-1 are observed in the active site. The hydrogen bonding pattern exhibited between the E304Q mutant protein and glucose is depicted in (B).
Asp 243 was the next target for site-directed mutagenesis to test the unconventional idea that perhaps the galactose mutarotase active site contained two constellations of active site residues: one set that operates on sugars of the “galactose” family, and the other functioning on those carbohydrates of the “glucose” family. According to this hypothesis, Asp 243 would serve as the active site base to initiate catalysis with ligands belonging to the “glucose” family. As can be seen from Table 3, substituting Asp 243 with an asparagine residue only reduced the kcat from 3700 sec−1 to 2400 sec−1 with galactose as the substrate. Indeed, as the crystal structure demonstrates, this substitution resulted in virtually no difference in galactose binding to the D243N mutant protein when compared to the wild-type enzyme (Fig. 4A ▶). Apparently, the asparagine residue serves equally well as an aspartate to bridge the C-2 and C-3 hydroxyl groups of galactose. Replacement of Asp 243 with an alanine residue, however, substantially reduced the kcat to 50 sec−1 with galactose as the substrate, most likely due to the loss of the bridging side chain, thereby leading to a nonproductive sugar binding mode (Fig. 4B ▶). The galactose in the D243A mutant protein binds with its C-2 and C-3 hydroxyl oxygens located within hydrogen bonding distance of Glu 304.
Figure 4.
Binding of galactose to the D243N or D243A mutant proteins. Shown in (A) and (B) are close-up views of the active sites for the D243N or D243A mutant proteins, respectively, with bound galactose. Only the sites of the mutation and the sugar ligands are shown in red. For comparison purposes, residues forming the wild-type enzyme active site are displayed in black.
According to the data presented in Table 3, replacement of Asp 243 with an asparagine residue only resulted in a reduction of kcat from 430 sec−1 to 250 sec−1 with glucose. This result clearly indicates that Asp 243 is not the catalytic base for the “glucose” family of ligands, and that, indeed, only one constellation of active site residues are important for mutarotase activity, namely Glu 304, His 96, and His 170. It might have been predicted that in the crystal structure, glucose binding to the D243N mutant protein would be similar to that observed for the wild-type enzyme. In fact, the sugar flipped over such that its C-4 rather than its C-6 hydroxyl group lies within hydrogen-bonding distance to Nɛ2 of His 170 (Fig. 5A ▶). Interestingly, when Asp 243 is replaced with an alanine residue, the kcat for glucose as a substrate is reduced to 2.1 sec−1. Yet, in the D243A mutant protein, the glucose binds in the same manner as that observed for the wild-type enzyme/glucose complex even in light of the loss of a hydrogen-bonding side chain functional group (Fig. 5B ▶).
Figure 5.

Binding of glucose to the D243N or D243A mutant proteins. The wild-type enzyme is shown in black in both (A) and (B). The D243N mutation is superimposed onto the wild-type protein in (A) while the D243A mutation is indicated in (B).
The final site-directed mutant proteins prepared for this study were H96N and H170N. Quite clearly, from the values listed in Table 3, His 170 is critically important for catalysis with all of the sugars tested in that there is a complete loss of enzymatic activity upon its substitution with an asparagine side chain. In the case of the H96N protein, the kcat for the various sugars is substantially reduced, but nevertheless, activity remains. Importantly, the polypeptide chains for these mutant proteins complexed with either glucose or galactose are virtually identical to that observed for the wild-type enzyme. Hence, the observed kinetic parameters are not a result of overall large three-dimensional changes. In both the H96N and H170N protein complexes with galactose, the sugar moieties bind in similar orientations as that observed for galactose in the wild-type protein. In the H96N and H170N proteins complexed with glucose, the ligands adopt quite different orientations compared to that observed for the wild-type protein (Fig. 6 ▶).
Figure 6.
Observed orientations of the glucose ligands in the H96N and the H170N proteins. The wild-type enzyme with bound glucose is displayed in black. The H96N and H170N proteins with bound glucose molecules are depicted in red and blue, respectively.
On the basis of both the kinetic and X-ray structural data presented, it appears that Glu 304 and His 170 are critically important for catalysis with all sugar substrates tested while Asp 243 and His 96 appear to be important only for proper substrate positioning. It is also apparent that there is only one constellation of side chains that are involved in the catalysis, and that the reduced activity of galactose mutarotase against those sugars belonging to the “glucose” family is, indeed, the result of nonproductive binding modes. The catalytic mechanism presented in Scheme 1 ▶ can now be modified to include His 170 as the residue that serves to donate a proton to the C-5 ring oxygen. Because the crystals of galactose mutarotase diffract to high resolution with “in-house” X-ray equipment, it should be possible to solve the structure of the enzyme to ultrahigh resolution with synchrotron radiation. Such an analysis would, indeed, provide further evidence as to the protonation state of His 170. Experiments designed to conduct such an investigation are presently underway.
Materials and methods
Preparation of site-directed mutant proteins
Site-directed mutant proteins were created with the original pET28-MRO plasmid and the mutation introduced via the QuikChange XL Site-Directed Mutagenesis Kit (Stratagene). Purified primers were purchased from Integrated DNA Technologies, Inc. Plasmids harvested from the mutagenesis reactions were screened and sequenced using the ABI PRISM Big Dye Primer Cycle Sequencing Kit (Applied Biosystems, Inc.).
Protein purification and crystallization
The necessary protein required for these studies was expressed in E. coli and purified as previously described (Thoden and Holden 2002). Single crystals of the unliganded mutant forms of the enzyme were grown by vapor diffusion at 4°C against precipitant solutions containing 15%–19% poly(ethylene glycol) 5000 methyl ether and 100 mM MES (pH 6.0). Enzyme concentrations were typically 17.5 mg/mL. The crystals belonged to the space group P212121 with typical unit cell dimensions of a = 44.8 Å, b = 76.3 Å, and c = 211.1 Å. The asymmetric unit contained one dimer.
Structural analyses of the galactose mutarotase/sugar complexes
Crystals of the unbound mutant forms of galactose mutarotase were harvested from hanging drop experiments and equilibrated in a synthetic mother liquor composed of 20% poly(ethylene glycol) 5000 methyl ether, 200 mM NaCl, 100 mM MES (pH 6.0), and 100 mM concentration of the appropriate sugar. Following equilibration for 24 h at 4°C, X-ray data sets were collected to high resolution at 4°C with a Bruker HISTAR area detector system equipped with Göbel focusing optics. The X-ray source was CuKα radiation from a Rigaku RU200 X-ray generator operated at 50 kV and 90 mA. The X-ray data were processed with SAINT (Bruker AXS, Inc.) and internally scaled with XSCALIBRE (I. Rayment and G. Wesenberg, unpubl.). X-ray data collection statistics are presented in Table 1.
Table 1.
Relevant X-ray data collection statistics
| X-ray data set | Resolution (Å) | Completeness (%) | Avg I/Avg σ(I) | Rsyma |
| E304Q/gal | 30.0–1.85 | 96.7 | 16.8 | 4.28 |
| E304A/gal | 30.0–1.95 | 94.1 | 10.5 | 7.02 |
| E304Q/glc | 30.0–1.85 | 95.6 | 18.6 | 4.01 |
| E304A/glc | 30.0–1.85 | 96.3 | 13.6 | 5.35 |
| D243N/gal | 30.0–1.80 | 97.0 | 14.4 | 5.50 |
| D243A/gal | 30.0–1.85 | 89.7 | 16.4 | 4.25 |
| D243N/glc | 30.0–1.80 | 94.8 | 16.7 | 4.87 |
| D243A/glc | 30.0–1.85 | 96.8 | 16.1 | 4.62 |
| H96N/gal | 30.0–1.80 | 95.0 | 11.9 | 6.46 |
| H96N/glc | 30.0–1.80 | 96.3 | 12.0 | 6.14 |
| H170N/gal | 30.0–1.75 | 98.1 | 16.8 | 4.32 |
| H170N/glc | 30.0–1.75 | 98.1 | 18.4 | 3.84 |
aRsym = (Σ|I − I |/Σ I) × 100.
All of the structures of the mutant protein/sugar complexes were analyzed by Difference Fourier techniques. Iterative cycles of least-squares refinement with the software package TNT (Tronrud et al. 1987) and manual model-building with the program TURBO (Roussel et al. 1990) reduced the R-factors to 18.1% or lower for all models. Refinement statistics are presented in Table 2.
Table 2.
Relevant least-squares refinement statistics
| Complex | E304Q GAL | E304A GAL | E304Q GLC | E304A GLC | D243N GAL | D243A GAL | D243N GLC | D243A GLC | H96N GAL | H96N GLC | H170N GAL | H170N GLC |
| Resolution limits (Å) | 30.0–1.85 | 30.0–1.95 | 30.0–1.85 | 30.0–1.85 | 30.0–1.80 | 30.0–1.85 | 30.0–1.80 | 30.0–1.85 | 30.0–1.80 | 30.0–1.80 | 30.0–1.75 | 30.0–1.75 |
| aR-factor (overall) % (No. rflns) | 16.3 (60,654) | 16.6 (50,822) | 15.6 (59,702) | 17.0 (60,490) | 17.8 (66,132) | 17.9 (56,210) | 18.1 (64,857) | 16.4 (60,904) | 17.6 (64,719) | 17.9 (65,725) | 16.9 (73,298) | 16.8 (72,954) |
| R-factor (work) % (No. rflns) | 16.0 (54,623) | 16.3 (45,793) | 15.2 (53,664) | 16.7 (54,496) | 17.5 (59,487) | 17.6 (50,615) | 17.7 (58,324) | 16.1 (54,814) | 17.3 (58,262) | 17.6 (59,213) | 16.6 (65,994) | 16.5 (65,700) |
| R-factor (free) % (No. rflns) | 21.0 (6031) | 22.9 (5089) | 21.3 (6038) | 22.8 (5994) | 22.6 (6645) | 23.6 (5595) | 23.3 (6533) | 21.2 (6090) | 23.6 (6457) | 22.7 (6512) | 21.7 (7354) | 21.8 (7254) |
| No. protein atoms | 5380 | 5358 | 5374 | 5368 | 5380 | 5378 | 5371 | 5373 | 5371 | 5370 | 5373 | 5376 |
| No. heteroatoms | 482 | 429 | 523 | 446 | 434 | 493 | 343 | 443 | 431 | 379 | 476 | 446 |
| Bond lengths (Å) | 0.012 | 0.012 | 0.012 | 0.013 | 0.012 | 0.014 | 0.012 | 0.012 | 0.013 | 0.013 | 0.012 | 0.012 |
| Bond angles (deg) | 2.32 | 2.33 | 2.20 | 2.35 | 2.19 | 2.56 | 2.22 | 2.20 | 2.32 | 2.34 | 2.52 | 2.26 |
| Trigonal planes (Å) | 0.007 | 0.007 | 0.007 | 0.007 | 0.005 | 0.009 | 0.007 | 0.007 | 0.008 | 0.009 | 0.008 | 0.008 |
| General planes (Å) | 0.013 | 0.012 | 0.013 | 0.014 | 0.011 | 0.014 | 0.012 | 0.013 | 0.012 | 0.013 | 0.014 | 0.014 |
| Torsional anglesb (deg) | 18.7 | 18.6 | 18.4 | 18.6 | 18.7 | 19.0 | 18.8 | 18.6 | 18.6 | 18.9 | 18.5 | 18.3 |
aR-factor = (Σ|Fo− Fc|/Σ|Fo|) × 100 where Fo is the observed structure-factor amplitude and Fc is the calculated structure–factor amplitude.
b These were not restrained during refinement.
Kinetic measurements and analysis
The enzymatic activities of the mutant forms of galactose mutarotase were measured with a DIP-360 digital polarimeter (Jasco) at 25°C. The change in a specific rotation of each substrate was measured as the α-anomer was converted to the equilibrium mixture of isomers, except for l-arabinose where the starting substrate was the β-anomer. All substrates were rapidly dissolved in 25 mM HEPES (pH 7.6) and 50 mM KCl immediately before addition of the enzyme. The rate of the nonenzymatic turnover was subtracted from the initial rate of the enzymatic reaction. The kinetic constants were determined by fitting the experimental velocity data to equation 1, where Vmax is the maximal velocity, Km is the Michaelis constant and A is the substrate concentration. The data are presented in Table 3.
 |
(1) |
Acknowledgments
This research was supported in part by grants from the NIH (DK47814 to H.M.H. and DK30343 to F.M.R.). We thank Dr. John Lindquist (Department of Bacteriology, University of Wisconsin–Madison) for supplying Lactococcus lactis var. lactis cell stock. X-ray coordinates have been deposited in the Protein Data Bank (1NS0, 1NS2, 1NS4, 1NS7, 1NS8, 1NSM, 1NSR, 1NSS, 1NSU, 1NSV, 1NSX, and 1NSZ) and will be released upon publication.
The publication costs of this article were defrayed in part by payment of page charges. This article must therefore be hereby marked “advertisement” in accordance with 18 USC section 1734 solely to indicate this fact.
Article and publication are at http://www.proteinscience.org/cgi/doi/10.1110/ps.0243203.
References
- Beebe, J.A. and Frey, P.A. 1998. Galactose mutarotase: Purification, characterization, and investigations of two important histidine residues. Biochemistry 37 14989–14997. [DOI] [PubMed] [Google Scholar]
- Bouffard, G.G., Rudd, K.E., and Adhya, S.L. 1994. Dependence of lactose metabolism upon mutarotase encoded in the gal operon in Escherichia coli. J. Mol. Biol. 244 269–278. [DOI] [PubMed] [Google Scholar]
- Egloff, M.-P., Uppenberg, J., Haalck, L., and van Tilbeurgh, H. 2001. Crystal structure of maltose phosphorylase from Lactobacillus brevis: Unexpected evolutionary relationship with glucoamylases. Structure 9 689–697. [DOI] [PubMed] [Google Scholar]
- Féthière, J., Eggimann, B., and Cygler, M. 1999. Crystal structure of chondroitin AC lyase, a representative of a family of glycosaminoglycan degrading enzymes. J. Mol. Biol. 288 635–647. [DOI] [PubMed] [Google Scholar]
- Jacobson, R.H., Zhang, X.J., DuBose, R.F., and Matthews, B.W. 1994. Three-dimensional structure of β-galactosidase from E. coli. Nature 369 761–766. [DOI] [PubMed] [Google Scholar]
- Kraulis, P.J. 1991. MOLSCRIPT: A program to produce both detailed and schematic plots of protein structures. J. Appl. Crystallogr. 24 946–950. [Google Scholar]
- Li, S., Kelly, S.J., Lamani, E., Ferraroni, M., and Jedrzejas, M.J. 2000. Structural basis of hyaluronan degradation by Streptococcus pneumoniae hyaluronate lyase. EMBO J. 19 1228–1240. [DOI] [PMC free article] [PubMed] [Google Scholar]
- Parsons, M.R., Convery, M.A., Wilmot, C.M., Yadav, K.D., Blakeley, V., Corner, A.S., Phillips, S.E., McPherson, M.J., and Knowles, P.F. 1995. Crystal structure of a quinoenzyme: Copper amine oxidase of Escherichia coli at 2 Å resolution. Structure 3 1171–1184. [DOI] [PubMed] [Google Scholar]
- Roussel, A., Fontecilla-Camps, J.C., and Cambillau, C. 1990. Turbo-Frodo: A new program for protein crystallography and modeling. Acta Crystallogr. A46 C66–C67. [Google Scholar]
- Thoden, J.B. and Holden, H.M. 2002. High resolution X-ray structure of galactose mutarotase from Lactococcus lactis. J. Biol. Chem. 277 20854–20861. [DOI] [PubMed] [Google Scholar]
- Thoden, J.B., Kim, J., Raushel, F.M., and Holden, H.M. 2002. Structural and kinetic studies of sugar binding to galactose mutarotase from Lactococcus lactis. J. Biol. Chem. 277 45458–45465. [DOI] [PubMed] [Google Scholar]
- Tronrud, D.E., Ten Eyck, L.F., and Matthews, B.W. 1987. An efficient general-purpose least-squares refinement program for macromolecular structures. Acta Crystallogr. A 43 489–501. [Google Scholar]