

Abstract
The N-terminal domain of enzyme IIAGlc of the Escherichia coli phosphoenolpyruvate:sugar phosphotransferase system confers amphitropism to the protein, allowing IIAGlc to shuttle between the cytoplasm and the membrane. To further understand this amphitropic protein, we have elucidated, by NMR spectroscopy, the solution structure of a synthetic peptide corresponding to the N-terminal domain of IIAGlc. In water, this peptide is predominantly disordered, consistent with previous data obtained in the absence of membranes. In detergent micelles of dihexanoylphosphatidylglycerol (DHPG) or sodium dodecylsulfate (SDS), however, residues Phe 3–Val 10 of the peptide adopt a helical conformation in the ensemble of structures calculated on the basis of NOE-derived distance restraints. The root mean square deviations for superimposing the backbone atoms of the helical region are 0.18 Å in DHPG and 0.22 Å in SDS. The structure, chemical shifts, and spin–spin coupling constants all indicate that, of the four lysines in the N-terminal domain of IIAGlc, only Lys 5 and Lys 7 in the amphipathic helical region interact with DHPG. In addition, the peptide-detergent interactions were investigated using intermolecular NOESY experiments. The aliphatic chains of anionic detergents DHPG, SDS, and 2,2-dimethyl-2-silapentane-5-sulfonate sodium salt (DSS) all showed intermolecular NOE cross-peaks to the peptide, providing direct evidence for the putative membrane anchor of IIAGlc in binding to the membrane-mimicking micelles.
Keywords: Amphitropism, dihexanoylphosphatidylglycerol, IIAGlc, lipid binding, NMR, membrane proteins, signal transduction
The signal transduction glucose-specific enzyme IIA (IIAGlc) is an integral component of the phosphoenolpyruvate:sugar phosphotransferase system (PTS) in Escherichia coli, in which sugar uptake is coupled with phosphorylation. The phosphoryl-transfer cascade of the glucose-specific PTS initiates from phosphoenolpyruvate, which is the donor for enzyme I autophosphorylation. Enzyme I then transfers the phosphoryl group to the histidine-containing phosphocarrier protein, HPr, which in turn donates the phosphoryl group to IIAGlc. Subsequently, IIAGlc transfers the phosphoryl group to the cytoplasmic IIB domain of the glucose transporter IICBGlc on the membrane (Postma et al. 1996). In addition to its role in the PTS, IIAGlc also modulates the activity of a number of other enzymes, depending on its phosphorylation state. Whereas dephosphorylated IIAGlc is a negative regulator of glycerol kinase (Novotny et al. 1985) and various non-PTS permeases (Postma et al. 1996), phosphorylated IIAGlc is a positive regulator of adenylyl cyclase (Peterkofsky et al. 1993). Further, structural studies of the PTS proteins have greatly enhanced our understanding of this signal-transduction cascade. In addition to the structures for the individual proteins (Herzberg and Klevit 1994; Robillard and Broos 1999), two protein–protein complexes have been determined for the glucose cascade (Garrett et al. 1999; Wang et al. 2000a). In these protein complexes, HPr uses a similar surface to interact with both its upstream partner Enzyme I and the downstream partner IIAGlc. Remarkably, this same HPr surface was found to interact with the mannitol-specific IIA domain in solution (Cornilescu et al. 2002), as well as the bifunctional HPr kinase in the crystal (Fieulaine et al. 2002). The eventual structural elucidation of the entire glucose-specific PTS will contribute to the E. coli structural genomics initiative. In addition to the protein–protein complexes, another bottleneck in this structural elucidation has been the membrane proteins in the PTS, such as the glucose transporter IICBGlc (Buhr and Erni 1993). IIAGlc was identified recently as an amphitropic protein (Wang et al. 2000b). This protein contains two domains, the N-terminal domain and the C-terminal domain. The structure of the C-terminal domain of IIAGlc has been studied by both X-ray crystallography (Feese et al. 1997) and NMR spectroscopy (Pelton et al. 1991). This domain contains the active-site residue His 90 on a concave surface of the protein. The N-terminal domain, which is essential for phosphoryl transfer from IIAGlc to IICBGlc (Meadow et al. 1986), has the capability of associating with anionic lipid vesicles (Wang et al. 2000b), but its three-dimensional structure in the lipid-bound state was not yet elucidated.
As an integral part of our studies on PTS structural biology and to further understand the amphitropism of IIAGlc, we have determined the three-dimensional structure of the N-terminal domain of this protein by high-resolution NMR spectroscopy using micelles to mimic the E. coli membrane. Detergent micelles (~50 Å) tumble rapidly in solution, allowing high-resolution NMR spectra to be recorded. For this purpose, dodecylphosphocholine, SDS, and DHPC have been widely utilized (McDonnell and Opella 1993; Henry and Sykes 1994; Fernandez et al. 2002). As our previous CD studies showed that the N-terminal domain of IIAGlc requires anionic lipids for association with the membrane (Wang et al. 2000b), we reasoned that deuterated SDS (Fig. 1B ▶) might be a good mimic. We also explored the possibility of using protonated DHPG for the structural determination. DHPG is an anionic detergent identical to the phosphatidylglycerol found in the membrane of E. coli, but with two shorter aliphatic chains of six carbons each (Fig. 1A ▶); it is expected to form micelles in solution like DHPC. Here, we report the structural studies of the N-terminal domain of IIAGlc in micelles of DHPG and SDS. We also report that anionic DSS (Fig. 1C ▶), a NMR chemical shift reference compound (Markley et al. 1998), interacts with the N-terminal domain of this protein and promotes helix formation.
Figure 1.
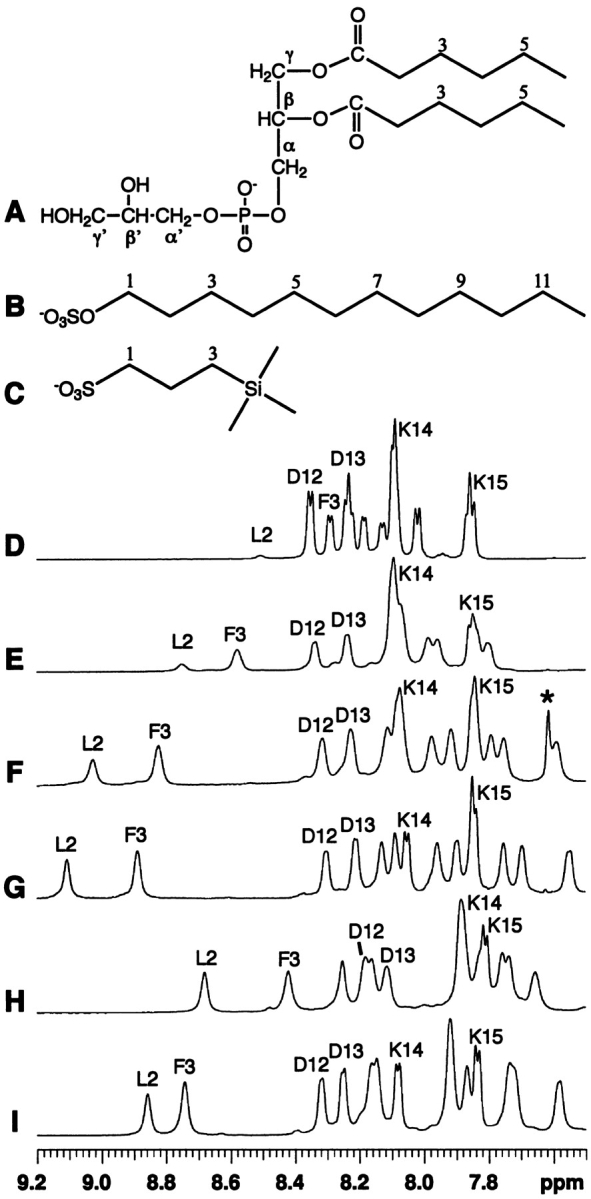
Chemical structures of detergents (A–C) and their effects on the NMR spectra (D–I) of a peptide corresponding to the N-terminal domain of enzyme IIAGlc of E. coli. Shown here are spectra in water (D), in the presence of dihexanoyl phosphatidylglycerol (DHPG, structure A) at a peptide:DHPG molar ratio of 1:2 (E), 1:5 (F), and 1:10 (G), sodium dodecylsulfate (SDS, structure B) at a peptide:SDS ratio of 1:20 (H), and 2,2-dimethyl-2-silapentane-5-sulfonate sodium salt (DSS, structure C) at a peptide:DSS ratio of 1:40 (I), at pH 5.4 and 25°C. The resonance for residual chloroform at 7.62 ppm in F was labeled by a star and was removed after evaporation under vacuum overnight (G). The peptide amide signals of Leu 2, Phe 3, Asp 12, Asp 13, Lys 14, and Lys 15 are labeled using the single-letter amino-acid code. At 25°C and pH 5.4, the chemical shifts of DHPG (A) in water are C2-H, 2.40 ppm; C3-H, 1.59 ppm; C4-H, 1.29 ppm; C5-H, 1.29 ppm; C6-H, 0.86 ppm; CH2α, 4.03 ppm; CHβ, 5.29; CH2γ, 4.27, 4.44; CH2α′, 3.89 ppm; CHβ′, 3.84 ppm; and CH2γ′, 3.59, 3.66 ppm. The chemical shifts of SDS (B) in water are C1-H, 4.02 ppm; C2-H, 1.68; C3-H, 1.36 ppm; C(4–11)-H, 1.30 ppm; and C12-H, 0.89 ppm. The chemical shifts of DSS (C) in water are C1-H, 2.90 ppm; C2-H, 1.75 ppm; C3-H, 0.63 ppm; and CH3 (triple methyls), 0.00 ppm. In the presence of the peptide, the signals of SDS and DHPG were found to shift upfield slightly by ~0.05 ppm and ~0.01–0.02 ppm, respectively, whereas the signals of DSS were found to shift downfield by ~0.01–0.02 ppm. The sodium ions are omitted to emphasize the anionic nature of these compounds.
Results and Discussion
NMR study of the N-terminal domain of IIAGlc in water
The amino acid sequence of the peptide studied is as follows: GlyLeuPheAspLysLeuLysSerLeuValSerAspAspLys Lys, which corresponds to the first 15 residues of the N-terminal tail of E. coli IIAGlc. In contrast to the previous study (Wang et al. 2000b), the N-terminal methionine (residue zero) was not included, as it is hydrolyzed in vivo and not found in IIAGlc structures studied thus far. The putative linker residues Asp 16 Thr 17 were also omitted to simplify the study. In aqueous solution, the amide signals split into sharp doublets as a result of scalar couplings between HN and Hα (3JHNHα). The JHNHα values for a few well-resolved doublets were measured from the one-dimensional NMR spectrum, ranging from 5.4 to 7.5 Hz at 25°C and pH 5.4 (Fig. 1D ▶). In the two-dimensional NOESY spectrum, Hαi-HNi+1 and HNi-HNi+1 types of NOEs, but not (i, i+2) and (i, i+3) types, were observed. To see whether there is any nascent helical structure (Dyson et al. 1988), we also collected data at 5°C. Although the coupling constants decreased slightly, no NOE cross-peaks of (i, i+3) type were detected. Therefore, we concluded that the peptide is predominantly unstructured in solution as a result of conformational averaging (Wüthrich 1986; Dyson et al. 1988), even at 5°C. These results are consistent with previous findings that the N-terminal sequence of IIAGlc is unstructured in water (Pelton et al. 1991; Wang et al. 2000a).
Signal assignments of the N-terminal domain of IIAGlc in micelles
Titration of any of the three compounds (Fig. 1A–C ▶) into the peptide solution had a significant effect on the spectrum of the peptide in water (Fig. 1D ▶). The amide signals of the peptide shifted and broadened dramatically (Fig. 1E–I ▶), indicative of the association of the peptide with the detergents (McDonnell and Opella 1993; Henry and Sykes 1994). As a consequence, the 3JHNHα coupling constants could no longer be measured. Figure 1 ▶ shows the one-dimensional NMR spectra of the peptide with the addition of DHPG at ratios of 1:2 (E), 1:5 (F), and 1:10 (G). In all cases, the signal dispersion increased upon addition of the detergent and minimal further changes were observed above peptide:detergent molar ratios of 1:5 in the case of SDS, 1:10 for DHPG, and 1:20 for DSS, suggesting that the peptide was predominantly in the bound states (McDonnell and Opella 1993). At the saturating level of detergents, the amide chemical shifts ranged from 7.59 to 9.17 ppm in DHPG (Fig. 1G ▶), from 7.69 to 8.72 ppm in SDS (Fig. 1H ▶), and from 7.61 to 8.81 ppm in DSS (Fig. 1I ▶). The interaction of DSS with the peptide was indicated by a line-width change of the DSS signal in the presence and absence of the peptide. This is not surprising, because the chemical structure of DSS resembles those of DHPG and SDS, all being anionic detergents (Fig. 1 ▶). In the case of SDS, the signal dispersion in the amide region was optimized by changing pH or temperature. As a result, the structural characterization of the peptide in SDS was carried out at a peptide:SDS ratio of 1:20 (pH 5.4) and 25°C. The same pH and temperature were also used for the studies of the peptide in either DHPG or DSS to facilitate comparison.
The fingerprint regions of the NOESY spectra of the peptide in deuterated SDS (A) and protonated DHPG (B) are shown in Figure 2 ▶, illustrating the sequential walk of signal assignments. The sequential signal assignments of these two-dimensional NMR spectra were achieved using the standard procedure (Wüthrich 1986). In brief, amino acid spin systems were identified on the TOCSY spectrum and connected using the NOESY spectrum. The complete assignment of longer side chains was confirmed by DQF-COSY.
Figure 2.
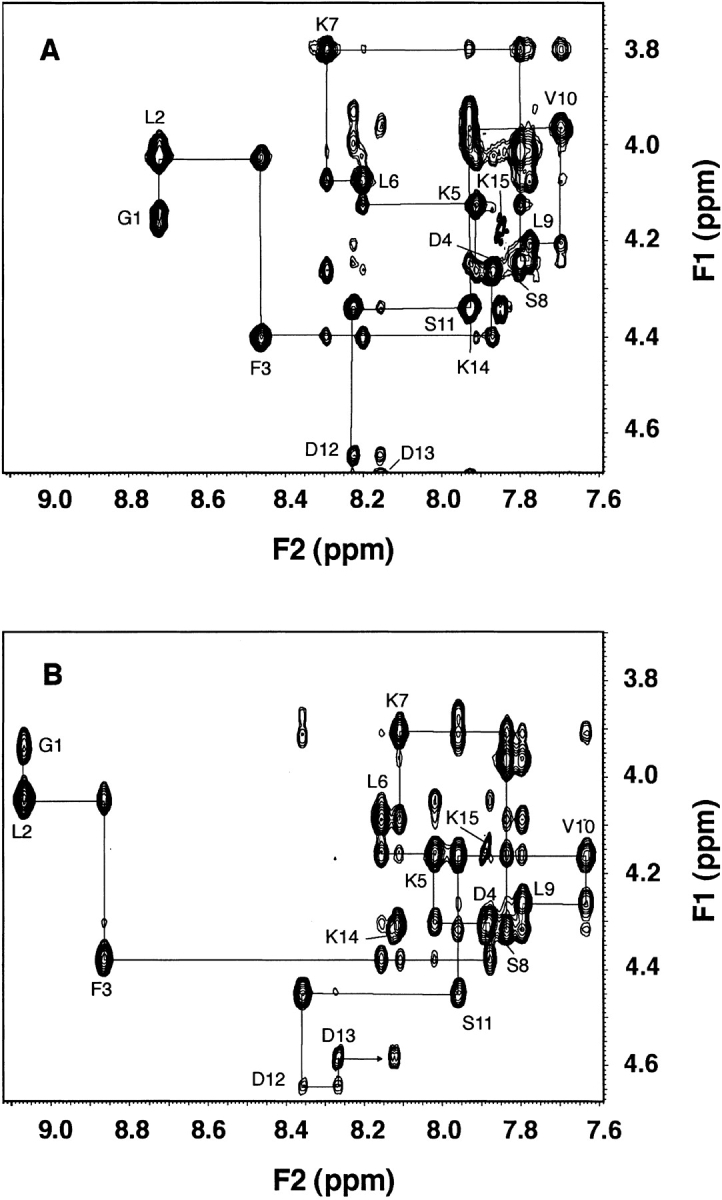
The fingerprint regions of the two-dimensional NOESY spectra of the N-terminal domain of IIAGlc in SDS (A) and DHPG (B). The sample contains 5 mM peptide in the presence of 100 mM SDS-d25 (mixing time 75 msec) (A) or 25 mM DHPG (mixing time 150 msec) (B) at pH 5.4 and 25°C. The NOE patterns at the peptide:DHPG ratios from 1:5 to 1:20 are identical, but the quality of the spectrum at 1:5 is higher due to smaller signal interference from the lipid. The constructs follow the sequential NOE connectivities with the HN-Hα cross-peak of each residue labeled using the one-letter amino-acid code. For the N-terminal glycine, only the well-resolved Hα is labeled.
Secondary structure
Hα secondary chemical shifts of the peptide in the presence of different detergents were calculated and plotted in Figure 3 ▶. The secondary shift is the difference between the measured shift of the peptide and the Hα chemical shift in a random coiled peptide (Wüthrich 1986). A train of secondary shifts <−0.1 ppm indicates a helical structure (Wishart et al. 1991). On the basis of this criterion, residues Leu 2–Ser 11 are located in a helical region in SDS (Fig. 3A ▶), whereas residues Leu 2–Leu 9 are helical in DHPG (Fig. 3B ▶). The plot in DSS is remarkably similar to that in DHPG, with residues Leu 2–Leu 9 being helical (Fig. 3C ▶). The helix content was estimated using the average secondary shift per residue divided by 0.35, a value that defines 100% helix (Rizo et al. 1993). The helix contents of the peptide are 60% in SDS at a peptide:SDS ratio of 1:20, 59% in DHPG at a ratio of 1:10, and 55% in DSS at a ratio of 1:40. These helix percentages are similar to those found by CD (~50%) for a similar peptide in anionic dioleoyl phosphatidylglycerol or a mixture of lipids mimicking the E. coli membrane (Wang et al. 2000b).
Figure 3.

The Hα secondary shifts of the N-terminal domain of IIAGlc in a variety of detergents as a function of the residue number. The Hα secondary shift is defined as the chemical-shift difference between that of the peptide measured here and that in a random-coiled peptide ( Wüthrich 1986). Shown in A is the plot in SDS at a peptide:SDS molar ratio of 1:20, in B in DHPG at a peptide:DHPG ratio of 1:10, and in C in DSS at a peptide:DSS ratio of 1:40. The well-resolved shift for Gly1 was used in all cases.
The helical region of the peptide in micelles is also supported by the NOE pattern. In SDS, medium Hαi−HNi+1, Hαi−HNi+3, weak Hαi−HNi+4, and Hαi−HNi+2 NOE cross-peaks were found for the region Leu 2 to Ser 11 (Fig. 2 ▶), indicating an α-helical structure (Wüthrich 1986). A similar NOE pattern was observed for residues Leu 2–Val 10 in both DHPG (Fig. 2B ▶) and DSS (data not shown). Beyond residue Ser 11 in SDS (Val 10 in DHPG), the NOE patterns look different (Fig. 2 ▶). The Hαi−HNi+1 cross-peak between residues Ser 11 and Asp 12 in SDS (Val 10 and Ser 11 in DHPG) is strong, and the Hαi−HNi+3 cross-peak between Leu 9 and Asp 12 or between Val 10 and Asp 13 is weak (very weak) in SDS (DHPG). Such a NOE pattern (Wang et al. 1996a) indicates that residues Asp 12 and Asp 13 (Ser 11 to Asp 13) are not in a regular helical region in SDS (DHPG).
Three-dimensional structures of the N-terminal domain of IIAGlc in SDS and DHPG
Figure 4 ▶ shows an ensemble of 50 structures of the peptide in association with SDS (A) or DHPG (B), in which the backbone atoms have been superimposed. For the final structural calculations, 140 NOE distance restraints for the peptide were found in SDS, whereas 145 NOEs were obtained in DHPG. The rms deviations for superimposing backbone atoms of residues Phe 3–Val 10 of the peptide are 0.22 Å in SDS and 0.18 Å in DHPG, respectively. The rms deviation increases significantly to 1.58 Å in SDS and 1.40 Å in DHPG when superimposing all backbone atoms of the peptide, mainly because of the low precision of the less structured carboxyl terminus (Fig. 4 ▶). The slightly higher structural quality determined in DHPG may reflect a better signal dispersion of the NMR spectra in DHPG than in SDS (Figs. 1 ▶, 2 ▶). In both SDS and DHPG, the principal helical region was located to residues Phe 3–Val 10 by the program MOLMOL (Koradi et al. 1996).
Figure 4.

Superimposed backbone view of an ensemble of 50 structures. The structures were calculated by Xplor-NIH (Schwieters et al. 2003) using NOE restraints derived from the NOESY spectra of the N-terminal domain of IIAGlc bound to SDS-d25 at a peptide:SDS ratio of 1:20 (A) or DHPG at a peptide:DHPG ratio of 1:10 (B), at pH 5.4 and 25°C. The backbone atoms of residues Phe 3–Val 10 have been superimposed using MOLMOL (Koradi et al. 1996).
Figure 5 ▶ shows a sideview of the average structures of the peptide determined in SDS (A) and DHPG (B) with the backbones shown as ribbons. In both cases, the hydrophobic side chains Leu 2, Phe 3, Leu 6, Leu 9, and Val 10 of the peptide are all clustered on the same face, whereas the hydrophilic side chains Asp 4, Ser 8, and Ser 11 occupy the opposite face with Lys 5 and Lys 7 located in the interface. Such features are characteristic of an amphipathic helical structure. Except for the poorly defined carboxyl terminus of the peptide, the side-chain orientations in the helical region are quite similar in the structures elucidated in both SDS and DHPG (Fig. 5 ▶).
Figure 5.

Sideview of the side chains of the N-terminal domain of IIAGlc in SDS-d25 (A) and in DHPG (B) with backbone atoms represented by a ribbon. Shown here are the structures that most resemble the average structure generated from an ensemble of 50 structures displayed in Figure 4 ▶. The hydrophobic side chains are shown at the bottom, the hydrophilic side chains at the top of the ribbon, and interfacial lysine side chains on the ribbon. Side chains are selectively labeled.
Interactions between the N-terminal domain of IIAGlc and SDS, DHPG, or DSS
Unlike CD, not only can NMR define the helical region precisely, it is also capable of providing detailed information concerning the interaction of the N-terminal domain of IIAGlc with these detergents (Fig. 1 ▶). Because both DHPG and DSS are protonated, intermolecular proton–proton NOE cross-peaks between the peptide and the detergent could be observed directly. In the case of SDS, protonated SDS need be used in place of deuterated SDS to see such an effect (Wang et al. 1996b). At a peptide:SDS ratio of 1:1, intermolecular NOEs were detected between SDS C1-H and Leu 2 HN, Phe 3 HN, and aromatic ring protons. The C3-H and C(4–11)-H of SDS showed intense NOEs to residue Phe 3 aromatic protons, and weak NOEs to the amide protons of residues Leu 2–Ser 11. They also displayed weak NOEs to Phe 3 Hβ, and Hɛ of Lys 5 and Lys 7. At the peptide:SDS ratio of 1:5, containing 40% protonated SDS and 60% deuterated SDS, similar NOE cross-peaks were found between the Phe 3 aromatic ring and SDS C1-H, C3-H, and C(4–11)-H (Fig. 6A ▶). At pH 5.4, the terminal NH3+ signals of lysine side chains showed no NOE cross-peaks to SDS due to rapid exchange with water. Therefore, a separate NOESY spectrum was collected at pH 3.9 and the NH3+ signals of Lys 5 and Lys 7 at ~7.4 ppm showed intermolecular NOEs with SDS C3-H and C(4–11)-H. These intermolecular NOEs provide direct evidence for the binding of both cationic and hydrophobic side chains of the amphipathic helix with anionic SDS (Wang et al. 1996b).
Figure 6.

Peptide-detergent intermolecular NOE cross-peaks. Portions of the intermolecular NOESY spectra of the N-terminal domain of IIAGlc (5 mM) in the presence of a mixture of 25 mM deuterated and protonated SDS (3:2) (mixing time 75 msec) (A), 25 mM protonated DHPG (mixing time 150 msec) (B), and 50 mM protonated DSS (mixing time 150 msec) (C) at pH 5.4 and 25°C. Intermolecular NOE cross-peaks between the aromatic ring (Hδ or Hɛ/Hz) of Phe 3 and the aliphatic chains of detergents (for structures, see Fig. 1 ▶) are labeled. The aromatic ring Hδ protons of Phe 3 (~7.25 ppm) showed strong cross-peaks with the Phe 3 Hβ protons (~3.2 ppm, indicated by the stars in the figure). The arrows point to the cross-peaks between the Hɛ protons of Lys 7 and Hδ protons of Phe 3 in SDS and DHPG.
At a peptide:DHPG ratio of 1:5, a few peptide-detergent intermolecular NOE cross-peaks are well resolved at 75 msec. The acyl C4/C5 protons of the detergent showed a medium-to-strong cross-peak with the aromatic Hδ side-chain protons of Phe 3 and a weak NOE with Hɛ protons of Phe 3 (Fig. 6B ▶). These detergent protons also displayed very weak NOE cross-peaks to the amide protons of residues Leu 2, Phe 3, Leu 6, and Lys 7. In addition, the detergent acyl chain C2-H at 2.35 and 2.40 ppm, the glycerol backbone CH2α at 4.03 ppm, and the CH2γ at 4.27 ppm (Fig. 1A ▶) yielded NOE cross-peaks with the aromatic Hδ protons of Phe 3 (Fig. 6B ▶). These NOEs were also identified at a peptide:DHPG ratio of 1:2, thus providing strong evidence for the association of the amphipathic helical region of the peptide with both the glycerol backbone and the acyl chains of anionic DHPG. Note that the amide protons of residues Asp 12–Lys 15 showed minimal displacements relative to those in water (Fig. 1 ▶) and the spin–spin couplings for residues Lys 14 and Lys 15 could be seen even at a peptide: DHPG ratio of 1:10 (Fig. 1G ▶). Similarly, their TOCSY peaks are much stronger than those for residues Leu 2–Ser 11. Taken together, all the NMR data support the notion that residues Asp 12–Lys 15 do not interact with the detergent.
Figure 6C ▶ shows the intermolecular NOE cross-peaks between DSS and the aromatic protons of Phe 3 at a peptide:DSS molar ratio of 1:10. The methyl protons of DSS at 0.00 ppm stand out and give the strongest NOE cross-peaks to the peptide. Hence, there is no ambiguity in the assignment of these intermolecular NOEs, including those at 0.63 ppm. These peptide:DSS intermolecular NOE cross-peaks corroborate the binding of DSS to the peptide.
The peptide-detergent intermolecular NOEs observed here indicate that these detergents interact with the peptide in a similar manner by attaching solely to the hydrophobic face of the amphipathic helical domain. This is different from the integral membrane protein OmpX in complex with DHPC, in which intermolecular NOE cross-peaks indicate that DHPC covers the entire exterior surface of the β-barrel structure for membrane anchoring (Fernandez et al. 2002).
Comparison of DHPG, SDS, and DSS
It is interesting to note that the amide signals of the peptide in DHPG displayed a better signal dispersion than those in either SDS or DSS (Fig. 1 ▶). Better quality of two-dimensional NMR data in DHPG is also evident in Figure 2 ▶. As DHPG is a true phosphatidylglycerol, one of the major lipids in the E. coli membrane, these results suggest that DHPG may be preferentially used over SDS or DSS as a membrane-mimicking agent for structural studies of E. coli membrane-associated proteins and peptides.
Our parallel structural study of the N-terminal domain of IIAGlc in both DHPG and SDS micelles allowed us an opportunity to assess the usefulness of SDS as an anionic lipid-mimicking compound. First, similar structures were found in SDS and DHPG (Figs. 4 ▶, 5 ▶). Second, SDS and DHPG showed similar intermolecular NOE cross-peaks to the peptide (Fig. 6 ▶). In light of these results, anionic SDS appears to mimic anionic DHPG well in this particular case. Nevertheless, there are subtle differences between them. These may be attributed to the differences in their chemical structures, including both the head group (sulfate versus phosphate) and the length of the aliphatic chain (12 versus 2 × 6) (Fig. 1 ▶). Whereas numerous intermolecular NOE cross-peaks were observed at a peptide:SDS ratio of 1:1, no intermolecular NOE cross-peaks were detected between DHPG and the peptide at the same ratio, indicating that SDS interacts with the peptide more strongly than DHPG. Combined with the titration data above, the order of helix-promoting capability of these compounds can be arranged as SDS > DHPG > DSS. It appears that phosphate rather than sulfate has evolved in nature as the lipid head group to ensure a weak-to-intermediate interaction between the N-terminal domain of IIAGlc and the membrane. Weaker interactions could be the key for the reversible translocation of this amphitropic protein from cytosol to the membrane (see below).
The amphitropism of enzyme IIAGlc
Several proteins that play a critical role in signal transduction, such as Src kinase, Ras-guanine nucleotide exchange factor, protein kinase C, and cytidyltransferase, show amphitropism (Burn 1988; Johnson and Cornell 1999). Recently, we showed that enzyme IIAGlc of the PTS is another amphitropic protein (Wang et al. 2000b). A common feature of these proteins is the ability to migrate between the cytoplasm and the membrane for different functions. Thus, this classical E. coli glucose signal transduction pathway (the PTS) may serve as a useful model system for understanding protein amphitropism in other organisms.
With the availability of structures for both the N-terminal (this study) and C-terminal (Feese et al. 1997) domains, it became feasible to reconstruct the structure of IIAGlc in the two states. In the first state, the N-terminal domain is unstructured and can form a number of alternative conformations, whereas the C-terminal domain is folded (Fig. 7A ▶). The folded domain has the capability of accepting a phosphate group from its upstream protein partner, HPr, and the N-terminal domain is not required (Wang et al. 2000a). In the second state, the N-terminal domain adopts an amphipathic helix between residues Phe 3–Val 10, which can associate with the E. coli membrane, whereas the C-terminal domain remains folded (Fig. 7B ▶). There are multiple possible orientations for the relationship between the N- and C-terminal domains that might adhere to the model. Because residues Asp 12–Lys15 do not interact with phosphatidylglycerol, they constitute part of the linker region (residues Asp 12–Gly 18) between the two domains. This N-terminal membrane anchor was found to be crucial for effective phosphoryl transfer in the protein cascade toward glucose, because a loss of even the first seven residues abolishes phosphoryl transfer activity between IIAGlc and its downstream partner IICBGlc by ~98% (Meadow et al. 1986). The structural studies reported here on the N-terminal domain of IIAGlc made it clear that these first seven residues, including Lys 5 and Lys 7, are the most critical part of the membrane anchor. A similar anchor function of this N-terminal domain of IIAGlc has also been implicated in interactions with lactose permease (Sondej et al. 2002). The nature of interaction between this cationic amphipathic helix and the anionic DHPG micelle (Fig. 7B ▶) is remarkably similar to those observed recently in the interfaces of the protein–protein complexes between the N-terminal domain of enzyme I and HPr (Garrett et al. 1999) and between HPr and IIAGlc (Wang et al. 2000a) in the same glucose cascade, with hydrophobic interactions in the center bordered by electrostatic interactions. Using the hydrophobicity scale of Karplus (1997), we calculated the transfer-free energy for this amphipathic region of the N-terminal domain of IIAGlc from cytoplasm to the membrane to be −17.0 kcal/mole by summing all hydrophobic side chains, including Lys 5 and Lys 7. This is very close to the value found previously for human apoE(267–289; −17.6 kcal/mole; Wang et al. 1996a), which was shown, just like the N-terminal domain of IIAGlc, not to associate with zwitterionic phospholipids. This calculation further substantiates the importance of additional electrostatic interactions between cationic Lys 5/ Lys 7 and the anionic E. coli membrane for anchoring. The weakness of this membrane anchor may be understood from another angle. This anchor contains a relatively short helix with only one aromatic residue, whereas the strong lipid-binding domains of human apolipoprotein A-I, apolipoprotein C-I, and apolipoprotein E contain 3–4 aromatic residues (Wang 2002). Therefore, the membrane anchor found at the N-terminal domain of IIAGlc may be one of the minimal models for understanding other amphitropic proteins, which utilize a similar amphipathic helix as the anchor.
Figure 7.

The two states of enzyme IIAGlc involved in the phosphoryl transfer cascade for the phosphorylation of glucose transported into E. coli. In the first state (A), the N-terminal domain of IIAGlc is disordered in solution ( Pelton et al. 1991) (gray) and not required for interaction with HPr (Wang et al. 2000a). In the second state (B), residues Leu 2–Val 10 of the N-terminal domain change conformation to an amphipathic helix (red), which functions as a membrane anchor to enhance the stability of the total IICBGlc-IIAGlc complex required for efficient phosphoryl transfer between them ( Wang et al. 2000b). Both the hydrophobic and cationic side chains (Lys 5 and Lys 7) in the amphipathic helix are required for the binding of the membrane anchor (red) to the E. coli membrane (black). Shown here is one of the possible orientations of the anchor on the membrane surface generated from the calculations. The coordinates for residues Asp16Thr17Gly18 are represented by broken lines (black) to reflect the fact that they were not observed in the crystal (Feese et al. 1997), nor determined in this study. In both states, the C-terminal domain, represented by a yellow ribbon, remains folded. The N- and C-termini of the protein are labeled. Figures 5 ▶ and 7 ▶ were made using the program MOLMOL (Koradi et al. 1996).
In conclusion, the amphitropism of IIAGlc, as depicted in Figure 7 ▶, plays a crucial role in the phosphoryl transfer cascade for glucose uptake. Further, the capability of IIAGlc to shuttle between a membrane-bound form (to IICBGlc) and the cytoplasm, allows it to interact with multiple partners such as HPr, glycerol kinase, adenylate cyclase, and a variety of permeases.
Materials and methods
A peptide corresponding to the N-terminal domain of IIAGlc was synthesized by solid-phase methods and purified by reverse-phase HPLC (Peptide Technologies Corporation). The peptide was >99% pure as judged by HPLC analysis. Mass spectroscopy gave a molecular peak at a mass of 1694.5 (calculated 1694.0). SDS (>99%) was purchased from Bio-Rad Laboratories and deuterated SDS (SDS-d25) was obtained from Cambridge Isotope Laboratories. Protonated DHPG (>98%) was purchased from Avanti Polar Lipids, Inc. Chloroform was removed from DHPG in a fume hood under a stream of nitrogen gas. Residual chloroform was removed under vacuum overnight. DSS was obtained from Wilmad-Labglass. The signals of DHPG (for chemical shifts, see legend to Fig. 1 ▶) were assigned on the basis of two-dimensional NMR spectra collected in deuterated chloroform on a 500-MHz NMR spectrometer and in water on the 600-MHz NMR spectrometer (Varian, Inc.), by comparison with the reported chemical shifts for phospholipids (Birdsall et al. 1972). The NMR spectra collected for these materials before mixing with the peptide also support their high purity.
Nuclear magnetic resonance spectroscopy
The synthetic peptide (5 mM) was solubilized in 0.6 mL of aqueous solution containing 90% H2O and 10% D2O. The peptide:detergent molar ratio was determined by titrating DHPG or lipid-mimicking compounds in powdered form into the solution of the peptide until the NMR signals showed no further change. The sample temperature was calibrated on the basis of the chemical shift of water containing 1 mM DSS (Hartel et al. 1982). The pH (meter reading at room temperature of 22°C without isotope effect correction) of the sample was measured directly in the 5-mm NMR tubes using a micro pH electrode (Wilmad-Labglass) and adjusted with the addition of a few microliters of NaOH or HCl solution. For observation of intermolecular NOE cross-peaks between SDS and the peptide, protonated SDS was included (Wang et al. 1996b).
All TOCSY (Bax and Davis 1985; Griesinger et al. 1988), NOESY (Jeener et al. 1979), and DQF-COSY (Rance et al. 1983) spectra for the peptide or peptide/detergent complexes were acquired at a 1H resonance frequency of 599.807 MHz on a Varian INOVA600 spectrometer. The sign of the frequency in the indirect dimension was discriminated using the method of States-TPPI (Marion et al. 1989). Typically, spectra were collected with 512 increments (32 scans each) in t1 and 4K data points in t2 time domains using a spectral width of 10,000.0 Hz in both dimensions. The water signal was suppressed by low power (50 Hz γB1) presaturation during the relaxation delay, as well as during the mixing period in NOESY experiments. Alternatively, the WET technique was applied during the mixing period of the NOESY experiments to achieve water suppression (Smallcombe et al. 1995). NOESY experiments were collected at mixing times of 35, 75, and 150 msec for the peptide/detergent complexes and at 75, 150, and 300 msec for the peptide in water. TOCSY experiments were performed at a mixing time of 75 msc using a clean MLEV-17 pulse sequence (Bax and Davis 1985; Griesinger et al. 1988). NMR data were apodized by a 63°-shifted squared sine-bell window function in both dimensions, zero filled and Fourier transformed on a Silicon Graphics octane workstation using NMRpipe (Delaglio et al. 1995) to yield a data matrix of 4K × 1K. The first data point was scaled by half prior to Fourier transformation (Otting et al. 1986). Baselines were corrected using a fourth order polynomial function in both dimensions. NOESY cross-peaks were picked using PIPP (Garrett et al. 1991). The chemical shift of water was referenced to internal DSS at 0.00 ppm (Markley et al. 1998). Protein signals were referenced to the water signal (Hartel et al. 1982) because of the interaction of DSS with this peptide observed in this study.
Structure calculations
Three-dimensional structures of the peptide in SDS-d25 or DHPG at pH 5.4 and 25°C were calculated on the basis of the distance restraints using the simulated annealing protocol (Nilges et al. 1988) in the NIH version of XPLOR (Brünger 1992; Schwieters et al. 2003). The distance restraints were obtained by classifying the NOE (75 msec) cross-peak volumes into strong (1.8–2.8 Å), medium (1.8–3.8 Å), weak (1.8–5.0 Å), and very weak (1.8–6.0 Å) ranges (Garrett et al. 1999). The distance was calibrated on the basis of the typical NOE patterns in helices (Wüthrich 1986). A covalent peptide structure with random φ, ψ, and χ angles but trans planar peptide bonds was used as a starting structure. In total, 100 structures were calculated for the peptide in both SDS and DHPG. An ensemble of 50 structures with the lowest total energy was chosen. This final ensemble of accepted structures satisfies the following criteria: no NOE violations greater than 0.20 Å, rms difference for bond deviations from ideality less than 0.01 Å, and rms difference for angle deviations from ideality less than 2°.
The structure of the membrane-bound state of enzyme IIAGlc was calculated using the recently developed constrained/restrained simulated annealing protocol (Wang et al. 2000a). In this approach, the X-ray coordinates of the C-terminal domains (Feese et al. 1997) were fixed, and the structure of the N-terminal domain was determined by the NMR restraints obtained above in the DHPG micelles. In the previous structure determined by X-ray crystallography, the electron density for the N-terminal domain was missing. To view the structural state of enzyme IIAGlc before associating with the membrane, we also performed a separate calculation. In this calculation, the coordinates for the C-terminal domain were again fixed, whereas the N-terminal domain was not restrained, as our current NMR study here indicates that it is unstructured in aqueous solution.
Structure deposition
The coordinates of the N-terminal domain of IIAGlc in DHPG at a peptide:DHPG ratio of 1:10, pH 5.4, and 25°C have been deposited in the Protein Data Bank (PDB accession code 1O0Z). The chemical shifts have been deposited with BMRB (accession no. 5708).
Electronic supplemental material
Two tables are available for chemical shift assignments of the N-terminal domain of enzyme IIAGlc in deuterated SDS at a peptide:SDS ratio of 1:20, pH 5.4 and 25°C (Table 1) and protonated DHPG at a peptide:DHPG ratio of 1:10, pH 5.4 and 25°C (Table 2).
Note added in proof
A recent paper reported a remarkably similar membrane-targeting sequence (EEEKKGFLKRLFGG) at the C-terminus of E. coli MinD, a widely conserved ATPase. Interestingly, sequence homology analysis indicates that this sequence is conserved from eubacteria, archaea, to chloroplasts, thereby reinforcing our contention that the N-terminal amphipathic helical structure of E. coli enzyme IIAGlc elucidated here in anionic membrane-mimetic micelles serves as a general model for understanding membrane-associating sequences of amphitropic proteins. ( Szeto, T.H., Rowland, S.L., Rothfield, L.I., and King, G.F. 2002. Membrane localization of MinD is mediated by a C-terminal motif that is conserved across eubacteria, archaea, and chloroplasts. Proc. Natl. Acad. Sci. 99 15693–15698.)
Acknowledgments
We thank Frank Delaglio, Dan Garrett, and John Kuszewski (NIH) for NMR software and John Kuszewski for helpful discussions. We also thank researchers in the Eppley Institute, UNMC, for assistance.
The publication costs of this article were defrayed in part by payment of page charges. This article must therefore be hereby marked “advertisement” in accordance with 18 USC section 1734 solely to indicate this fact.
Abbreviations
IIAGlc, glucose-specific enzyme IIA (older abbreviation IIIGlc)
PTS, phosphoenolpyruvate:sugar phosphotransferase system
SDS, sodium dodecylsulfate
DHPC, dihexanoylphosphatidylcholine
DHPG, dihexanoylphosphatidylglycerol
DSS, 2,2-dimethyl-2-silapentane-5-sulfonate sodium salt
NMR, nuclear magnetic resonance
NOE, nuclear Overhauser effect
NOESY, nuclear Overhauser enhancement spectroscopy
TOCSY, total correlation spectroscopy
DQF-COSY, double-quantum filtered correlation spectroscopy
HPLC, high-pressure liquid chromatography
CD, circular dichroism
rms, root mean square
Supplemental material: See www.proteinscience.org.
Article and publication are at http://www.proteinscience.org/cgi/doi/10.1110/ps.0301503.
References
- Bax, A. and Davis, D.G. 1985. MLEV-17 based two-dimensional homonuclear magnetization transfer spectroscopy. J. Magn. Reson. 65 355–360. [Google Scholar]
- Birdsall, N.J.M., Feeney, J., Lee, A.G., Levine, Y.K., and Metcalfe, J.C. 1972. Dipalmitoyl-lecithin: Assignment of the proton and carbon-13 nuclear magnetic resonance spectra, and conformational studies. J. Chem. Soc. Perkin Trans. II 1441–1445.
- Brünger, A.T. 1992. X-PLOR: A system for X-ray crystallography and NMR. Yale University Press, New Haven, CT.
- Buhr, A. and Erni, B. 1993. Membrane topology of the glucose transporter of Escherichia coli. J. Biol. Chem. 268 11599–11603. [PubMed] [Google Scholar]
- Burn, P. 1988. Amphitropic proteins: A new class of membrane proteins. Trends Biochem. Sci. 13 79–83. [DOI] [PubMed] [Google Scholar]
- Cornilescu, G., Lee, B.R., Cornilescu, C.C., Wang, G., Peterkofsky, A., and Clore, G.M. 2002. Solution structure of the phosphoryl transfer complex between the cytoplasmic A domain of the mannitol transporter IIMannitol and HPr of the Escherichia coli phosphotransferase system. J. Biol. Chem. 277 42289–42298. [DOI] [PubMed] [Google Scholar]
- Delaglio, F., Grzesiek, S., Vuister, G.W., Zhu, G., Pfeifer, J., and Bax, A. 1995. NMRPipe: A multidimensional spectral processing system based on UNIX pipes. J. Biomol. NMR 6 277–293. [DOI] [PubMed] [Google Scholar]
- Dyson, H.J., Rance, M., Houghten, R.A., Wright, P.E., and Lerner, R.A. 1988. Folding of immunogenic peptide fragments of proteins in water solution. II. The nascent helix. J. Mol. Biol. 201 201–217. [DOI] [PubMed] [Google Scholar]
- Feese, M.D., Comolli, L., Meadow, N.D., Roseman, S., and Remington, S.J. 1997. Structural studies of the Escherichia coli signal transducing protein IIAGlc: Implications for target recognition. Biochemistry 36 16087–16096. [DOI] [PubMed] [Google Scholar]
- Fernandez, C., Hilty, C., Wider, G., and Wüthrich, K. 2002. Lipid-protein interactions in DHPC micelles containing the integral membrane protein OmpX investigated by NMR spectroscopy. Proc. Natl. Acad. Sci. 99 13533–13537. [DOI] [PMC free article] [PubMed] [Google Scholar]
- Fieulaine, S., Morera, S., Poncet, S., Mijakovic, I., Galinier, A., Janin, J., Deutscher, J., and Nesslerm S. 2002. X-ray structure of a bifunctional protein kinase in complex with its protein substrate HPr. Proc. Natl. Acad. Sci. 99 13437–13441. [DOI] [PMC free article] [PubMed] [Google Scholar]
- Garrett, D.S., Powers, R., Gronenborn, A.M., and Clore, G.M. 1991. A common sense approach to peak picking two-, three- and four-dimensional spectra using automatic computer analysis of contour diagrams. J. Magn. Reson. 95 214–220. [DOI] [PubMed] [Google Scholar]
- Garrett, D.S., Seok, Y.-J., Peterkofsky, A., Gronenborn, A., and Clore, G.M. 1999. Solution structure of the 40,000 Mr phosphoryl transfer complex between the N-terminal domain of enzyme I and HPr. Nature Struct. Biol. 6 166–173. [DOI] [PubMed] [Google Scholar]
- Griesinger, C., Otting, G., Wüthrich, K., and Ernst, R.R. 1988. Clean TOCSY for proton spin system identification in macromolecules. J. Am. Chem. Soc. 110 7870–7872. [Google Scholar]
- Hartel, A.J., Lankhorst, P.P., and Altona, C. 1982. Thermodynamics of stacking and of self-association of the dinucleoside monophosphate m2(6)A-U from proton NMR chemical shifts: Differential concentration temperature profile method. Eur. J. Biochem. 129 343–357. [DOI] [PubMed] [Google Scholar]
- Henry, G.D. and Sykes, B.D. 1994. Methods to study membrane protein structure in solution. Methods Enzymol. 239 515–535. [DOI] [PubMed] [Google Scholar]
- Herzberg, O. and Klevit, R. 1994. Uraveling a bacterial hexose transport pathway. Curr. Opin. Struct. Biol. 4 814–822. [DOI] [PubMed] [Google Scholar]
- Jeener, J., Meier, B.H., Bachmann, P., and Ernst, R.R. 1979. Investigation of exchange processes by two-dimensional NMR spectroscopy. J. Chem. Phys. 71 4546–4553. [Google Scholar]
- Johnson, J.E. and Cornell, R.B. 1999. Amphitropic proteins: Regulation by reversible membrane interactions. Mol Membr Biol. 16 217–235. [DOI] [PubMed] [Google Scholar]
- Karplus, P.A. 1997. Hydrophobicity regained. Protein Sci. 6 1302–1307. [DOI] [PMC free article] [PubMed] [Google Scholar]
- Koradi, R., Billeter, M., and Wüthrich, K. 1996. MOLMOL: A program for display and analysis of macromolecular structures. J. Mol. Graphics 14 51–55. [DOI] [PubMed] [Google Scholar]
- Marion, D., Ikura, M., Tschudin, R., and Bax, A. 1989. Rapid recording of 2D NMR spectra without phase cycling. Application to the study of hydrogen exchange in proteins. J. Magn. Reson. 85 393–399. [Google Scholar]
- Markley, J.L., Bax, A., Arata, Y., Hilbers, C.W., Kaptein, R., Sykes, B.D., Wright, P.E., and Wüthrich, K. 1998. Recommendations for the presentation of NMR structures of proteins and nucleic acids. IUPAC-IUBMB-IUPAB Inter-Union Task Group on the Standardization of Data Bases of Protein and Nucleic Acid Structures Determined by NMR Spectroscopy. J. Biomol. NMR 12 1–23. [DOI] [PubMed] [Google Scholar]
- McDonnell, P.A. and Opella, S.J. 1993. Effect of detergent concentration on multidimensional solution NMR spectra of membrane proteins in micelles. J. Magn. Reson. B102 120–125. [Google Scholar]
- Meadow, N.D., Coyle, P., Komoryia, A., Anfinsen, C.B., and Roseman, S. 1986. Limited proteolysis of IIIGlc, a regulatory protein of the phosphoenolpyruvate:glycose phosphotransferase system, by membrane-associated enzymes from Salmonella typhimurium and Escherichia coli. J. Biol. Chem. 261 13504–13509. [PubMed] [Google Scholar]
- Nilges, M., Gronenborn, A.M., Brünger, A.T., and Clore, G.M. 1988. Determination of three-dimensional structures of proteins by simulated annealing with interproton distance restraints. Application to crambin, potato carboxypeptidase inhibitor and barley serine proteinase inhibitor 2. Protein Eng. 2 27–38. [DOI] [PubMed] [Google Scholar]
- Novotny, M.J., Frederickson, W.L., Waygood, E.B., and Saier, Jr., M.H. 1985. Allosteric regulation of glycerol kinase by enzyme IIIglc of the phosphotransferase system in Escherichia coli and Salmonella typhimurium. J. Bacteriol. 162 810–816. [DOI] [PMC free article] [PubMed] [Google Scholar]
- Otting, G., Widmer, H., Wagner, G., and Wüthrich, K. 1986. Origin of t1 and t2 ridges in 2D NMR spectra and procedures for suppression. J. Magn. Reson. 66 187–193. [Google Scholar]
- Pelton, J.G., Torchia, D.A., Meadow, N.D., Wong, C.Y., and Roseman, S. 1991. Secondary structure of the phosphocarrier protein IIIGlc, a signal-transducing protein from Escherichia coli, determined by heteronuclear three-dimensional NMR spectroscopy. Proc. Natl. Acad. Sci. 88 3479–3483. [DOI] [PMC free article] [PubMed] [Google Scholar]
- Peterkofsky, A., Reizer, A., Reizer, J., Gollop, N., Zhu, P.-P., and Amin, N. 1993. Bacterial adenylyl cyclases. Prog. Nucleic Acid Res. Mol. Biol. 44 31–65. [DOI] [PubMed] [Google Scholar]
- Postma, P.W., Lengeler, J.W., and Jacobson, G.R. 1996. Phosphoenolpyruvate: carbohydrate phosphotransferase systems. In Escherichia coli and Salmonella: Cellular and molecular biology (ed. F.C. Neidhardt.), pp. 1149–1174. ASM Press, Washington, DC.
- Rance, M., Sørensen, O.W., Bodenhausen, G., Wagner, G., Ernst, R.R., and Wüthrich, K. 1983. Improved spectral resolution in COSY 1H NMR spectra of proteins via double quantum filtering. Biochem. Biophys. Res. Comm. 117 479–485. [DOI] [PubMed] [Google Scholar]
- Rizo, J., Blanco, F.J., Kobe, B., Bruch, M.D., and Gierasch, L.M. 1993. Conformational behavior of Escherichia coli OmpA signal peptides in membrane mimetic environments. Biochemistry 32 4881–4894. [DOI] [PubMed] [Google Scholar]
- Robillard, G.T. and Broos, J. 1999. Structure/function studies on the bacterial carbohydrate transporters, enzymes II, of the phosphoenolpyruvate-dependent phosphotransferase system. Biochim. Biophys. Acta 1422 73–104. [DOI] [PubMed] [Google Scholar]
- Schwieters, C.D., Kuszewski, J., Tjandra, N., and Clore, G.M. 2003. The Xplor-NIH NMR molecular structure determination package. J. Magn. Reson. 160 65–73. [DOI] [PubMed] [Google Scholar]
- Smallcombe, S.H., Patt, S.L., and Keifer, P.A. 1995. A WET solvent suppression and its applications to LC NMR and high-resolution NMR spectroscopy. J. Magn. Reson. A117 295–303. [Google Scholar]
- Sondej, M., Weinglass, A.B., Peterkofsky, A., and Kaback, H.R. 2002. Binding of enzyme IIAGlc, a component of the phosphoenolpyruvate:sugar phosphotransferase system, to the Escherichia coli lactose permease. Biochemistry 41 5556–5565. [DOI] [PubMed] [Google Scholar]
- Wang, G. 2002. How the lipid-free structure of the N-terminal truncated human apoA-I converts to the lipid-bound form: New insights from NMR and X-ray structural comparison. FEBS Lett. 529 157–161. [DOI] [PubMed] [Google Scholar]
- Wang, G., Pierens, G.K., Treleaven, W.D., Sparrow, J.T., and Cushley, R.J. 1996a. Conformations of human apolipoprotein E(263–286) and E(267–289) in aqueous solutions of sodium dodecyl sulfate by CD and 1H NMR. Biochemistry 35 10358–10366. [DOI] [PubMed] [Google Scholar]
- Wang, G., Treleaven, W.D., and Cushley, R.J. 1996b. Conformation of human serum apolipoprotein A-I(166–185) in the presence of sodium dodecyl sulfate or dodecylphosphocholine by 1H-NMR and CD. Evidence for specific peptide-SDS interactions. Biochim. Biophys. Acta 1301 174–184. [DOI] [PubMed] [Google Scholar]
- Wang, G., Louis, J.M., Sondej, M., Seok, Y.-J., Peterkofsky, A., and Clore, G.M. 2000a. Solution structure of the phosphoryl transfer complex between the signal transducing proteins HPr and IIAglucose of the Escherichia coli phosphoenolpyruvate:sugar phosphotransferase system. EMBO. J. 19 5635–5649. [DOI] [PMC free article] [PubMed] [Google Scholar]
- Wang, G., Peterkofsky, A., and Clore, G.M. 2000b. A novel membrane anchor function for the N-terminal amphipathic sequence of the signal-transducing protein IIAGlucose of the Escherichia coli phosphotransferase system. J. Biol. Chem. 275 39811–39814. [DOI] [PubMed] [Google Scholar]
- Wishart, D.S., Sykes, B.D., and Richards, F.M. 1991. Relationship between nuclear magnetic resonance chemical shift and protein secondary structure. J. Mol. Biol. 222 311–333. [DOI] [PubMed] [Google Scholar]
- Wüthrich, K. 1986. NMR of proteins and nucleic acids. Wiley, NY.