

Abstract
Determination of precise and accurate protein structures by NMR generally requires weeks or even months to acquire and interpret all the necessary NMR data. However, even medium-accuracy fold information can often provide key clues about protein evolution and biochemical function(s). In this article we describe a largely automatic strategy for rapid determination of medium-accuracy protein backbone structures. Our strategy derives from ideas originally introduced by other groups for determining medium-accuracy NMR structures of large proteins using deuterated, 13C-, 15N-enriched protein samples with selective protonation of side-chain methyl groups (13CH3). Data collection includes acquiring NMR spectra for automatically determining assignments of backbone and side-chain 15N, HN resonances, and side-chain 13CH3 methyl resonances. These assignments are determined automatically by the program AutoAssign using backbone triple resonance NMR data, together with Spin System Type Assignment Constraints (STACs) derived from side-chain triple-resonance experiments. The program AutoStructure then derives conformational constraints using these chemical shifts, amide 1H/2H exchange, nuclear Overhauser effect spectroscopy (NOESY), and residual dipolar coupling data. The total time required for collecting such NMR data can potentially be as short as a few days. Here we demonstrate an integrated set of NMR software which can process these NMR spectra, carry out resonance assignments, interpret NOESY data, and generate medium-accuracy structures within a few days. The feasibility of this combined data collection and analysis strategy starting from raw NMR time domain data was illustrated by automatic analysis of a medium accuracy structure of the Z domain of Staphylococcal protein A.
Keywords: Automated NMR data analysis, deuteration, minimal NMR constraints, selective labeling, structural genomics
Following the success of the genomic sequencing projects, an International Structural Genomics Initiative (www.isgo.org) has been established to investigate the feasibility and value of high-throughput approaches for determining three-dimensional (3D) structures of thousands of gene products (Montelione and Anderson 1999; Burley 2000; Kim 2000; Montelione et al. 2000; Terwilliger 2000; Chance et al. 2002). Although X-ray crystallography plays the leading role in determining protein structures in these initiatives, NMR methods continue to make unique and important contributions in this challenging area (Montelione et al. 2000; Prestegard et al. 2001; Kennedy et al. 2002). The high-throughput potential of NMR structure determination has been discussed in view of recent advances in sample preparation, NMR hardware, data analysis software, as well as developments in measuring new types of constraint data (Wider and Wüthrich 1999; Goto and Kay 2000; Montelione et al. 2000; Prestegard et al. 2001; Kennedy et al. 2002). In particular, new cryogenic probe and high magnetic field spectrometer technologies dramatically reduce data collection times needed to acquire NMR data sufficient for structure analysis (Kennedy et al. 2002; Monleon et al. 2002). Experiments that conventionally require days of data collection can now be completed in hours, creating a potentially valuable role for NMR in high-throughput protein structure production.
The use of triple resonance experiments on uniformly 15N, 13C-labeled samples provides a general approach for protein structure analysis by NMR (Montelione and Wagner 1989,Montelione and Wagner 1990; Ikura et al. 1990; Kay et al. 1990). However, for fully protonated proteins, relaxation processes decrease the efficiency of magnetization transfers. One of the important approaches to limit these relaxation pathways is to use perdeuterated samples (Metzler et al. 1996; Gardner and Kay 1998; Goto and Kay 2000; Medek et al. 2000). NMR experiments recorded on such samples have significantly improved sensitivity and resolution (Grzesiek et al. 1993; Yamazaki et al. 1994; Gardner et al. 1997). However, the absence of aliphatic and aromatic protons in fully deuterated samples presents serious challenges for structure determination using conventional NMR methods that depend on nuclear Overhauser effect (NOE) interactions to provide long-range distance constraints needed to determine global protein folds. A subsequent improved strategy is to protonate selective methyl groups in otherwise perdeuterated protein samples (Metzler et al. 1996; Rosen et al. 1996; Goto et al. 1999; Goto and Kay 2000). This approach retains the advantages of improved sensitivity and resolution through partial deuteration, while often providing sufficient numbers and distributions of NOE distance constraints to determine a protein’s chain fold. Using selective methyl protonated (13CH3), 2H-, 15N-, 13C-labeled samples and manual analysis approaches, several protein structures ranging in size from 14 to 42 kD have been determined with low to medium accuracy (Gardner et al. 1997; Aghazadeh et al. 1998; Berardi et al. 1999; Medek et al. 2000; Mueller et al. 2000).
In addition to the conventional NOESY experiments, NMR experiments detecting residual dipolar couplings (RDCs) and scalar coupling interactions across hydrogen bonds also provide important constraints for structure determination (Tolman et al. 1995; Tjandra and Bax 1997; Prestegard 1998; Cordier et al. 1999; Cornilescu et al. 1999). These data can be acquired quite efficiently in a rather short period of time, and therefore are suitable for fast structure generation. In fact, RDC data have been used as primary NMR constraints for rapid determination of protein global folds (Delaglio et al. 2000; Fowler et al. 2000; Hus et al. 2000; Andrec et al. 2001, 2002; Rohl and Baker 2002). Although such progress in “medium-accuracy” NMR structure analysis without using NOE data is very promising and encouraging, NOE interactions contain rich structural constraints, and should be applied in structure generation if they can be easily measured and interpreted.
NMR software development is another critical area of scientific and technological development necessary for achieving high-throughput NMR structure production. Ongoing development has produced software for rapid automated and semiautomated analysis of protein NMR assignments and structures (Mumenthaler et al. 1997; Nilges et al. 1997; Zimmerman et al. 1997; Moseley et al. 2001; Gronwald et al. 2002; Hermann et al. 2002; Huang et al. 2003; for a recent review, see Moseley and Montelione, 1999). In our own lab, we have organized a suite of software for NMR data analysis that includes software developed by other groups (e.g., NMRPipe for NMR spectral processing [Delaglio et al. 1995], Sparky [Goddard and Kneller, 2000] for interactive spectral analysis) and software developed by our own lab (e.g., AutoAssign [Zimmerman et al. 1997; Moseley et al. 2001] for analysis of protein resonance assignments, AutoStructure [Huang, 2001; Huang et al. 2003] for analysis and assignments of NOESY spectra.) However, one of the key challenges in automated analysis of NMR spectra is the quality and completeness of the NMR data. Moreover, it remains to be demonstrated that these technologies can be successfully integrated in a high-throughput structure analysis process.
The success of automated analysis methods depends on a match between data collection strategy and data analysis algorithms. Based on the above technical advances in the field of protein NMR, and motivated by recent successes of obtaining correct folds by manual analysis of sparse NMR data (Gardner et al. 1997; Medek et al. 2000), we are developing largely automated approaches for determining medium-accuracy protein structures from minimal NMR constraint sets. This strategy utilizes partially deuterated, 13C-, 15N-enriched proteins with selective protonation of side-chain methyl groups (13CH3) of aliphatic residues (Goto et al. 1999) to generate spectra suitable for rapid and automated analysis.
In this report, we present results applying this strategy for rapid determination of the accurate fold of the Z domain from Staphylococcal protein A, for which a high-accuracy structure has been previously reported (Tashiro et al. 1997). We conclude that the partial deuteration strategy is useful and robust for automated analysis using software tailored to exploit the particular information available in these high-quality spectra. In the case of the Z domain, the time required for NMR data collection was under 12 d, and would be much shorter if cryogenic probe technology were available for this study. Because of the high quality and completeness of the resulting data, the time required for processing, peak picking, and analysis of these data was only a few days. In addition to obtaining a “medium-accuracy” structure for the Z domain from raw free-induction decay (FID) data, we also demonstrate that this “minimal constraint strategy” can provide sufficient information for defining the correct folds of several proteins, using simulated constraints derived from published 3D structures and NMR constraint lists.
Results
NMR data collection
Table 1 summarizes the key data collection and processing parameters used in obtaining NMR spectra in this study, and the measurement times used to acquire each spectrum. The total data collection time for this set of 12 NMR spectra was 250 h (10.5 d). The triple-resonance backbone spectra were processed with the same digital resolutions in matching dimensions. Peak lists with intensities were generated by automated peak picking followed by interactive manual editing with Sparky. The time required for processing, peak picking, and analyzing these spectra was about 2 d. These twelve raw data files (free induction decays) and resulting peak lists have been archived in the BioMagResDB (accession number 5656).
Table 1.
NMR experiments for rapid fold determination
| NMR spectra | No. of points collected (t3, t2, t1) | No. of points after linear prediction and zero filling | No. of scans | Spectral width (Hz) (ω3, ω2, ω1) | Recycle delaya (s) | Collection time (h:min) | Mixing time (msec) |
| 15N-1H HSQC | 2048, 128 | 2048, 256 | 8 | 5500, 1500 | 1.19 | 0:22 | |
| HNCO | 1024, 42, 50 | 1024, 512, 512 | 4 | 6500, 1500, 2000 | 1.08 | 11:04 | |
| HNcaCO | 1024, 34, 50 | 1024, 512, 512 | 16 | 6500, 1500, 2000 | 0.98 | 33:44 | |
| HNCACB | 1024, 36, 55 | 1024, 512, 512 | 8 | 6500, 1500, 12066 | 1.08 | 21:02 | |
| HNcoCACB | 1024, 37, 55 | 1024, 512, 512 | 8 | 6500, 1500, 12066 | 1.08 | 22:04 | |
| 13C-1H HSQC | 1984, 400 | 1984, 800 | 4 | 5500, 10000 | 1.18 | 1:00 | |
| hCCcoNH-TOCSY | 1024, 40, 48 | 1024, 256, 256 | 8 | 6500, 1500, 10257 | 1.08 | 20:42 | 12 |
| HcccoNH-TOCSY | 1024, 40, 48 | 1024, 256, 256 | 16 | 6493, 2200, 6500 | 0.88 | 34:47 | 12 |
| 3D 15N-NOESY | 1024, 40, 64 | 1024, 512, 512 | 8 | 6493, 2200, 6492 | 1.08 | 33:49 | 350 |
| 3D 13C-NOESY | 1024, 44, 64 | 1024, 512, 512 | 8 | 6500, 12066, 6500 | 1.08 | 37:48 | 350 |
| 15N-1H HSQC-IPAP | 2048, 128 | 2048, 2048 | 16 | 5500, 1500 | 1.10 | 5:55 | |
| 3D HNCO J(C′-Cα) | 1024, 40, 128 | 1024, 256, 2048 | 4 | 5500, 1500, 2000 | 1.09 | 28:00 |
a Recycle delay = acquisition time plus interincrement delay.
Using a 600-MHz NMR spectrometer system, the 15N-1H HSQC spectrum of the Z domain is generally well resolved with only a few (six) spin systems exhibiting overlapping 15N-HN correlation peaks. The 13C-1H HSQC spectrum (Fig. 1 ▶) demonstrates that all isopropyl methyl groups of Val, Leu, and δ methyl groups of Ile residues of this Z domain sample are highly protonated. Compared with the 13C-1H HSQC of a fully protonated sample, all other proton sites in the protein are highly deuterated, though a small degree (<5%) of protonation was detectable for Cβ sites of some Asp, Asn, and Ala residues. Most of the methyl 13C-1H correlation peaks of the Z domain are well resolved, although two pairs of methyl 13C-1H correlation peaks are overlapped.
Figure 1.
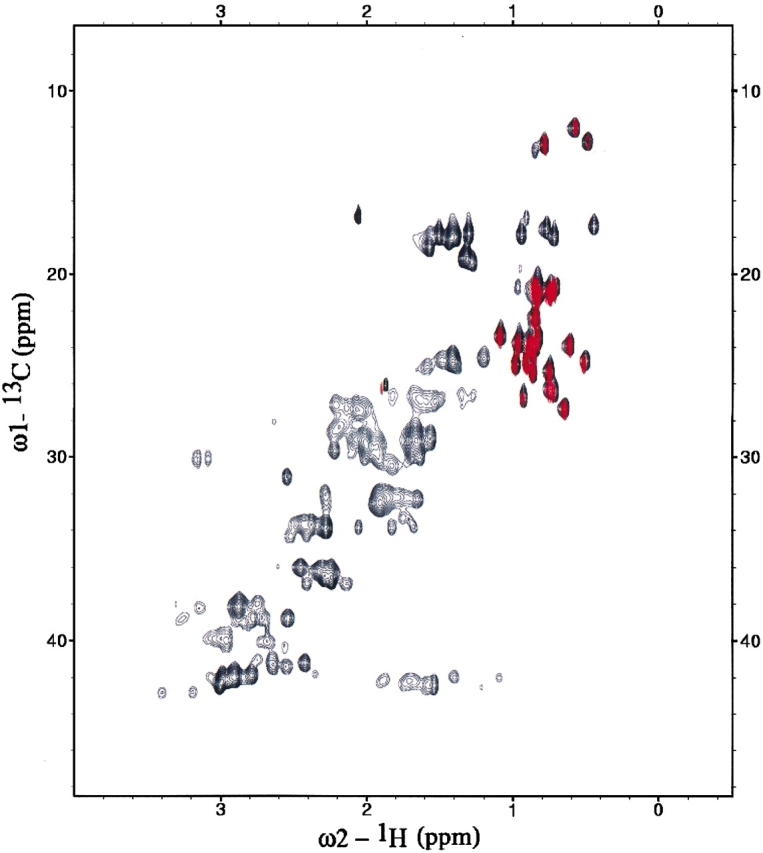
13C-1H HSQC spectrum of Z domain (at 600 MHz). The 13C-1H HSQC spectrum (red) of 13C, 15N, 2H-enriched, 13C-1H methyl protonated Z domain used in this study is overlaid onto the 13C-1H HSQC spectrum (black) of a fully protonated 13C,15N-enriched sample. The isopropyl methyl groups of all Val, Leu, and δ methyl groups of all Ile (top right) are highly protonated, while the rest of the aliphatic and aromatic carbons are primarily deuterated.
Automated resonance assignments using spin system type assignment constraints (STACS)
Backbone 1H, 15N, 13C and side-chain 13Cβ resonance assignments were obtained by automated analysis of these data using the program AutoAssign (Moseley et al. 2001). In this strategy, the primary role of HcccoNH-TOCSY and hCCcoNH-TOCSY data (Montelione et al. 1992) is to provide assignments for side-chain 1H and 13C methyl resonances. On the other hand, these spectra also contain valuable information for spin system identification and typing, because only side-chain methyl groups of Val, Leu, and Ile(δ) are protonated in this deuterated, selective methyl protonated sample (Fig. 1 ▶). Therefore, the AutoAssign program was modified to exploit constraints describing this spin-system typing information to guide the resonance assignment analysis. Briefly, all peaks observed in the 2D HN-N projection of 3D hCCcoNH-TOCSY and/or HcccoNH-TOCSY, which could be mapped to peaks identified in 15N-1H HSQC spectrum, were constrained by Spin System Type Assignment Constraints (STACs) to N-HN resonances of residues following Leu, Val, or Ile residues in the primary sequence. When such information is utilized together with interresidue connections established by HNcoCACB and HNCACB data, the N-HN spin system roots belonging to the Leu, Val, and Ile residues themselves could also be identified.
By identifying N-HN spin system roots belonging to Val, Leu, Ile (intraresidue STACi constraints), and/or residues following Val, Leu, Ile (sequential STACs constraints), degeneracy in typing and mapping is significantly reduced. The use of the STAC algorithm significantly improves the typing and mapping steps in the AutoAssign program, resulting in more accurate and robust determination of the sequence specific resonance assignments. The new STAC functionality in AutoAssign, implemented here for the purpose of exploiting hCCcoNH-TOCSY and/or HcccoNH-TOCSY information for constraining possible spin system assignments, is quite general and will allow many kinds of prior knowledge or spin-system-specific spectral features to be used as constraints in the automated analysis of resonance assignments; for example, the data structures and algorithms of STAC constraints can also be used to incorporate information from selective-isotope labeling and amino acid type-selective experiments (Feng et al. 1996; Schubert et al. 1999).
Figure 2 ▶ summarizes the results of AutoAssign analysis of these Z domain data. The assignments are nearly complete (except for the spin systems of residues A8, Q9, and H10). As shown in Figure 2 ▶, the Cα, Cβ and C′ connectivity map is nearly complete, and the three α-helices of the Z domain are easily identified using chemical shift index (CSI) analysis (Wishart and Sykes 1994). N-HN spin system roots belonging to and posterior to Val, Leu, and Ile residues are all correctly identified. The assignments were also checked and extended by manual examination of the triple-resonance spectra using Sparky. After data processing and peak picking, the process of determining these backbone and side-chain methyl resonance assignments was completed within a few hours. The side-chain amide resonances of Asn and Gln residues were then manually identified and connected to backbone Cα/Cβ of Asn or Cβ of Gln residues using primarily HNcoCACB data. The final assignments of backbone, Asn/Gln side-chain NH2 and Val/Leu/Ile methyl resonances were then validated by Assignment Validation Suite (AVS) software (H.N.B. Moseley and G. T. Montelione, in prep.) using statistical parameters derived from BMRB database (Seavey et al. 1991). These automatically determined resonance assignments are essentially identical to the published resonance assignments for the Z domain (BMRB accession number 4023), which have themselves been validated by self-consistent analysis of NOESY data and 3D structure calculations (Tashiro et al. 1997).
Figure 2.
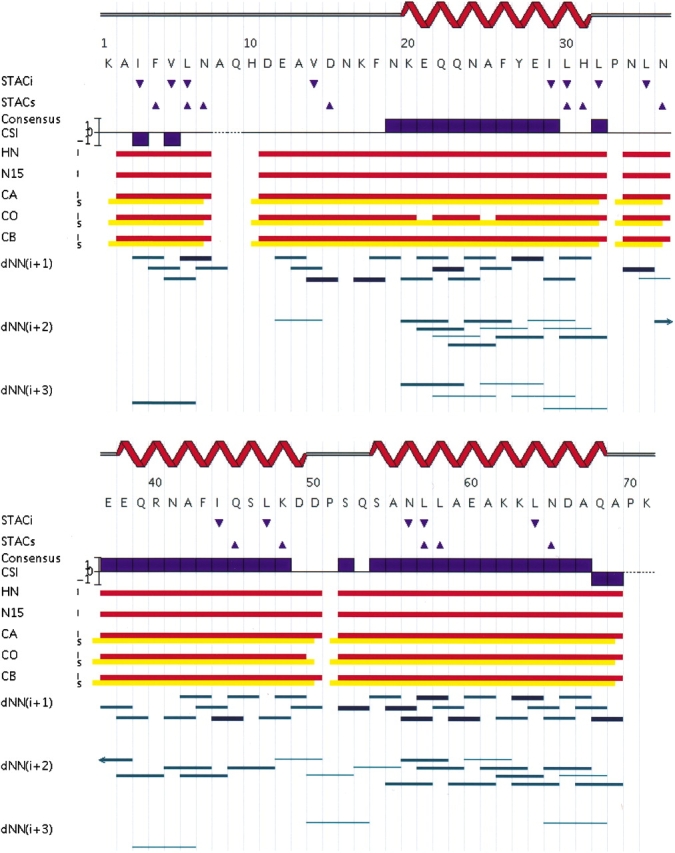
Sequential connectivity map summarizing the results of automated backbone resonance assignments determined by AutoAssign. Intra (i, red) and sequential (s, yellow) connectivity data used by AutoAssign to establish resonance assignments at each sequence position are shown. Secondary structure information derived automatically from combined analysis of Cα, Cβ, and C′ chemical shift (CSI) and NOE data is also plotted along the protein sequence. Shown in the figure are also i to i + 1, i + 2, and i + 3 HN-HN NOE connections determined by an initial AutoStructure analysis (run with RDC data) that was used to further validate these assignments; the strength (intensity) of the corresponding NOE interactions are indicated by line thickness. Residues with intra (down triangles) STACi and sequential (up triangles) STACs constraints (derived from hCCcoNH-TOCSY and HcccoNH-TOCSY spectra) specifying N–HN roots belonging to or following Val, Leu, Ile residues, respectively, are also indicated.
Value of the STAC algorithm
In this study, we found that when HNcaCO data were not used some 20% of the assignments derived without STAC functionality were incorrect. Inclusion of STAC constraints resulted in essentially 100% correct backbone resonance assignments, together with many side-chain methyl resonance assignments. When the HNcaCO data were used without STACs, the automated analysis provided 97% correct assignments, which again was improved by inclusion of the STAC constraints. However, even a small improvement in resonance assignments could potentially have a large effect in the accuracy of structures generated in this “minimal-constraint” strategy, because every correct constraint (especially long-range constraints) is valuable. Moreover, because the density of long-range constraints is low, even a few incorrect assignments can severely distort the resulting structure. From these results we conclude that the new STAC algorithms of AutoAssign incorporate into the automated analysis process information that is critical for this minimal constraint strategy.
NOESY and RDC measurements
As mentioned above, the use of samples with partial deuteration improves both the sensitivity and resolution of NOESY data. NOESY spectra of this partially deuterated sample exhibited narrower line widths and fewer overlapping peaks than spectra recorded on a fully protonated 13C, 15N-enriched sample (data not shown). The spectral quality is also significantly improved by using longer than usual NOESY mixing times. The application of longer NOESY mixing times for such deuterated protein samples has been documented previously in the literature; other groups have reported best results using mixing times of 200–350 msec (Grzesiek et al. 1995; Venters et al. 1995; Medek et al. 2000). The absence of aliphatic protons minimizes the number of spin-diffusion pathways available to proton HN magnetization, thereby allowing the use of longer mixing times (Venters et al. 1995). In addition, in AutoStructure calibrations all long-range NOE-based distance constraints are uniformly set to <5 Å, minimizing problems due to differential relaxation of amide and methyl protons in such long mixing time spectra.
We explored the effect of NOESY mixing times on the spectral quality by collecting a series of high-resolution 2D H-H planes of 3D 13C-edited and 15N-edited NOESY spectra. A set of 20 peaks arising from medium- and long-range interactions in the known 3D structure of the Z domain was selected in the 350-msec mixing-time spectrum, and the corresponding intensities in individual spectra recorded with different mixing times were studied. For 15N-edited NOESY spectra, 6 of the 20 selected peaks were not observed in spectra recorded with mixing times of 75 and 150 msec. Likewise, four and two selected peaks were not observed in 13C-edited spectra acquired using 70- and 200-msec mixing times, respectively. The intensities of several of these peaks in 2D NOESY spectra collected with mixing time of 500 msec were significantly attenuated. Based on this analysis, a mixing time of 350 msec was chosen for collecting 3D 13C-edited and 15N-edited NOESY data used in this 3D structure determination. Significantly, HN-HN NOEs between the helices of the Z domain were observed in these NOESY spectra. We believe that the mixing time used here provides an optimum number of structurally valuable NOE information without deleterious effects of spin diffusion in this perdeuterated Z domain sample, which has an isotropic rotational correlation time of ∼7 nsec (G.T. Montelione, in prep.).
For a partially deuterated protein like this Z domain sample, the one bond HN-N and Cα-C′ RDCs are rapid and straightforward to measure. A total of 82 residual dipolar couplings (33 1DNH, 49 1DCC) were determined from the differences in resonance splittings between isotropic and partially aligned samples of the Z domain, as described in the Materials and Methods.
Automated 3D structure calculations
AutoStructure calculations were carried out both with (using DYANA and CNS with RDC constraints in each cycle of AutoStructure refinement) and without (using DYANA alone) the RDC data. Table 2 summarizes the distributions of distance constraints obtained in each of these processes of calculations. In the former case, AutoStructure identified 257 conformationally restricting distance constraints, while when the RDC data was excluded the process identified only 245 conformationally restricting distance constraints. In both cases, the analysis identified ∼50 long-range distance constraints.
Table 2.
Summary of spectral and structural statistics for the Z domain
| Without RDC | With RDC | |||
| NOESY spectral dataa | ||||
| N15 | C13 | N15 | C13 | |
| Number of peaks | 291 | 68 | 291 | 68 |
| Number of “assignable” peaks | 286 | 65 | 286 | 65 |
| Number of peaks assigned | 257 | 56 | 262 | 61 |
| Data collection time (h) | 216 | 250 | ||
| Distance constraints | ||||
| Total | 245 | 257 | ||
| Intraresidue (i = j) | 34 | 37 | ||
| Sequential (|i − j| = 1) | 73 | 77 | ||
| Medium range (1 < |i − j| ≤ 5) | 85 | 97 | ||
| Long range (|i − j| > 5) | 54 | 46 | ||
| H-bond constraints (2 per H-bond) | 60 | 62 | ||
| Dihedral angle constraints | 78 | 78 | ||
| Residual dipolar couplings | 0 | 82 | ||
| Total number of constraints | 386 | 479 | ||
| Number of constraints per residueb | 6 | 8 | ||
| ProCheck analysis of φ, ξ angles | Residues 14–71b | Core residuesc | Residues 14–71b | Core residuesc |
| Most favored regions (%) | 84.4 | 96.7 | 76.0 | 92.2 |
| Additional allowed (%) | 11.2 | 3.3 | 17.1 | 7.8 |
| Generously allowed (%) | 1.7 | 0 | 4.5 | 0 |
| Disallowed (%) | 2.7 | 0 | 2.4 | 0 |
| Distance violations | ||||
| 0.1–0.2 Å | 0.15 | 5.5 | ||
| >0.2 Å | 0 | 1.2 | ||
| Dihedral angle violations | ||||
| >1° | 0 | 0 | ||
| Backbone RMSD values | ||||
| Residues 14–71b | 1.9 ± 0.3 | 2.1 ± 0.6 | ||
| Core residuesc | 0.7 ± 0.3 | 0.7 ± 0.3 | ||
| Backbone RMSD to PDB 2SPZ | ||||
| Residues 14–71b | 2.9 ± 0.4 | 3.0 ± 0.7 | ||
| Core Residuesc | 1.8 ± 0.4 | 1.4 ± 0.4 | ||
a N15 and C13 refer to peak lists generated from 3D 15N-edited and 13C-edited NOESY spectra, respectively.
b Only the structure of residues 14 to 71 were analyzed in these calculations, as polypeptide segment of residues 1–13 of the Z domain is dynamically disordered (Tashiro et al. 1997).
c The backbone conformations of residues 20–31, 38–49, and 54–68 are well defined, and thus referred to as the “core residues” for these statistical analyses.
AutoStructure identifies hydrogen bonds based on analysis of characteristic NOE-based contact patterns and slow amide hydrogen/deuterium (H/D) exchange data using rules described in the Materials and Methods section. Using this algorithm, AutoStructure identified about 60 intrahelical hydrogen bond constraints (two per H-bond). These hydrogen bond constraints are not essential for the Z domain fold determinations described in this work, due to its all α-helical structure. However, the algorithms for identifying hydrogen bonds in AutoStructure are extremely important for registering and folding β-sheet structures (Huang 2001).
In a final set of calculations, the NOE-based distance constraints, hydrogen bonds, and dihedral angle constraints, identified by AutoStructure and summarized in Table 2, were used by CNS for structure calculations with or without the 82 RDC constraints. For the calculations without RDC constraints, structures were calculated based on 386 total conformational constraints (six constraints per residue), while in the calculations with the 82 RDC constraints, 479 total conformational constraints (eight per residue) were used. No long-range NOEs were observed between the first 15 residues, which are known to be dynamically disordered (Tashiro et al. 1997), and the rest of the protein. In each of these calculations, 100 structures were generated from extended conformations, and the 20 with lowest values of the CNS target function (distance penalty plus conformational energy) were selected to represent the structure of the Z domain.
Analysis of the Z domain structures
The resulting ensembles of these minimal-constraint Z domain structures are shown in Figure 3 ▶, and compared to the backbone conformation of the published high-accuracy solution NMR structure (Tashiro et al. 1997). These structures generated with the minimal-constraint strategy exhibit few residual constraint violations and good structural convergence (Table 2). Ramachandran plot analysis of backbone dihedral angle distributions (Laskowski et al. 1993) shows that >90% of residues are in most-favored backbone conformation regions, with most of the remainder in “additionally allowed regions” for ordered residues. Some unfavorable φ, ξ backbone dihedral angle values are observed among the structures in polypeptide segments corresponding to surface loops.
Figure 3.
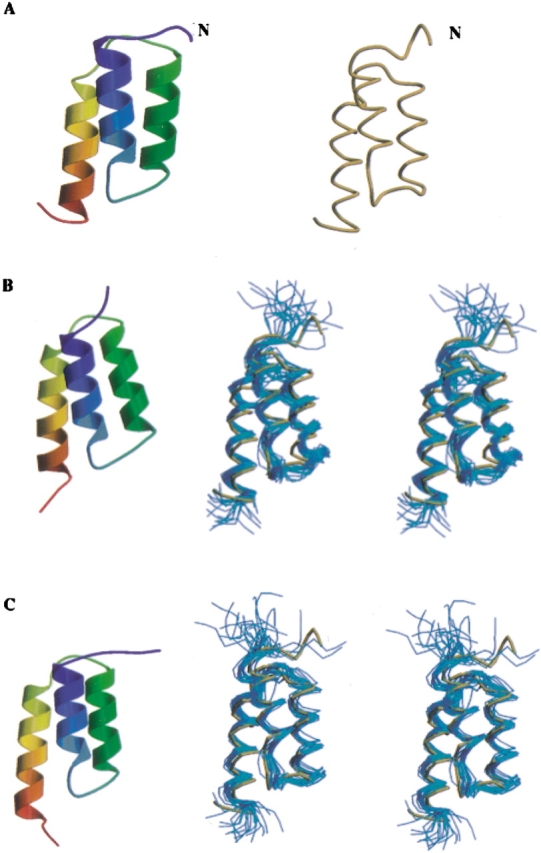
Ribbon representation and backbone trace of Z domain structures. (A) High- resolution solution NMR structure of Z domain (Tashiro et al. 1997; PDB ID 2SPZ). Structures generated automatically with the “minimal-constraint” strategy outlined in the text (B) without RDC and (C) with RDC data, superimposed on backbone structure of 2SPZ (gold).
A high-accuracy solution NMR structure of Z domain (Fig. 3A ▶) has been determined previously by manual analysis of resonance assignments, NOESY data, and other NMR data (Tashiro et al. 1997). This published structure is based on 671 conformational constraints, including essentially complete side-chain resonance assignments, obtained for a fully protonated uniformly 13C,15N-enriched sample. The backbone RMSD between the mean coordinates of current “minimal constraint” structures and the published high-accuracy solution NMR structure are ∼3 Å. Considering only the core three-helical bundle residues, the RMSD between these minimal-constraint (Fig. 3B,C) and the published high-accuracy (Fig. 3A ▶, and gold backbone traces in Fig. 3B,C ▶) structures are only 1.4–1.8 Å (Table 2). While the minimal-constraint structures determined with and without RDC data are quite similar to one another (with 1.5 Å RMSD between mean coordinates of residues 20 to 68), the minimal constraint structure determined and refined with the RDC data is somewhat better converged and more accurate relative to the published high-accuracy structure (Table 2; Fig. 3 ▶). However, considering that even for well-defined core residues the RMSDs within the computed structure ensemble (0.7 ± 0.3 Å) are smaller than the RMSD of these averaged coordinates to the published Z domain structure (1.4 ± 0.4 Å) suggests that some inaccuracies in NOE assignments that bias the resulting structure persist. On the other hand, the relatively good agreement in backbone structure between the published high-accuracy structure of the Z domain and these “minimal constraint” structures (Fig. 3 ▶) demonstrates that such “medium-accuracy” backbone structures generated with these automated analysis methods can be quite accurate. These results show that the data collected using “minimal constraint” strategy coupled with automated analysis with AutoAssign and AutoStructure can rapidly generate accurate resonance assignments, secondary structures, and protein folds from raw time–domain NMR data.
Generalization to other fold topologies
Using real-time domain NMR data, the results of the previous section demonstrate that automated analysis of minimal constraint data can provide a medium accuracy backbone structure. It has been pointed out that the success of structure determination using selective methyl protonation depends on the secondary structure and topology of subject proteins, and can be especially difficult for highly helical proteins that lack of backbone–backbone interactions between secondary structure elements (Gardner et al. 1997). In this sense, the three-helical bundle Z domain structure is a particularly challenging demonstration.
To further explore whether this general “minimal constraint” strategy can be applied to proteins with different topologies, we also carried out calculations with minimal constraint lists simulated from known 3D protein structures, and with lists generated by editing archived experimental NMR constraint lists down to only the NOE interactions between backbone HN, side-chain HN, and side-chain methyl H atoms. These simulated NMR constraint sets were generated for six small proteins or domains ranging in size from 40 to 101 amino acid residues (listed in Table 3), which have been determined by NMR methods and for which NMR constraint lists have been deposited in the Protein Data Bank. These six test structures included two all-α, two all-β, and two α + β protein structures.
Table 3.
Analyses of constraints and structures for six proteins using simulated or archived, edited experimental “minimal NMR” data
| PDB ID | 1ERC | 2SPZ | 3MEF | 2EZM | 3GB1 | 1GHH |
| Length (#aa) | 40 | 58 | 69 | 101 | 56 | 81 |
| Structure class | α | α | β | β | α + β | α + β |
| Simulated constraint data | ||||||
| Distance constraint | 92 | 126 | 146 | 185 | 112 | 172 |
| Hydrogen bond | 21 | 32 | 23 | 41 | 27 | 46 |
| Dihedral angle | 52 | 78 | 52 | 108 | 74 | 111 |
| RDC (DNH, DCαC′) | 77 | 113 | 67c | 148 | 111 | 158 |
| RMSDa (Å) | 0.9 ± 0.3 | 2.0 ± 0.4 | 2.3 ± 0.4 | 3.1 ± 0.4 | 2.2 ± 0.8 | 2.7 ± 0.4 |
| Archived, edited, experimental constraint data | ||||||
| NOE constraints | 89 | 62 | 107 | 238 | 113 | 114 |
| Hydrogen bond | 21b | 32b | 34 | 37 | 30 | 46b |
| Dihedral angle | 52b | 78b | 52b | 131 | 102 | 122 |
| RDC (DNH, DCαC′) | 77b | 113b | 67b,c | 124 | 46 | 138 |
| RMSDa (Å) | 1.1 ± 0.3 | 2.3 ± 0.3 | 2.6 ± 0.3 | 2.0 ± 0.2d | 1.9 ± 0.3d | 3.4 ± 1.6 |
a Root-mean-square deviation (RMSD) between the average structure deposited at PDB and the best 5 (lowest CNS target function) out of 50 structures calculated using these minimal constraints.
b Simulated data were used because no corresponding experimental data were deposited at PDB.
c DNH RDC only.
d The number of experimental NOE (2EZM) or hydrogen bond (3GB1) constraints is larger than those generated by our conservative constraint simulations. Such differences often result in more accurate structures using the archived, edited experimental data.
For the six small proteins summarized in Table 3, distance constraints were simulated between backbone N, side-chain amide N, and side-chain methyl (Val, Leu, and Ile[δ]) C atoms with interatomic distances <4.5 Å using MOLMOL (Koradi et al. 1996). These lists were then edited to remove any intraresidue constraints. A 10% uncertainty was added to each of the generated distances, and these distances were then binned to 3.0, 4.0, and 5.0 Å classes, yielding the final upper bound distance constraints. We chose these criteria to simulate closely the NOE constraints that can be efficiently measured by NMR. Other simulated data include loose dihedral angle constraints (for regular secondary structures only) that could be derived from chemical shift information, backbone hydrogen bonds, and N–HN and Cα-C′ RDC data with uncertainties similar to those observed in the experimental study described above. The top half of Table 3 summarizes the constraint lists simulated from the atomic coordinates of the six small proteins. In each case, 50 conformers were calculated from the “minimal constraints” using CNS, and the “minimal constraint NMR structure” was represented by the five structures with lowest values of the CNS target function. As shown in Figure 4 ▶ and Table 3, these six tests provided “medium-accuracy” structures with backbone RMSDs of 0.9–3.1 Å compared with the coordinates from which they were derived. Similar results of fold determination using minimal constraint data have been described by other authors (Gardner et al. 1997; Clore et al. 1999).
Figure 4.

Structures determined by simulated or archived, edited experimental minimal NMR constraints. Coordinate sets for six proteins were taken from Protein Data Bank (PDB). Distance constraints were generated for all interatomic distances <4.5 Å involving amide (backbone N and side-chain N of Asn/Gln) and methyl C of Leu, Val, and Ile(δ). Dihedral angle restraints (for regular secondary structures only), backbone hydrogen bonds, and both N–HN and Cα–C′ RDC data were also back calculated from the atomic coordinates, as described in the text. These data sets are referred to as Simulated Constraint Data. A second set of constraint lists referred as Archived, Edited Constraint Data were generated by editing archived NMR constraint files deposited in PDB, to replace simulated distance constraints with NOE-derived distances between amide and methyl protons. Other simulated data were also replaced with experimental data where available, as described in the text. For each protein used in this analysis, the published high-resolution NMR structure (PDB structure) is shown along with representative structures from the ensembles generated with CNS using the Simulated Constraint Data or the Archived, Edited Constraint Data.
To provide a more realistic simulation of minimal constraint sets that could be generated for these six protein folds, a second set of “minimal constraints” were generated by replacing simulated data with actual constraints available as archived experimental NMR constraint files for these six proteins. These experimental constraint lists were obtained from the Protein Data Bank (PDB). The bottom half of Table 3 summarizes the distributions of these experimental constraints. These NOE constraints correspond only to NOE interaction arising from HN (backbone and side-chain NH2) and methyl protons (Val, Leu and Ile[δ]). In some cases, experimental RDC, hydrogen bond, and/or dihedral constraint data are also available in these archived constraint lists, while in other cases (indicated in the footnotes of Table 3), these additional constraint data were simulated from the known 3D structure. Again, 50 conformers were calculated from each of these archived, edited “experimental constraint” lists for each of the six proteins. Figure 4 ▶ and Table 3 summarize structural information for each of these six “minimal-constraint NMR structures,” in each case represented by the five structures with lowest values of the CNS target function. Again, using these edited archived experimental NMR constraint data as input to CNS, correct folds (RMSD of 1.1–3.4 Å) were obtained for all six proteins. In some cases, for various reasons related to the conservative approach we used in generating simulated constraints from atomic coordinates, the number of distance constraints in these edited, archived constraint lists was larger than those in the corresponding simulated constraint lists described above (Table 3), resulting in somewhat more accurate structures than those observed with the purely simulated data. Overall, these results support the view that medium accuracy backbone folds can often be determined for small proteins or domains when fairly complete sets of the minimal NMR data described here can be obtained.
Discussion
Rapid determination of protein folds has become attractive in recent years because it can quickly yield structural information for proteins, providing evolutionary insights and clues to biochemical functions. NMR data can be extremely valuable in this area because some experimental NMR constraints sufficient for defining protein folds can be acquired efficiently in a very short time. In this article, we have described an approach combining chemical shift, NOE, and RDC data obtained from a minimal set of NMR experiments with automation software to provide “medium-accuracy” protein backbone structures. For suitably isotopically labeled small proteins and using conventional NMR probes, this data collection and analysis can be carried out in less than 2 weeks. Including all of the processing, peak picking, and editing, the complete analysis of assignments and 3D structure required some 2 d. The remarkable success of this strategy for data collection and automated analysis is attributable in part to the high-quality NMR spectra that can be obtained for a deuterated, selective methyl protonated sample. Recently, we have also applied this “minimal-constraint” strategy to obtain the correct fold of a 147-residue methionine sulfoxide reductases from Bacillus subtilis (D. Zheng and G.T. Montelione, in prep.).
At this stage of our technology development it is not possible to carry out automated analysis of complete side-chain resonance assignments in a robust way. The success of automation in the strategy outlined here is achieved in part from the fact that side-chain methyl assignments are straightforward using the samples, data collection methods, and STAC algorithms outlined here. Using these deuterated methyl-protonated samples allows a strategy of data collection and automated analysis that works well for the Z domain and should work well for many other small proteins. Although several groups have emphasized the use of residual dipolar couplings in determining such minimal constraint structures, to our surprise we observed that while contributing to the accuracy of the structure determination, such RDC data are generally not essential for obtaining a global fold.
Value of “medium-accuracy” protein folds
The general approach of determining global protein folds using sparse NOE data involving amide, side-chain methyl, and (in some cases) aromatic protons has previously been described in the literature (Metzler et al. 1996; Rosen et al. 1996; Aghazadeh et al. 1998; Berardi et al. 1999; Medek et al. 2000; Mueller et al. 2000). Our work extends these results by demonstrating the use of such sparse NOE data as part of a fully automated assignment and structure analysis process. The accuracy of structures calculated with such minimal NMR data sets is obviously not as high as that of structures derived from conventional NMR approaches including complete analysis of side-chain resonance assignments, particularly for side-chain conformations. However, rapidly generated “medium-accuracy” structures like those shown in Figure 4 ▶ are useful in many ways. First, these structures provide good starting points for further refinement to precise and accurate coordinates using additional NMR data recorded with fully protonated samples. This was elegantly illustrated in the structure determination of DbI homology domain of DbI protein (Aghazadeh et al. 1998). Indeed, considering that minimal constraint structures can be obtained relatively quickly and used to guide full resonance assignment and NOESY analysis with automation software, a hybrid approach involving an initial “minimal-constraint” structure, which is then refined against additional NMR data to high accuracy, could be an interesting general approach to protein structure determination by NMR. On the other hand, the backbone structures generated with sparse constraints can themselves provide useful insights and clues for investigation of biologic functions by comparing with protein structures of known biologic activities, as for example, in the recent study of Runt domain (Berardi et al. 1999). It is already well established that even low-resolution structures generated by ab initio prediction methods sometimes give critical insights into protein function (Fetrow and Skolnick 1998; Simons et al. 2001). Structures generated with minimal NMR constraints presumably have higher accuracy and reliability than ab initio or de novo predictions, and should therefore be useful for establishing evolutionary relationships between proteins and in providing specific insights into biochemical function. Alternatively, this strategy can facilitate rapid determination of global folds for proteins with established biochemical functions to assist studies of structure–function relationships.
Impact of RDC data on the trajectory of the AutoStructure process
Although the final backbone structures of the Z domain are quite similar, the precise trajectories taken by the AutoStructure process were different when carried out with and without RDC constraints on the intermediate structure generations. In particular, the structures generated with RDC constraints, while closer to the high-resolution structure reported for the fully protonated Z domain (Tashiro et al. 1997), are outside of the conformational space spanned by the structures generated without RDC constraints. This is because the set of NOEs assigned without the RDC data is different (and less accurate) than the set obtained by AutoStructure when the assignment trajectory is guided by RDC data.
For example, in the calculations carried out without RDC constraints, 3, 9, and 16 interhelical NOE constraints were identified between helices 1 and 2, 1 and 3, and 2 and 3, respectively. When RDCs were applied in the course of AutoStructure calculations, 5, 6, and 13 interhelical constraints were identified between the corresponding helix pairs. These differences resulted from different interpretations of ambiguous assignments for some NOE cross-peaks in the two AutoStructure trajectories. In AutoStructure, after the first cycle of structure generation ambiguities in making NOESY cross-peak assignments are resolved iteratively by statistical analyses of atomic coordinates from the previous cycle of structure calculations (Huang 2001; Huang et al. 2003). The use of RDC constraints within AutoStructure generated the same Z domain folds but slightly different coordinates for certain residues in each cycle. This difference subsequently led to alternative assignments of some NOE cross-peaks. Although these minor differences in NOESY cross-peak assignments of interhelical NOE constraints were all consistent with the overall correct fold of the Z domain, these results demonstrate how RDC data can direct the NOESY cross-peak assignment process, leading to more accurate interpretation of the data and more accurate structures. Despite the fact that we obtained good results using the minimal constraint strategy described here without any RDC data, it is our general view that RDC data are essential for applying this minimal constraint strategy to unknown protein structures, as sparse NOESY cross-peak assignments can easily lead to less accurate or incorrect structures in the absence of validating RDC data, especially at the initial stage of fold analysis. We also believe that RDCs derived from multiple alignment media or different types of RDCs should be used whenever possible.
Value of extensive deuteration
By using extensively deuterated, methyl-protonated samples, the sensitivity, resolution, and completeness of the NMR data are tremendously improved, leading to less ambiguity and fewer errors in determining resonance and NOESY cross-peak assignments. Moreover, acquisition of especially high-resolution 3D or 4D 13C-edited NOESY data is possible by focusing specifically on the methyl region of the 13C-edited NOESY spectrum (Zwahlen et al. 1998; Mueller et al. 2000). In some cases, backbone hydrogen bonds can also be directly observed in such deuterated samples using trans-hydrogen-bond scalar coupling measurements (Cordier et al. 1999; Cornilescu et al. 1999). Where available, such constraints can greatly improve the robustness of rapid automated structure determination using the minimal constraint approach described here.
Protonated aromatic side chains
The use of protonated aromatic side chains (particularly Phe and Tyr), in addition to protonated methyl and amide groups, in an otherwise perdeuterated protein, has been proposed to be especially valuable for high-throughput structure determination (Aghazadeh et al. 1998; Clore et al. 1999; Medek et al. 2000). Aromatic side-chain labeling could be essential for NMR studies of relatively large-size proteins, or proteins with fewer methyl groups. This study suggests that such residue-specific aromatic labeling is not essential for success with small (<100 amino acids) proteins or domains. However, for larger protein structures, such aromatic protonation would provide many more tertiary constraints, and could be essential for success of the minimal constraint strategy.
Requirement for long NOESY mixing times
In this study, we successfully applied the “minimal-constraint strategy” for determining an accurate backbone structure of a three-helical bundle protein using automated analysis methods. In this work, it was essential to use uncharacteristically long NOE mixing times of 350 msec. About 42% more NOE cross-peaks, which do not appear to be due to spin diffusion, were observed in 3D 15N-edited NOESY recorded with a 350-msec NOESY mixing time compared to a NOESY spectrum recorded with a more conventional 75-msec mixing time, providing about twice as many long-range NOE constraints consistent with the known 3D structure of the Z domain.
Using NOESY spectra recorded with a short NOESY mixing time (75 msec), the AutoStructure analysis identified the locations of the three helices correctly, but assigned only 12 long-range (|i−j| > 5) NOE constraints. These distance constraints were able to define the antiparallel orientation of helix 2 and 3, but did not provide a unique packing of helix 1. Two of the ten structures (with lowest CNS energy) selected from 64 trial structures were actually mirror topologies of the correct Z domain fold. For the remaining eight structures, the backbone RMSD of the core residues (20–31, 38–49, 54–68) compared with the high-resolution Z domain structure (Tashiro et al. 1997) is 3.8 ± 1.3 Å. In fact, it was simply not possible to generate accurate converged structures of the Z domain using these automated methods with 75-msec NOESY data. However, using longer mixing time data (350 msec), many more long-range NOEs consistent with the known 3D structure of the Z domain were obtained, improving the performance of AutoStructure in generating structures similar to the high-resolution published structure, as shown in Figure 3 ▶ and Table 2. These results reveal that longer NOESY mixing times are critical parameters in applying this strategy, particularly for highly helical proteins that exhibit few weak interhelical NOEs. Similar results and conclusions were reported in attempts to use a similar minimal constraint approach with manual spectral analysis for the all α-helical antiapoptotic protein Bcl-xL (Medek et al. 2000).
Significantly, NOE interactions corresponding to distances >5 Å could be observed using these long NOESY mixing times. This observation suggests that our results of simulated “minimal-constraint” structures, assuming a maximum NOE-detectable distance of 4.5 Å are quite conservative. Using real experimental data including such long mixing time NOESY experiments could indeed provide better accurate folder for these test proteins than those reported in Table 3 and Figure 4 ▶.
NOESY peak assignment statistics
In addition to constraint lists and 3D structures, AutoStructure analysis also provides information about peak list qualities and statistics for the NOESY cross-peak assignment process. These statistics are not generally available for manually analyzed NMR structures. Summaries of (1) the number of peaks included in the peak lists that are the input to the AutoStructure program, (2) the number of “assignable” peaks with frequencies matching to possible pairs of resonances in the chemical shift list, and (3) the actual number of peaks reliably assigned to NOE interactions and used in generating constraints, are also presented in Table 2. Peaks in the NOESY spectra that are not “assignable” correspond to noise/artifacts in the spectra, NOESY peaks close to the diagonal that are filtered out by the current version of AutoStructure, or real NOESY cross-peaks involving unassigned resonances. The fraction of “assignable” cross-peaks (98% for the 15N-edited NOESY and 96% for the 13C-edited NOESY) provides a quality assessment of the input peak lists and resonance assignment table. These statistics reflect the completeness and accuracy of the resonance assignment list (for the amide and methyl protonated sites in this sample) and the high quality of the NOESY peak lists obtained for this deuterated/selectively protonated protein.
Each of these “assignable” peaks corresponds to one or more possible NOE-interaction pairs. A large fraction of these “assignable” peaks could indeed be assigned to unique or only a few self-consistent NOE interactions. However, in cases where the list of possible NOE-interaction assignments to a particular NOESY cross-peak remains high at the end of the iterative analysis process or inconsistent with the resulting structures, the current version of the AutoStructure does not use the corresponding data in the structure generation process. In the case of these automated Z domain structure determinations, ∼90% of “assignable” cross-peaks identified in the 15N-edited and 13C-edited NOESY peak lists could be assigned to only one or a few NOE-interaction pairs and used with reasonably good confidence in generating the final list of NOE distance constraints. In this regard it is relevant to note that a larger fraction of the 13C-edited NOESY cross-peaks were assigned by the AutoStructure process using RDC data in the course of iterative NOESY peak list assignment (93% of “assignable” peaks assigned) than the process that did not use the RDC data (86% assigned), supporting our conclusion that the guidance of experimental RDC data can be valuable for more accurate and complete analysis of NOESY cross-peak assignments with AutoStructure.
Prospect for rapid fold determination using cryoprobes, minimal-constraint approach, and automated data analysis
Considering that the time and effort required for automated data analysis using this strategy can be quite minimal (1 to 2 d), NMR data acquisition is the primary bottleneck in applying this approach for rapid fold determination of small proteins. This problem can be partially addressed using cryoprobe technology and high-field NMR spectrometers. For example, Medek et al. (2000) demonstrated that data collection for a similar strategy of rapid fold determination could be as short as 4 d using a cryoprobe and 800-MHz spectrometer. With such cryoprobe detection, the strategy outlined here using minimal constraints with automated data analysis can potentially be applied to routinely determine “medium-accuracy” structures of small proteins and domains within a few weeks.
Materials and methods
Sample preparation
The 71-residue Z domain from Staphylococcus aureus protein A was overexpressed in Escherichia coli RV308 (pDHZ) and purified as described previously (Jansson et al. 1996). We used the method described by Goto et al. (1999) with minor modification for the production of 2H-, 15N-, 13C-labeled and Val, Leu, and Ile (δ) methyl-protonated proteins of the Z domain. E. coli RV308 was first grown in MJ/H2O minimal medium (Jansson et al. 1996) at 37°C to OD ≈1.0. Cells were collected and transferred into 100 mL MJ/D2O medium containing [U-13C, 2H] glucose (3 g/L), 15NH4Cl (1 g/L) for overnight growth. These cells, which were thus acclimated to grow in D2O, were then used to inoculate 500 mL of the same 15N,13C-labeled MJ medium in 100% D2O for production of the Z domain samples. [U-13C]α-ketobutyrate (50 mg/L) and [U-13C]α-ketoisovalerate (100 mg/L) were added to the culture 1 h before induction. Isotope-enriched substrates were obtained from Cambridge Isotope Laboratories Inc.
Isotope-labeled Z domain samples were prepared for NMR measurements at 1.1 mM protein concentration in 20 mM NH4OAc buffer containing 5% D2O at pH 6.5 ± 0.05 in 5-mm susceptibility-matched Shigemi NMR tubes. The sample for residual dipolar coupling measurements was made by concentrating the protein using a 0.5 mL Ultrafree concentrator (Millipore), and then diluting with the appropriate amounts of pf1 phage (Hansen et al. 1998), to give a final concentration of 18 mg/mL pf1, 0.9 mM Z domain in 20 mM NH4OAc, 100 mM NaCl, 7% D2O at pH 6.6 ± 0.05.
NMR spectroscopy and processing
All NMR spectra were collected at 20°C on either 500- or 600-MHz Varian INOVA spectrometer systems, and referenced to external 2,2-dimethyl-2-silapentane-5-sulfonate sodium salt (DSS). Data sets were obtained at 600 MHz unless otherwise indicated. Spectra were processed with program NMRPipe 2.1 (Delaglio et al. 1995), and analyzed using the interactive NMR graphics program Sparky 3.91 (Goddard and Kneller, 2000) for peak identification and peak list editing.
Residual dipolar coupling measurements
Partial alignment of the Z domain in solution was achieved using pf1 filamentous phage (Hansen et al. 1998). After a brief (∼30 min) equilibration in the magnetic field, alignment was confirmed by 2H quadrupole splitting (Q = 18.2 ± 0.1 Hz), which remained constant throughout the data collection. One bond 15N–HN and 13Cα-13C′ splittings were measured on the free and aligned samples using 2D IPAP 15N-1H HSQC (Ottiger et al. 1998) and 3D Cα-coupled HNCO (Tjandra and Bax 1997). For each IPAP experiment, subspectra containing the downfield and upfield subpeaks of the 15N-1H coupling in the ω1 dimension were obtained by addition and subtraction of the IP and AP data.
Amide hydrogen/deuterium (H/D) exchange measurements
The amide hydrogen/deuterium exchange data used to identify hydrogen bond donors of the Z domain have been described elsewhere (Tashiro et al. 1997). Briefly, a 15N-enriched Z domain sample in H2O at pH 6.5 was lyophilized and subsequently redissolved at 2°C in equal amounts of D2O containing 10 mM K2HPO4 at pH 6.5. The sample was quickly transferred to a precooled NMR tube and put into a 500-MHz spectrometer with probe temperature preequilibrated to 10°C. A series of 30-min 15N-1H HSQC spectra were acquired over several hours, and peaks due to slowly exchanging backbone HN sites were identified from 15N–HN cross-peak intensity decay curves.
Resonance assignments with AutoAssign
The program AutoAssign (Zimmerman et al. 1997; Moseley et al. 2001) was used for automatic analysis of backbone resonance assignments using peak lists (frequencies and intensities) from 15N-1H HSQC, 3D HNCO, 3D HNcaCO, 3D HNcoCACB, and 3D HNCACB spectra, together with Spin System Type Assignment Constraints (STACs) derived from manual inspection of hCCcoNH- and HcccoNH-TOCSY spectra. Side-chain 13C and 1H methyl resonances of Leu, Val, and Ile (δ) were identified by interactive spectral analyses using 13C-1H HSQC, hCCcoNH-TOCSY, and HcccoNH-TOCSY data. Following sequence-specific assignment of backbone 13Cα and 13Cβ resonances, side-chain amide 15N and 1HN resonances of Asn and Gln were filled out by manual analysis of these triple resonance spectra. This process of determining backbone and side-chain methyl and amide resonance assignments was carried out with these Z domain data sets in about 2 h.
Automated analysis of NOESY spectra with AutoStructure and 3D structure calculations
The program AutoStructure (Huang 2001; Huang et al. 2003) was used, together with structure generation programs DYANA 1.5 (Güntert et al. 1997) or CNS 1.0 (Brunger et al. 1998), for structure calculation using NOESY peak lists (frequencies and intensities) generated with Sparky. AutoStructure automatically and iteratively interprets NOESY cross-peaks, derives proton distance constraints, and generates 3D structures of proteins using DYANA or CNS. This process involves spectral and structural pattern identification, and iterative NOESY data interpretation based on intermediate structures generated through multiple cycles of 3D structure calculations.
AutoStructure is a rule-based expert system using an automated two-step approach for NOESY data analysis (Huang 2001; Huang et al. 2003). In the first step, the program generates a reliable initial protein fold using intelligent analysis methods based on spectrum specific properties and the identification of self-consistent NOE contact patterns, without using any 3D structure model. In particular, the software identifies secondary structures, including alignments between β-strands if present, based upon a combined pattern analysis of secondary structure specific NOE contacts, chemical shift, scalar coupling constant, and slow amide proton exchange data. In the second step, the software iteratively derives and generates conformational constraints (i.e., distance, dihedral angle and hydrogen-bond constraints) automatically, and submits parallel structure calculations to an array of Pentium III processors. Although previous presentations of AutoStructure (Greenfield et al. 2001; Huang 2001; Huang et al. 2003) have described its use together with the structure generation program DYANA, for the work described here a supplementary module of AutoStructure was developed to interact with CNS 1.0, by providing input files to CNS 1.0 for structure generation, and then converting CNS output into a format suitable for AutoStructure analysis. The resulting protein structure is then automatically refined by iterative cycles of AutoStructure/CNS, assigning self-consistent NOESY cross-peaks and regenerating protein structures.
The input for AutoStructure analysis included (1) a list of resonance assignments determined automatically, as described above; (2) NOESY peak lists (frequencies and intensities) generated from 3D 13C-edited and 15N-edited NOESY spectra by automated peak picking and manual editing of these peak lists using Sparky; (3) amide hydrogen exchange data for Z domain (Tashiro et al. 1997); (4) φ, ξ dihedral angle constraints derived from chemical shift data using chemical shift index analysis (Wishart and Sykes, 1994); and (5) a list of RDC values and uncertainties. The φ, ξ dihedral angles of unambiguously characterized helical residues were loosely constrained to −60 ± 30° and −40 ± 40°, respectively.
Because the protein sample was largely deuterated, our automatic NOESY analyses focused only on NOEs from backbone HN to HN, backbone HN to side-chain methyl/NH2, and side-chain methyl/NH2 to side-chain methyl/NH2 interactions. The match tolerances of AutoStructure between NOESY peaks and resonance assignments were set to ±0.03 ppm for H and ±0.3 ppm for N and C atoms. During the iterative process of NOESY cross-peak assignment and 3D structure generation by AutoStructure, hydrogen bonds are identified if all of the following criteria are satisfied: (1) HN donors are present in the slow H/D exchange list, (2) O–H distance and donor-H-acceptor angle are consistent with standard hydrogen bond parameters, (3) the subject atom pairs are separated at least by two residues, (4) the potential hydrogen-bonded interaction is consistent with the local NOE contact pattern, and (5) both the hydrogen donor and acceptor are not involved in forming other potential hydrogen bonds (Huang 2001; Huang et al. 2003).
Multiple cycles of structure calculations were carried out with either DYANA (no RDC data) or both (one after the other in each cycle) DYANA and CNS (with RDC data). In either case, the final constraint lists were used as input for CNS (with or without RDC constraints) to generate the final set of structures. During the course of the simulated annealing calculations, the initial force constant Kdipolar for RDCs was set to 0.001 kcal/Hz2, and the final value was 0.5 kcal/Hz2. The final value was chosen to reflect the experimental error of ∼1.5 Hz in these experimental RDC data. The values DaNH and R of the alignment tensor were estimated as −17.3 Hz and 0.45 units from the histograms of normalized RDC data, as described by Clore et al. (1998). Molecular graphics representations of protein structures were generated with the program Molscript (Kraulis, 1991).
Acknowledgments
We thank A. Bhattacharya, G. Kornaber, R. Paranji, and R. Tejero for helpful discussion and comments on the manuscript. This work was supported by grant P50-GM62413 from the Protein Structure Initiative of the Institute of General Medical Sciences, National Institutes of Health, and by Research Excellence Award 2042-007-13 from the New Jersey Commission on Science and Technology.
The publication costs of this article were defrayed in part by payment of page charges. This article must therefore be hereby marked “advertisement” in accordance with 18 USC section 1734 solely to indicate this fact.
Abbreviations
AP, antiphase
IP, in-phase
IPAP, in-phase/antiphase
RMSD, root-mean-square deviation
RDC, residual dipolar coupling
STAC, Spin System Type Assignment Constraints
STACi, intraresidue STAC constraint
STACs, sequential STAC constraint
Article and publication are at http://www.proteinscience.org/cgi/doi/10.1110/ps.0300203.
References
- Aghazadeh, B., Zhu, K., Kubiseski, T.J., Liu, G.A., Pawson, T., Zheng, Y., and Rosen, M.K. 1998. Structure and mutagenesis of the DbI homology domain. Nat. Struct. Biol. 5 1098–1107. [DOI] [PubMed] [Google Scholar]
- Andrec, M., Du, P., and Levy, R.M. 2001. Protein backbone structure determination using only residual dipolar couplings from one ordering medium. J. Biomol. NMR 21 335–347. [DOI] [PubMed] [Google Scholar]
- Andrec, M., Harano, Y., Jacobson, M.P., Friesner, R., and Levy, R.M. 2002. Complete protein structure determination using backbone residual dipolar couplings and sidechain rotamer prediction. J. Struct. Funct. Genomics 2 103–111. [DOI] [PubMed] [Google Scholar]
- Berardi, M.J., Sun, C., Zehr, M., Abildgaard, F., Peng, J., Speck, N.A., and Bushweller, J.H. 1999. The Ig fold of the core binding factor α Runt domain is a member of a family of structurally and functionally related Ig-fold DNA-binding domains. Structure 7 1247–1256. [DOI] [PubMed] [Google Scholar]
- Brunger, A.T., Adams, P.D., Clore, G.M., Delano, W.L., Gros, P., Grosse-Kunstleve, R.W., Jiang, J., Kuszewski, J., Nilges, M., Pannu, N.S., et al. 1998. Crystallography & NMR system: A new software suite for macromolecular structure determination. Acta. Crystallogr. D54 905–921. [DOI] [PubMed] [Google Scholar]
- Burley, S.K. 2000. An overview of structural genomics. Nat. Struct. Biol. 7 932–934. [DOI] [PubMed] [Google Scholar]
- Chance, M.R., Bresnick, A.R., Burley, S.K., Jiang, J.S., Lima, C.D., Sali, A., Almo, S.C., Bonanno, J.B., Buglino, J.A., Boulton, S., et al. 2002. Structural genomics: A pipeline for providing structures for the biologist. Protein Sci. 11 723–738. [DOI] [PMC free article] [PubMed] [Google Scholar]
- Clore, G. M., Gronenborn, A.M., and Bax, A. 1998. A robust method for determining the magnitude of the fully asymmetric alignment tensor of oriented macromolecules in the absence of structural information. J. Magn. Reson. 133 216–221. [DOI] [PubMed] [Google Scholar]
- Clore, G.M., Starich, M.R., Bewley, C.A., Cai, M., and Kuszewski, J. 1999. Impact of residual dipolar couplings on the accuracy of NMR structures determined from a minimal number of NOE restraints. J. Am. Chem. Soc. 121 6513–6514. [Google Scholar]
- Cordier, F., Rogowski, M., Grzesiek, S., and Bax, A. 1999. Observation of through-hydrogen-bond 2hJHC′ in a perdeuterated protein. J. Magn. Reson. 140 510–512. [DOI] [PubMed] [Google Scholar]
- Cornilescu, G., Hu, J.S., and Bax, A. 1999. Identification of the hydrogen bonding network in a protein by scalar couplings. J. Am. Chem. Soc. 121 2949–2950. [Google Scholar]
- Delaglio, F., Grzesiek, S., Vuister, G.W., Zhu, G., Pfeifer, J., and Bax, A. 1995. NMRPipe: A multidimensional spectral processing system based on UNIX pipes. J. Biomol. NMR 6 277–293. [DOI] [PubMed] [Google Scholar]
- Delaglio, F., Kontaxis, G., and Bax, A. 2000. Protein structure determination using molecular fragment replacement and NMR dipolar couplings. J. Am. Chem. Soc. 122 2142–2143. [Google Scholar]
- Feng, W., Rios, C.B., and Montelione, G. 1996. Phase labeling of C–H and C–C spin-system topologies: Application in PFG-HACANH and PFG-HACA(CO)NH triple-resonance experiments for determining backbone resonance assignments in proteins. J. Biomol. NMR 8 98–104. [DOI] [PubMed] [Google Scholar]
- Fetrow, J.S. and Skolnick, J. 1998. Method for prediction of protein function from sequence using the sequence-to-structure-to-function paradigm with application to glutaredoxins/thioredoxins and T1 ribonucleases. J. Mol. Biol. 281 949–968. [DOI] [PubMed] [Google Scholar]
- Fowler, C.A., Tian, F., AI-Hashimi, H.M., and Prestegard, J.H. 2000. Rapid determination of protein folds using residual dipolar couplings. J. Mol. Biol. 304 447–460. [DOI] [PubMed] [Google Scholar]
- Gardner, K.H. and Kay, L.E. 1998. The use of 2H, 13C, 15N multidimensional NMR to study the structure and dynamics of proteins. Annu. Rev. Biophys. Biomol. Struct. 27 357–406. [DOI] [PubMed] [Google Scholar]
- Gardner, K.H., Rosen, M.K., and Kay, L.E. 1997. Global folds of highly deuterated, methyl-protonated proteins by multidimensional NMR. Biochemistry 36 1389–1401. [DOI] [PubMed] [Google Scholar]
- Goddard, T.D. and Kneller, D.G. 2000. SPARKY 3. University of California, San Francisco.
- Goto, N. and Kay, L.E. 2000. New developments in isotope labeling strategies for protein solution NMR spectroscopy. Curr. Opin. Struct. Biol. 10 585–592. [DOI] [PubMed] [Google Scholar]
- Goto, N.K., Gardner, K.H., Mueller, G.A., Willis, R.C., and Kay, L.E. 1999. A robust and cost-effective method for the production of Val, Leu, Ile (δ1) methyl-protonated 15N-, 13C-, 2H-labeled proteins. J. Biomol. NMR 13 369–374. [DOI] [PubMed] [Google Scholar]
- Greenfield, N.J., Huang, Y.J., Palm, T., Swapna, G.V.T., Monleon, D., Montelione, G.T., and Hitchcock-DeGregori, S.E. 2001. Solution NMR structure and folding dynamics of the N terminus of a rat non-muscle α-tropomyosin in an engineered chimeric protein. J. Mol. Biol. 312 833–847. [DOI] [PubMed] [Google Scholar]
- Gronwald, W., Moussa, S., Elsner, R., Jung, A., Ganslmeier, B., Trenner, J., Kremer, W., Neidig, K., and Kalbitzer, R. 2002. Automated assignment of NOESY NMR spectra using a knowledge based method (KNOWNOE). J. Biomol. NMR 23 271–287. [DOI] [PubMed] [Google Scholar]
- Grzesiek, S., Anglister, J., Ren, H., and Bax, A. 1993. 13C line narrowing by 2H decoupling in 2H/13C/15N-enriched proteins—Application to triple-resonance 4D J-connectivity of sequential amides. J. Am. Chem. Soc. 115 4369–4370. [Google Scholar]
- Grzesiek, S., Wingfield, P., Stahl, S., Kaufman, J. D., and Bax, A. 1995. Four-dimensional 15N-separated NOESY of slowly tumbling perdeuterated 15N-enriched proteins. Application to HIV-1 Nef. J. Am. Chem. Soc. 117 9594–9595. [Google Scholar]
- Güntert, P., Mumenthaler, C., and Wüthrich, K. 1997. Torsion angle dynamics for NMR structure calculation with new program DYANA. J. Mol. Biol. 273 283–298. [DOI] [PubMed] [Google Scholar]
- Hansen, M.R., Mueller, L., and Pardi, A. 1998. Tunable alignment of macromolecules by filamentous phage yields dipolar coupling interactions. Nat. Struct. Biol. 5 1065–1074. [DOI] [PubMed] [Google Scholar]
- Herrmann, T., Güntert, P., and Wüthrich, K. 2002. Protein NMR structure determination with automated NOE assignment using the new software CANDID and the torsion angle dynamics algorithm DYANA. J. Mol. Biol. 319 209–227. [DOI] [PubMed] [Google Scholar]
- Huang, Y.J. 2001. Automated determination of protein structures from NMR data by iterative analysis of self-consistent contact patterns. Ph.D. thesis, Rutgers University, New Brunswick, NJ.
- Huang, Y.P., Swapna, G.V.T., Rajan, P.K., Ke, H., Xia, B., Shukla, K., Inouye, M., and Montelione, G.T. 2003. Solution NMR structure of ribosome binding factor A (RbfA), a cold-shock adaptation protein from Escherichia coli. J. Mol. Biol. 327 521–536. [DOI] [PubMed] [Google Scholar]
- Hus, J.C., Marion, D., and Blackledge, M. 2000. De novo determination of protein structure by NMR using orientational and long-range order restraints. J. Mol. Biol. 298 927–936. [DOI] [PubMed] [Google Scholar]
- Ikura, M., Kay, L.E., and Bax, A. 1990. A novel approach for sequential assignment of 1H, 13C and 15N spectra of proteins: Heteronuclear triple-resonance three-dimensional NMR spectroscopy. Application to calmodulin. Biochemistry 29 4659–4667. [DOI] [PubMed] [Google Scholar]
- Jansson, M., Li, Y.-C., Jendeberg, L., Anderson, S., Montelione, G.T., and Nilsson, B. 1996. High level production of uniformly 15N- and 13C-enriched fusion proteins in Escherichia coli. J. Biomol. NMR 7 131–141. [DOI] [PubMed] [Google Scholar]
- Kay, L.E., Ikura, M., Tschudin, R., and Bax, A. 1990. Three-dimensional triple-resonance NMR spectroscopy of isotopically enriched proteins. J. Magn. Reson. 89 496–514. [DOI] [PubMed] [Google Scholar]
- Kennedy, M.A., Montelione, G.T., Arrowsmith, C.H., and Markley, J.L. 2002. Role for NMR in structural genomics. J. Struct. Funct. Genomics 2 155–169. [DOI] [PubMed] [Google Scholar]
- Kim, S.H. 2000. Structural genomics of microbes: An objective. Curr. Opin. Struct. Biol. 10 380–383. [DOI] [PubMed] [Google Scholar]
- Koradi, R., Billeter, M., and Wuthrich, K. 1996. MOLMOL: A program for display and analysis of macromolecular structures. J. Mol. Graphics 14 51–55. [DOI] [PubMed] [Google Scholar]
- Kraulis, P.J. 1991. MOLSCRIPT: A program to produce both detailed and schematic plots of protein structures. J. Appl. Crystallogr. 24 946–950. [Google Scholar]
- Laskowski, R.A., MacArthur, M.W., Moss, D.S., and Thornton, J.M. 1993. PROCHECK: A program to check the stereochemical quality of protein structures. J. Appl. Crystallogr. 26 283–291. [Google Scholar]
- Medek, A., Olejniczak, E.T., Meadows, R.P., and Fesik, S.W. 2000. An approach for high-throughput structure determination of proteins by NMR spectroscopy. J. Biomol. NMR 18 229–238. [DOI] [PubMed] [Google Scholar]
- Metzler, W.J., Wittekind, M., Goldfarb, V., Mueller, L., and Farmer II, B.T. 1996. Incorporation of 1H/13C/15N-{Ile, Leu, Val} into a perdeuterated, 15N-labeled protein: Potential in structure determination of large proteins by NMR. J. Am. Chem. Soc. 118 6800–6801. [Google Scholar]
- Monleon, D., Colson, K., Moseley, H.N.B., Anklin, C., Oswald, R., Szyperski, T.A., and Montelione, G.T. 2002. Rapid analysis of protein backbone resonance assignments using cryogenic probes, a distributed Linux-based computing architecture, and an integrated set of spectral analysis tools. J. Struct. Funct. Genomics 2 93–101. [DOI] [PubMed] [Google Scholar]
- Montelione, G.T. and Anderson, S. 1999. Structural genomics: Keystone for a human proteome project. Nat. Struct. Biol. 6 11–12. [DOI] [PubMed] [Google Scholar]
- Montelione, G.T. and Wagner, G. 1989. Accurate measurements of homonuclear HN-Hα coupling constants in polypeptides using heteronuclear 2D NMR experiments. J. Am. Chem. Soc. 111 5474–5475. [Google Scholar]
- ———. 1990. Conformation-independent sequential NMR connections in isotope-enriched polypeptides by 1H-13C-15N triple-resonance experiments. J. Magn. Reson. 87 183–188. [Google Scholar]
- Montelione, G.T., Lyons, B.A., Emerson, S.D., and Tashiro, M. 1992. An efficient triple resonance experiment using carbon-13 isotropic mixing for determining sequence-specific resonance assignments of isotopically enriched proteins. J. Am. Chem. Soc. 114 10974–10975. [Google Scholar]
- Montelione, G.T., Zheng, D., Huang, Y.J., Gunsalus, K.C., and Szyperski, T. 2000. Protein NMR spectroscopy in structural genomics. Nat. Struct. Biol. 7 982–985. [DOI] [PubMed] [Google Scholar]
- Moseley, H.N. and Montelione, G.T. 1999. Automated analysis of NMR assignments and structures for proteins. Curr. Opin. Struct. Biol. 9 635–642. [DOI] [PubMed] [Google Scholar]
- Moseley, H.N., Monleon, D., and Montelione, G.T. 2001. Automatic determination of protein backbone resonance assignments from triple resonance nuclear magnetic resonance data. Methods Enzymol. 339 91–108. [DOI] [PubMed] [Google Scholar]
- Mueller, G.A., Choy, W.Y., Yang, D., Forman-Kay, J.D., Venters, R.A., and Kay, L.W. 2000. Global folds of proteins with low densities of NOEs using residual dipolar couplings: Application to the 370-residue maltodextrin-binding protein. J. Mol. Biol. 300 197–212. [DOI] [PubMed] [Google Scholar]
- Mumenthaler, C., Güntert, P., Braun, W., and Wüthrich, K. 1997. Automated combined assignment of NOESY spectra and three-dimensional protein structure determination. J. Biomol. NMR 10 351–362. [DOI] [PubMed] [Google Scholar]
- Nilges, M., Macias, M., O’Donoghue, S.I., and Oschkinat, H. 1997. Automated NOESY interpretation with ambiguous distance restraints: The refined NMR solution structure of the pleckstrin homology domain from β-spectrin. J. Mol. Biol. 269 408–422. [DOI] [PubMed] [Google Scholar]
- Ottiger, M., Delaglio, F., and Bax, A. 1998. Measurement of J and dipolar couplings from simplified two-dimensional NMR spectra. J. Magn. Reson. 131 373–378. [DOI] [PubMed] [Google Scholar]
- Prestegard, J.H. 1998. New techniques in structural NMR—Anisotropic interactions. Nat. Struct. Biol. 5 517–522. [DOI] [PubMed] [Google Scholar]
- Prestegard, J.H., Valafar, H., Glushka, J., and Tian, F. 2001. Nuclear magnetic resonance in the era of structural genomics. Biochemistry 40 8677–8685. [DOI] [PubMed] [Google Scholar]
- Rohl, A.C. and Baker, D. 2002. De novo determination of protein backbone structure from residual dipolar couplings using Rosetta. J. Am. Chem. Soc. 124 2723–2729. [DOI] [PubMed] [Google Scholar]
- Rosen, M.K., Gardner, K.H., Willis, R.C., Parris, W.E., Pawson, T., and Kay, L.E. 1996. Selective methyl group protonation of perdeuterated proteins. J. Mol. Biol. 263 627–636. [DOI] [PubMed] [Google Scholar]
- Schubert, M., Smalla, M., Schmieder, P., and Oschkinat, P. 1999. MUSIC in triple-resonance experiments: Amino acid type-selective 1H-15N correlations. J . Magn. Reson. 141 34–43. [DOI] [PubMed] [Google Scholar]
- Seavey, B.R., Farr, E.A., Westler, W.M., and Markley, J.L. 1991. A relational database for sequence-specific protein NMR data. J. Biomol. NMR 1 217–236. [DOI] [PubMed] [Google Scholar]
- Simons, K.T., Strauss, C., and Baker, D. 2001. Prospects for ab initio protein structural genomics. J. Mol. Biol. 306 1191–1199. [DOI] [PubMed] [Google Scholar]
- Tashiro, M., Tejero, R., Zimmerman, D.E., Celda, B., Nilsson, B., and Montelione, G.T. 1997. High-resolution solution NMR structure of the Z domain of staphylococcal protein A. J. Mol. Biol. 272 573–590. [DOI] [PubMed] [Google Scholar]
- Terwilliger, T.C. 2000. Structural genomics in North America. Nat. Struct. Biol. 7 935–939. [DOI] [PubMed] [Google Scholar]
- Tjandra, N. and Bax, A. 1997. Direct measurement of distances and angles in biomolecules by NMR in a dilute liquid crystalline medium. Science 278 1111–1114. [DOI] [PubMed] [Google Scholar]
- Tolman, J.R., Flanagan, J.M., Kennedy, M.A., and Prestegard, J.H. 1995. Nuclear magnetic dipole interactions in field-oriented proteins: Information for structure determination in solution. Proc. Natl. Acad. Sci. 92 9279–9283. [DOI] [PMC free article] [PubMed] [Google Scholar]
- Venters, R.A., Metzler, W.J., Spicer, L.D., Mueller, L., and Farmer, B.T. 1995. Use of 1HN-1HN NOEs to determine protein global folds in perdeuterated proteins. J. Am. Chem. Soc. 117 9592–9593. [Google Scholar]
- Wider, G. and Wüthrich, K. 1999. NMR spectroscopy of large molecules and multimolecular assemblies in solution. Curr. Opin. Struct. Biol. 9 594–601. [DOI] [PubMed] [Google Scholar]
- Wishart, D.S. and Sykes, B.D. 1994. The 13C chemical-shift index: A simple method for the identification of protein secondary structure using 13C chemical-shift data. J. Biomol. NMR 4 171–180. [DOI] [PubMed] [Google Scholar]
- Yamazaki, T., Lee, W., Arrowsmith, C.H., Muhandiram, D.R., and Kay, L.E. 1994. A suite of triple resonance NMR experiments for the backbone assignment of 15N, 13C, 2H-labeled proteins with high-sensitivity. J. Am. Chem. Soc. 116 11655–11666. [Google Scholar]
- Zimmerman, D.E., Kulikowski, C.A., Huang, Y., Feng, W., Tashiro, M., Shimotakahara, S., Chien, C., Powers, R., and Montelione, G.T. 1997. Automated analysis of protein NMR assignments using methods from artificial intelligence. J. Mol. Biol. 269 592–610. [DOI] [PubMed] [Google Scholar]
- Zwahlen, C., Gardner, K.H., Sarma, S.P., Horita, D.A., Byrd, R.A., and Kay, L.E. 1998. An NMR experiment for measuring methyl-methyl NOEs in 13C-labeled proteins with high resolution. J. Am. Chem. Soc. 120 7617–7625. [Google Scholar]