

Abstract
Transthyretin (TTR) is one of the known human amyloidogenic proteins. Its native state is a homotetramer with each monomer having a β-sandwich structure. Strong experimental evidence suggests that TTR dissociates into monomeric intermediates and that the monomers subsequently self-assemble to form amyloid deposits and insoluble fibrils. However, details on the early steps along the pathway of TTR amyloid formation are unclear, although various experimental approaches with resolutions at the molecular or residue level have provided some clues. It is highly likely that the stability and flexibility of monomeric TTR play crucial roles in the early steps of amyloid formation; thereby, it is essential to characterize initial conformational changes of TTR monomers. In this article we probe the possibility that the differences in the monomeric forms of wild-type (WT) TTR and its variants are responsible for differential amyloidogenesis. We begin with the simulations of WT, Val30→Met (V30M), and Leu55→Pro (L55P) TTR monomers. Nanosecond time scale molecular dynamics simulations at 300 K were performed using AMBER. The results indicate that the L55P-TTR monomer undergoes substantial structural changes relative to fluctuations observed in the WT and V30M TTR monomers. The observation supports earlier speculation that the L55P mutation may lead to disruption of the β-sheet structure through the disorder of the “edge strands” that might facilitate amyloidogenesis.
Keywords: Human transthyretin, single-point mutation, molecular dynamics simulation, conformational change, amyloid deposit
Human transthyretin (TTR) is a plasma protein responsible for carrying thyroid hormones in plasma and cerebrospinal fluid (Hagen and Elliott 1973; Schreiber et al. 1995) and indirect transport of vitamin A (Kanai et al. 1968; Nilsson et al. 1975). It is 1 of the about 20 known human proteins that form amyloid fibrils in vivo. The native conformation of TTR is a homotetramer with 127 residues per monomer. In each monomer, there are eight β-strands, named from A to H. These β-strands are connected by loops and a short α-helix just after the E strand. Each monomer consists of a flattened β-barrel, more like a β-sandwich formed from two four-strand β-sheets (DAGH and CBEF; Blake et al. 1978; Fig. 1 ▶). The monomer–monomer interface is formed by extensive hydrogen bonds between the two H strands of the neighboring monomers. Although the two F-strands of the adjacent monomers are also close to each other, they form only two hydrogen bonds. Two dimers are related by a crystallographic twofold axis to form a tetramer. The hydrophobic interactions between the A–B and G–H loops at the dimer–dimer interface are predominant (Fig. 1 ▶).
Figure 1.
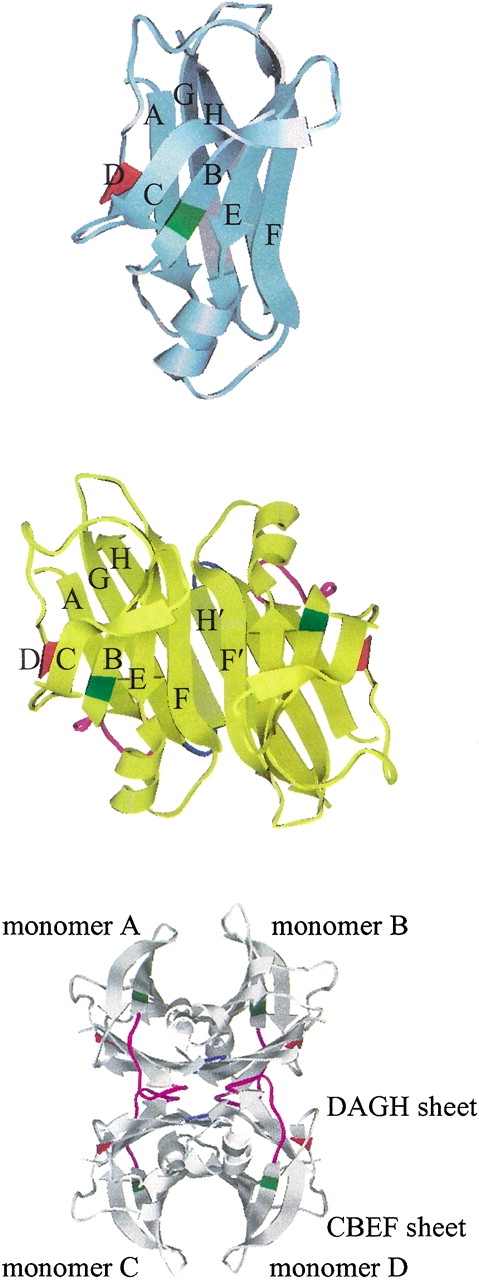
Three-dimensional structure of WT-TTR (PDB entry 1DVQ). The monomer, the dimer, and the tetramer are shown in the top, the middle, and the bottom, respectively. Two monomers are related by a noncrystallographic twofold axis. The native structure is a homotetramer. We generated the tetramer structure from the dimer coordinates using the transformation matrix provided in the PDB file. The eight β-strands are named from A to H. The residue ranges that make up the β-strands are listed in Materials and Methods. The α-helix is from T75 to L82. The same designation is used in all of the figures. Leu55 is in red and Val30 is in green. In the tetrameric complex, the A–B loop (magenta) in monomer A contacts the G–H loop (blue) in monomer D, while the G–H loop in monomer A interacts with the A–B loop of monomer D. The monomer B interacts with monomer C through the same loop contacts.
Two types of amyloid diseases, senile systemic amyloidosis (SSA) and familial amyloid polyneuropathy (FAP), are putatively caused by amyloid deposition of wild-type TTR (WT-TTR) and its variants in heart, peripheral nerves, and other organs. Twenty-five percent of the male population over the age of 80 suffers from SSA, while FAP affects 1 in 100,000 people as early as age 10 (Kelly 1996). Amyloid fibrils of SSA patients are formed by WT-TTR (Cornwell et al. 1988; Westermark et al. 1990). By contrast, the fibrils in FAP patients are composed of single-site mutant TTR (Saraiva et al. 1983, 1984). The instability of the mutant TTR tetramer in vitro is found to strongly correlate with the age of onset of FAP (McCutchen et al. 1995). Based on extensive experimental studies, a multistep assembly pathway of TTR amyloid fibrils is proposed as the following: the TTR tetramer dissociates into monomeric intermediates and then the monomers subsequently self-assemble to form amyloid deposits and insoluble fibrils (Kelly 1998; Sacchettini and Kelly 2002). Among the numerous pathogenic variants, Leu55→Pro55 (L55P) is the most amyloidogenic and Val30→Met30 (V30M) is the most prevalent. Under the conditions of pH 7.0 and 37°C, both WT-TTR and V30M-TTR are stable; however, L55P-TTR forms amyloid fibrils in vitro (McCutchen et al. 1995). Leu55 is located in the two-residue D-strand (E54 and L55), an edge of the β-sandwich of TTR, whereas Val30 is in the B-strand that forms the hydrophobic core (Fig. 1 ▶). The structures of WT, V30M, and L55P TTR have been determined by high-resolution X-ray crystallography (Blake et al. 1978; Hamilton et al. 1993; Sebastiao et al. 1998). Although residues 54–55 belong to a surface loop in L55P-TTR, high structural similarity between the mutants and the wild-type is observed. It is suspected that the single-point mutations accelerate amyloidogenesis by destabilizing the monomeric partially unfolded amyloidogenic intermediate state rather than by altering the tetrameric native state.
Previous SDS-PAGE analysis, analytical ultracentrifugation, and gel-filtration studies of the quaternary structure of WT-TTR have revealed that tetrameric and monomeric TTR are in equilibrium, and that the equilibrium shifts toward the monomeric state at low concentration, for example, TTR concentration <0.01 mg/mL (Lai et al. 1996). At 25°C and pH 7, the fraction of monomer in 0.01 mg/mL WT-TTR solution is approximately 15% (Lai et al. 1996). Recent studies on the interconversion between the molecular species of L55P-TTR at pH 7 and 37°C demonstrate that the tetrameric species initially dissociates into monomeric species followed by the formation of high molecular mass aggregates (Quintas et al. 1999). Further evidence of D–H exchange of WT-TTR has shown that the exchange patterns of the low concentration (monomeric) and high concentration (tetrameric) TTR are similar near neutral pH (Liu et al. 2000), indicating that when the WT-TTR tetramer dissociates into monomers under nonamyloidogenic conditions, the structure of monomer remains native-like. To date, no evidence has shown that partial unfolding occurs within monomers of the tetrameric complex prior to dissociation. Clearly, all of these experimental data suggest that the tetramer dissociation into monomers is the first step along the amyloidogenic pathway. Therefore, it is highly likely that the stability and flexibility of monomeric TTR play crucial roles in the process of amyloid formation; and it is essential to characterize the initial conformational changes of monomeric TTR.
WT-TTR is stable in its tetrameric state from pH 7 to pH 5; however, under acidic condition, pH 5.0–3.9, it dissociates into monomeric intermediates and then the monomers subsequently self-assemble to form amyloid deposits. If the pH is continuously lowered less than 3.9, the monomers are in a molten globular denatured state (Lai et al. 1996). A significant amount of experimental efforts have been made to study the acid-induced TTR amyloid formation in vitro (Lai et al. 1996; Lashuel et al. 1998, 1999; Nettleton et al. 1998). The aim of using acid-mediated method is to facilitate the amyloid formation in vitro to make the conditions suitable to the study of amyloid phenomenon. It is debatable whether the acidic condition has physiologic relevance. In fact, it has been found that the TTR amyloid fibril formation occurs in extracellular space (pH 7.4; Adams and Said 1996). Therefore, in this article we focus on understanding the stability and flexibility of WT-TTR and its variants (L55P and V30M) at neutral pH. Biochemical studies on the tetramer stability of several TTR variants have pointed out the correlation between the tetramer stability and the tendency of amyloid formation (McCutchen et al. 1993). However, the single-point mutations may also significantly affect the conformational changes after the tetramer dissociation. Recent studies on the conformational stability of monomeric TTR started to point towards this direction (Quintas et al. 2001). In this article, we address the stability and flexibility of the WT, L55P, and V30M TTR monomers using molecular dynamics (MD) simulations. Our computational methods complement the experimental approaches to study the conformational changes at the atomic level during the early stage of TTR amyloid formation.
Results
We performed a set of MD simulations on the following TTR monomers: WT, L55P, and V30M. Initial structures of the simulations were extracted from the corresponding X-ray structures of the tetramers (Hamilton et al. 1993; Sebastiao et al. 1998; Klabunde et al. 2000). This section summarizes the analyses of the MD trajectories collected for 1.8 nsec to assess the protein stability and flexibility.
In Figure 2A ▶, we plot the root-mean-square (RMS) deviation of the β-sheet regions relative to the corresponding initial structure as a function of simulation time. The profiles of RMS deviation appear to reach reasonable plateaus around 1.3 Å after 600 psec, indicating that statistical convergence has been attained in these simulations. The potential energy of each system as a function of simulation time reaches a plateau at the same time (data are not shown); the relative fluctuations of potential energy are ca. 0.1% using the block average method with 3.75 psec (25 data points of potential energy) per block. Hence, after a 600-psec production run, the systems are considered to reach better convergence. As a result, in the following analyses we use the snapshots collected during the last 1.2 nsec of the production run. The average structure along the MD simulation of each monomer is slightly minimized and then superimposed with the corresponding initial structure of each simulation for the α-carbons. The WT and V30M TTR monomers show similar displacements (Fig. 2B ▶) except that the N terminal loop (residues 1–9) of V30M-TTR is very flexible, which is not resolved in WT-TTR. The large displacements appear in the A–B, B–C, F–G, and G–H loops for the WT and V30M TTR monomers. The A–B and G–H loops from one dimer contact with the G–H and A–B loops from the other dimer in the tetrameric state. In the monomeric form, the G–H loop moves toward the helix-F loop and the α-helix to enhance contacts. In addition, the α-helix and the helix-F loop become closer to each other. For the β-sheet regions of WT and V30M TTR monomers, apparent shifts are seen in the E and F strands and near the end of the B strand and the beginning of the C strand. The displacement of the L55P-TTR monomer with respect to its initial structure shows different pattern. Besides the large movements in the α-helix, helix-F, A–B, B–C, F–G, and G–H loop regions, significant deviations are also observed in the loop region between the C and E strands (following the same designation as the WT-TTR) and the H-strand. Moreover, substantial secondary structural changes are seen in the L55P-TTR monomer (detailed discussion is in the following text). In Figure 3 ▶, we present the residue averages of the RMS fluctuations for the main chain atoms during the last 1.2-nsec MD simulation. Two features are obvious in this figure: (1) As expected, for the simulation of each monomer, the fluctuations in the region of β-sheets are smaller than those in the loop regions; (2) for most of the residues, the RMS fluctuation of the L55P monomer is apparently larger than that of the WT and V30M monomers, especially in the loop regions. Besides the loop regions, the α-helix in L55P and V30M TTR monomers also has large RMS fluctuations, which may be resulted from both the rigid body movements and secondary structural changes.
Figure 2.

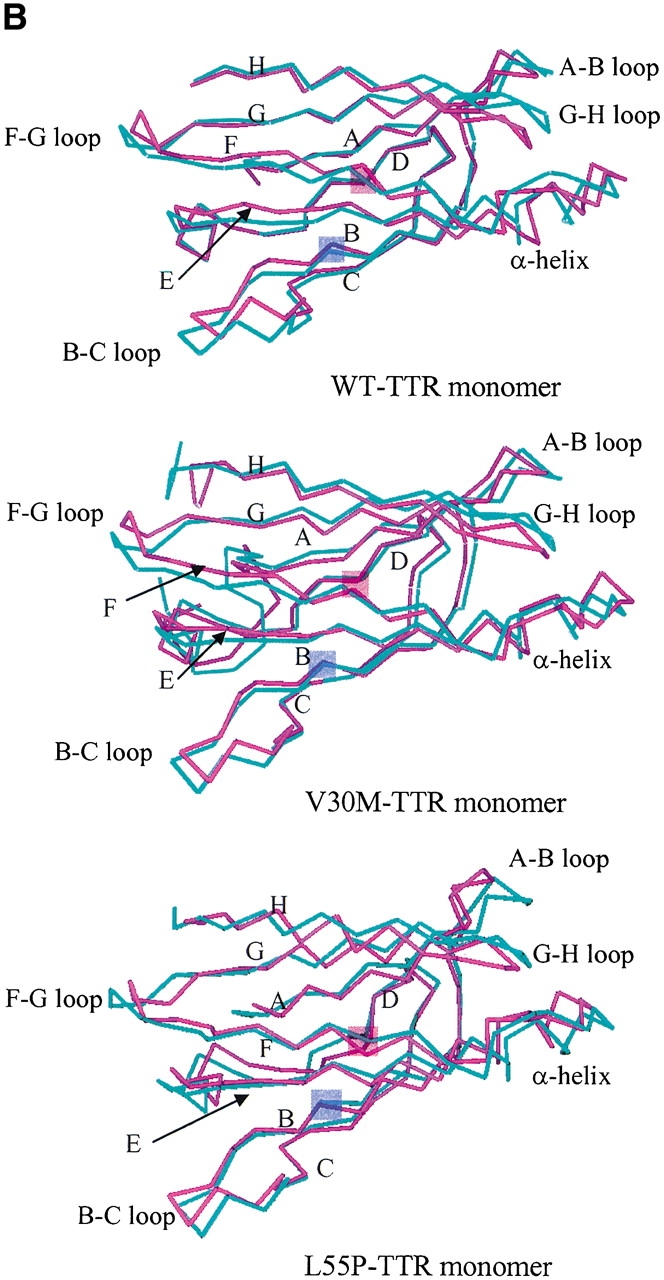
(A) The root-mean-square (RMS) deviation of the main chain atoms in the β-sheet region relative to the corresponding initial structure as a function of simulation time. Block averaging was used with 15 psec per block. (B) Superposition of the α-carbons of the initial structure of the simulation (cyan) and the average structure along the trajectory (magenta). Residue number 30 and 55 are shaded in violet and in pink, respectively.
Figure 3.

The residue averages of the RMS fluctuations for the main chain atoms during the last 1.2 nsec MD simulation. “h” denotes the α-helix.
As seen in Figure 4A ▶, the secondary structure analyses using DSSP (Kabsch and Sander 1983) show that the β-sheets of the WT and V30M TTR monomers are not significantly altered during the production run, whereas the β-sheets of the L55P-TTR monomer undergo some substantial changes. The schematic representations of hydrogen bonds between backbone amide groups are shown in Figure 4B ▶. Upon the Leu55→Pro55 mutation, the original main-chain hydrogen bonds between Leu55 in the D strand and Val14 in the A-strand are broken; as a result, E54 and P55 belong to a surface loop. This leads to the disruption and reformation of the A-strand as well as of the G strand, occurring in the regions of V14, K15, and V16 in the A-strand and A108 and A109 in the G-strand. For most of the time during the simulation, the H-strand of the L55P-TTR monomer is broken in the middle from T118 to A120. This strand is also unstable toward the end of the simulation of the WT-TTR monomer, occurring from T119 to V121. However, the B-, C-, E-, and F-strands of the L55P monomer are preserved throughout the simulation. Interestingly, during the simulation of the V30M-TTR monomer, the two-turn α-helix just after the E-strand is disrupted from 660 to 1163 psec, but it reforms after then and is stable for the rest of the simulation time. By contrast, the α-helix of the WT and L55P TTR monomers are stable during the simulations.
Figure 4.


(A) The secondary structure analyses along the MD trajectories using DSSP (Kabsch and Sander 1983) for the WT (top), L55P (middle), and V30M (bottom) TTR monomers. More attention should be paid to the results after 600 psec (0.6 nsec). The β-strands are named from A to H. “h” denotes the α-helix. A solid square represents that a residue adopts the β-sheet or α-helix conformation. (B) The schematic representations of hydrogen bonds between backbone amide groups in the β-sandwich region. The solid arrow denotes the hydrogen bond that is persistent in the three monomers; the dashed-line arrow and the dotted-line arrow denote the hydrogen bond with low occupancy (<70%) in the L55P-TTR monomer and WT-TTR monomer, respectively; the dotted/dashed-line arrow represents the hydrogen bond with low occupancy (<70%) in both L55P and WT monomers. Arrow points from hydrogen bond donor to acceptor.
To quantitatively reveal the conformational changes of the main chain, we calculated the fluctuation of protein backbone torsional angles (φ and ξ) using the vector average method of circular statistics (Batschelet 1981; Wang et al. 1999). In Figure 5 ▶, we present the RMS fluctuation of φ as a function of residue number. In most of the regions including the loop regions of the three proteins, the RMS fluctuations of φ are small, less than 20°. The two large fluctuations (30°–40°) of the L55P-TTR monomer occur at G57–L58 (near the beginning of the D–E loop) and A120 (in the middle of the H-strand), respectively. A large fluctuation at V121 (in the middle of the H-strand) of the WT-TTR monomer is also observed. However, no large RMS fluctuation of φ is observed in the simulation of the V30M-TTR monomer except the N terminal loop (residues 1–9; Fig. 5 ▶). For the α-helix, the RMS fluctuations of φ are small in the three proteins. This indicates that the large RMS fluctuations in the α-helix region observed in the L55P and V30M TTR monomers (Fig. 3 ▶) are mainly related to the rigid body movements of this region.
Figure 5.

The RMS fluctuation of backbone torsional angle φ as a function of residue number for the last 1.2 nsec. The β-strands are named from A to H. “h” denotes α-helix.
To illustrate the persistence of the hydrogen bonds between backbone amide groups in the β-sandwich region, we listed the hydrogen bond occupancy during the last 1.2 nsec of the simulations in Table 1. For all of the three proteins, most of the hydrogen bonds connecting the C-, B-, E-, and F-strands are persistent, with more than 90% occupancy. Two less stable hydrogen bonds are found between the C- and B-strands in the L55P-TTR monomer, E42(HN)-R34(O) and F44(HN)-V32(O), with 59.5% and 78.0% occupancy, respectively. Besides the disruption of the hydrogen bonds between the D- and A-strands in the L55P-TTR monomer, some of the hydrogen bonds connecting the A-, G-, and H-strands are also broken or show low persistency in the L55P-TTR monomer, consistent with the secondary structure analysis (Fig. 4A ▶). For example, the hydrogen bonds, M13(HN)-Y105(O), I107(HN)-M13(O), A109(HN)-K15(O), and L111(HN)-L17(O), connecting the A- and G-strands in the L55P-TTR monomer are seen relatively infrequent with occupancy 52.8%, 32.3%, 65.6%, and 65.1%, respectively. The hydrogen bonds between the G- and H-strands involving A108 and T119 of the L55P-TTR monomer are broken in the simulation. The disruption of this pair of hydrogen bonds is related to the large fluctuation of φ at A120 (Fig. 5 ▶) and ϕ at T119-A120 (RMS fluctuation ϕT119 = 30.6°, RMS fluctuation ϕA120 = 32.1°). The following hydrogen bonds between the G- and H-strands in the WT-TTR monomer are also found with low occupancy (∼60%): T106(HN)-V121(O), V121(HN)-T106(O), and A108(HN)-T119(O), in agreement with the secondary structure analysis of the WT-TTR monomer where some disruptions of the H-strand are seen near the end of the simulation (Fig. 4A ▶) and the large RMS fluctuation of φ at V121 (Fig. 5 ▶). For the V30M-TTR monomer, all of the backbone hydrogen bonds in the β-sandwich region are persistent during the simulation.
Table 1.
Hydrogen bond occupancy for the backbone atoms in the β sheet region during the last 1.2 nsec
| Strands | WT-TTR | V30M-TTR | L55P-TTR | |||
| Donor-acceptor | % | Donor-acceptor | % | Donor-acceptor | % | |
| C & B | V30-G47 | 99.8 | M30-G47 | 100.0 | V30-G47 | 99.9 |
| G47-V30 | 98.0 | G47-M30 | 99.8 | G47-V30 | 96.0 | |
| V32-A45 | 99.8 | V32-A45 | 100.0 | V32-A45 | 100.0 | |
| A45-V32 | 98.4 | A45-V32 | 97.3 | A45-V32 | 99.1 | |
| R34-E42 | 100.0 | R34-E42 | 100.0 | R34-E42 | 100.0 | |
| E42-R34 | 97.4 | E42-R34 | 96.3 | E42-R34 | 59.5 | |
| F44-V32 | 96.5 | F44-V32 | 99.5 | F44-V32 | 78.0 | |
| B & E | H31-E72 | 99.6 | H31-E72 | 100.0 | H31-E72 | 100.0 |
| E72-H31 | 100.0 | E72-H31 | 100.0 | E72-H31 | 99.9 | |
| F33-K70 | 100.0 | F33-K70 | 100.0 | F33-K70 | 99.8 | |
| K70-F33 | 99.9 | K70-F33 | 100.0 | K70-F33 | 100.0 | |
| K35-I68 | 100.0 | K35-I68 | 99.9 | K35-I68 | 99.9 | |
| E & F | G67-A97 | 99.3 | G67-A97 | 88.3 | G67-A97 | 99.5 |
| A97-G67 | 99.4 | A97-G67 | 99.8 | A97-G67 | 99.6 | |
| Y69-F95 | 100.0 | Y69-F95 | 100.0 | Y69-F95 | 100.0 | |
| F95-Y69 | 100.0 | F95-Y69 | 100.0 | F95-Y69 | 100.0 | |
| V71-V93 | 99.8 | V71-V93 | 99.8 | V71-V93 | 99.9 | |
| V93-V71 | 91.6 | V93-V71 | 99.3 | V93-V71 | 99.9 | |
| I73-A91 | 98.9 | I73-A91 | 98.9 | I73-A91 | 98.8 | |
| A91-I73 | 99.9 | A91-I73 | 100.0 | A91-I73 | 99.8 | |
| D & A | V14-L55 | 86.6 | V14-L55 | 99.5 | V14-P55 | 0.0 |
| L55-V14 | 96.1 | L55-V14 | 99.4 | P55-V14 | 0.0 | |
| A & G | M13-Y105 | 99.0 | M13-Y105 | 100.0 | M13-Y015 | 52.8 |
| K15-I107 | 99.4 | K15-I107 | 99.5 | K15-I107 | 77.1 | |
| L17-A109 | 99.9 | L17-A109 | 99.8 | L17-A109 | 97.9 | |
| I107-M13 | 99.5 | I107-M13 | 99.9 | I107-M13 | 32.3 | |
| A109-K15 | 83.6 | A109-K15 | 98.8 | A109-K15 | 65.6 | |
| L111-L17 | 99.8 | L111-L17 | 100.0 | L111-L17 | 65.1 | |
| G & H | R104-T123 | 100.0 | R104-T123 | 100.0 | R104-T123 | 100.0 |
| T123-R104 | 99.6 | T123-R104 | 99.5 | T123-R104 | 99.5 | |
| T106-V121 | 63.8 | T106-V121 | 100.0 | T106-V121 | 99.9 | |
| V121-T106 | 61.6 | V121-T106 | 99.3 | V121-T106 | 95.6 | |
| A108-T119 | 60.4 | A108-T119 | 97.5 | A108-T119 | 0.0 | |
| T119-A108 | 94.5 | T119-A108 | 94.3 | T119-A108 | 0.0 | |
| L110-S117 | 96.1 | L110-S117 | 99.3 | L110-S117 | 90.6 | |
| S117-L110 | 99.3 | S117-L110 | 99.8 | S117-L110 | 91.1 | |
For a qualitative analysis of the nonbonded interaction between the two halves of the β-sandwich (the CBEF and DAGH sheets), we calculated Coulomb and van der Waals interactions between these two regions. In Figure 6 ▶, we present the nonbonded interaction energy as a function of simulation time for the last 1.2 nsec. The mean value of the nonbonded interaction energy for the WT-TTR monomer is −45.2 kcal/mole (standard deviation = 5.4 kcal/mole). This value is significant lower than that of the L55P-TTR monomer (mean = −34.7 kcal/mole, standard deviation = 4.4 kcal/mole) and of the V30M-TTR monomer (mean = −31.4 kcal/mole, standard deviation = 5.0 kcal/mole). These calculations may indicate that the packing between the CBEF and DAGH sheets is more compact in the WT-TTR monomer. A comparison between the X-ray structures of the WT-TTR and the V30M-TTR tetramers has suggested that the methionine side-chain forces the BCEF and DAGH sheets to move apart (Hamilton et al. 1993). The less favorable nonbonded interaction between these two sheets in the V30M-TTR monomer (Fig. 6 ▶) is in accord with the X-ray structure comparison, although this displacement is not evident when we superimpose the average structures of the WT and V30M TTR monomers. Moreover, the percentage of native contacts can also indicate the compactness of structure during the simulation. As seen in Figure 7A ▶, on average, the β-sheet regions maintain approximately 93% of the native contacts during the three simulations. Therefore, overall, the point mutations do not significantly change the native contacts in the β-sandwich, although disruptions of the secondary structure are seen in the L55P-TTR and V30M-TTR monomers. Note that we consider two residues to contact with each other if any heavy atom (C, N, O, S) of one residue is within 4.5 Å from any heavy atom of the other residue (Daggett and Levitt 1993). This is a rough estimate and less restrictive than the secondary structure assignment by DSSP. However, the native contacts for the entire protein vs. the simulation time (Fig. 7B ▶) show that the WT-TTR monomer maintains a higher percentage of native contacts than its variants. This indicates that the rearrangements of the loops and the α-helix of the L55P-TTR and V30M-TTR monomers cause the loss of some native contacts. Furthermore, the low percentage of native contacts of the V30M-TTR monomer from 660 to 1163 psec coincides with the disruption of the α-helix (Fig. 4A ▶).
Figure 6.

The nonbonded interaction energy (Coulomb interaction and van der Waals interaction) between the CBEF and DAGH sheets as a function of simulation time for the last 1.2 nsec. See Materials and Methods for the residue ranges that make up the two sheets.
Figure 7.


(A) The percentage of native contacts in the β-sheet region for the last 1.2 nsec. Block averaging was used with 15 psec per block. See Materials and Methods for the residue ranges that make up the two sheets. (B) The percentage of native contacts for the entire monomers during the last 1.2 nsec. Block averaging was used with 15 psec per block.
Discussion
The results presented in this article indicate that the L55P-TTR monomer undergoes substantial structural changes relative to fluctuations observed in the WT and V30M TTR monomers. However, the overall contacts in the β-sandwich region remain native-like in the three simulations. Our results show the correlation between the conformational flexibility and stability of the TTR monomers and the amyloidogenic potential of the proteins.
Recently, Walsh and coworkers have carried out calorimetric study on WT-TTR as well as monitored the ultraviolet circular dichroic spectroscopy as a function of temperature (Chung et al. 2001). Their results have suggested that the denaturation process of WT-TTR is not a simple two-state unfolding but one that involves multistep transitions. The proposed model of the transitions is from the tetrameric form to dimers, and dimers to monomers with major irreversible changes in the loop, coil, and turn regions and minor reversible changes in the β-sheet and α-helix regions (Chung et al. 2001). These results are in agreement with our present simulation of the WT-TTR monomer by which we have observed some large RMS deviations in the A–B, B–C, F–G, and G–H loops (Fig. 2B ▶), while the secondary structure and native contacts in the β-sheet and α-helix region retain native-like (Figs. 4A, 7 ▶ ▶). Longer simulations may reveal further conformational changes. Enhanced sampling methods may help to explore more conformation spaces, for example, to employ Generalized Born model (GB; Still et al. 1990; Bashford and Case 2000) to replace the explicit water MD simulation (work in progress in our group). With the GB model, the simulation may quickly converge or explore multimetastable states due to the lack of frictional forces caused by explicit water molecules and the smoothness of the energy landscape without the reorganization of water molecules. However, caution must be used when the GB model is employed because it has not been extensively tested and the continuum model itself may break down for some systems.
Our present computational work also provides insight into the high tendency toward amyloid formation that resulted from certain single-point mutations. With the computational approaches, we can separate the monomeric conformational changes from the process of tetramer dissociation, given that the monomeric form initially remains native-like after the tetramer dissociation (Liu et al. 2000), and simulate the conformational changes at the atomic level. It has been found that the D- and C-strands, so-called “edge strands” of the protein, exhibit the highest frequency of mutation (Serpell et al. 1996). Our present work suggests that the Leu55 to Pro55 mutation affects the secondary structural integrity of the monomeric form that may accelerate the process of amyloid formation. In other words, the disruption of the “edge strand” may cause further disruption of the β-sandwich structure, initiating the conversion of normal soluble protein to amyloid deposit. Interestingly, a designed double mutant (V14→ N and V16 →Q) has shown a higher potential to form amyloid than L55P mutant (Olofsson et al. 2001). These two valines, which are located in the A-strand, are buried in a hydrophobic environment in WT-TTR. A pair of hydrogen bonds is formed between V14 and L55 through the backbone amide groups, while the amide hydrogen of V16 forms a hydrogen bond with the carbonyl oxygen of G53. Once the two valines are replaced by the hydrophilic residues, some conformational changes involving the D-strand and the A-strand are expected, leading to the higher tendency towards amyloid. Our simulation results support earlier speculation that the partial disruption of the β-sheet structure through the disorder of the “edge strands” might facilitate amyloidogenesis (Kelly and Lansbury 1994; Serpell et al. 1996).
Materials and methods
Protocols of MD simulation
Each MD simulation was carried out in water at constant temperature, 300 K, and constant pressure, 1 bar. The protonation state of ionizable groups was treated at neutral pH during all of our simulations. The AMBER (Pearlman et al. 1995) program and the all-atom force field parameters of parm94 (Cornell et al. 1995) were employed. To keep the whole system neutral, Na+ counterions were added. The TIP3P three-site rigid water model (Jorgensen 1982) was used to solvate the protein and counter ions. The minimum distance of a protein atom to the edge of the rectangular water box was 12 Å. In summary, the system was constructed using the periodic boundary conditions consisting of the protein, counter ions, and TIP3P water molecules. The MD simulations were performed in the N, P, and T ensemble. The temperature and pressure of the system were regulated using the Berendsen coupling algorithm (Berendsen et al. 1984) with a coupling constant of 0.2 psec. The particle mesh Ewald summation method (Darden et al. 1993) was used to treat the long-range electrostatic interactions. The short-range nonbonded interactions were truncated with a 9 Å cutoff. All bond lengths involving H atoms were constrained with the SHAKE algorithm (Ryckaert et al. 1977). The time step was 1.5 fsec and the nonbonded pair list was updated every 25 steps. The systems were heated to 300 K with 7.5 psec per 100 K. Trajectories were generated after 30 psec equilibration period at 300 K. The snapshots were collected every 1.5 psec along the trajectories.
Analyses of the MD trajectories
The fluctuation of backbone torsional angles was calculated using vector average method in circular statistics (Batschelet 1981; Wang et al. 1999). Because the fluctuations of φ and ϕ show similar patterns, we only plot the fluctuation of φ as a function of residue number in Figure 5 ▶. We analyzed the hydrogen bonds and secondary structure using the DSSP method (Kabsch and Sander 1983). The energy cutoff for a hydrogen bond was −0.5 kcal/mole (Kabsch and Sander 1983). The nonbonded energy (Coulomb interaction and van der Waals interaction) between the β-sheets was calculated with the ANAL module in AMBER. The dielectric constant was set to 1, and no cutoff was used in this calculation. The residue ranges that make up the two β-sheets are listed in the following WT-TTR: Strand A (L12–D18), Strand B (A29–K35), Strand C (W41–K48), Strand D (E54–L55), Strand E (G67–I73), Strand F (A91–A97), Strand G (R103–L111), Strand H (Y116–N124). To calculate the percentage of native contacts, we first calculated the number of contacts in the initial structure of the simulation (N0), which denotes the number of native contacts. Two residues are considered to contact with each other if any heavy atom (C, N, O, S) of one residue is within 4.5 Å from any heavy atom of the other residue (Daggett and Levitt 1993). The nearest neighbors were excluded. The percentage of native contacts is defined as Ni/N0 * 100%, where Ni is the number of native contacts of the ith snapshot along the trajectory.
Acknowledgments
The molecular graphics images were generated using the Chimera (Huang et al. 1996) package from the Computer Graphics Laboratory, University of California, San Francisco (supported by NIH P41 RR-01081). We thank the National Center of Supercomputing Applications and the Scientific Computing and Visualization group at Boston University for providing computational resources. S. Huo thanks Dr. David A. Case for helpful discussion.
The publication costs of this article were defrayed in part by payment of page charges. This article must therefore be hereby marked “advertisement” in accordance with 18 USC section 1734 solely to indicate this fact.
Abbreviations
TTR, transthyretin
SSA, senile systemic amyloidosis
FAP, familial amyloid polyneuropathy
SDS-PAGE, sodium dodecyl sulfate-polyacrylamide gel electrophoresis
D-H exchange, deuterium-proton exchange
Article and publication are at http://www.proteinscience.org/cgi/doi/10.1110/ps.0239703.
References
- Adams, D. and Said, G. 1996. Ultrastructural immunolabelling of amyloid fibrils in acquired and hereditary amyloid neuropathies. J. Neurol. 243 63–67. [DOI] [PubMed] [Google Scholar]
- Bashford, D. and Case, D.A. 2000. Generalized born models of macromolecular solvation effects. Annu. Rev. Phys. Chem. 51 129–152. [DOI] [PubMed] [Google Scholar]
- Batschelet, E. 1981. Circular statistics in biology. Academic Press, Inc., New York.
- Berendsen, H.J.C., Postma, J.P.M., van Gunsteren, W.F., DiNola, A., and Haak, J.R. 1984. Molecular dynamics with coupling to an external bath. J. Chem. Phys. 81 3684–3690. [Google Scholar]
- Blake, C.C., Geisow, M.J., Oatley, S.J., Rerat, B., and Rerat, C. 1978. Structure of prealbumin: Secondary, tertiary and quaternary interactions determined by Fourier refinement at 1.8 Å. J. Mol. Biol. 121 339–356. [DOI] [PubMed] [Google Scholar]
- Chung, C.M., Connors, L.H., Benson, M.D., and Walsh, M.T. 2001. Biophysical analysis of normal transthyretin: Implications for fibril formation in senile systemic amyloidosis. Amyloid 8 75–83. [DOI] [PubMed] [Google Scholar]
- Cornell, W.D., Cieplak, P., Bayly, C.I., Gould, I.R., Merz, J.K.M., Ferguson, D.M., Spellmeyer, D.C., Fox, T., Caldwell, J.W., and Kollman, P.A. 1995. A second generation force field for the simulation of proteins, nucleic acid, and organic molecules. J. Am. Chem. Soc. 117 5179–5197. [Google Scholar]
- Cornwell, G.G., Sletten, K., Johansson, B., and Westermark, P. 1988. Evidence that the amyloid fibril protein in senile systemic amyloidosis is derived from normal prealbumin. Biochem. Biophys. Res. Commun. 154 648–653. [DOI] [PubMed] [Google Scholar]
- Daggett, V. and Levitt, M. 1993. Protein unfolding pathways explored through molecular dynamics simulations. J. Mol. Biol. 232 600–619. [DOI] [PubMed] [Google Scholar]
- Darden, T., York, D., and Pedersen, L. 1993. Particle mesh ewald: A n-log(n) method for ewald sums in large systems. J. Chem. Phys. 98 10089–10092. [Google Scholar]
- Hagen, G.A. and Elliott, W.J. 1973. Transport of thyroid hormones in serum and cerebrospinal fluid. J. Clin. Endocrinol. Metab. 37 415–422. [DOI] [PubMed] [Google Scholar]
- Hamilton, J.A., Steinrauf, L.K., Braden, B.C., Liepnieks, J., Benson, M.D., Holmgren, G., Sandgren, O., and Steen, L. 1993. The x-ray crystal structure refinements of normal human transthyretin and the amyloidogenic val-30→met variant to 1.7 Å resolution. J. Biol. Chem. 268 2416–2424. [PubMed] [Google Scholar]
- Huang, C.C., Couch, G.S., Pettersen, E.F., and Ferrin, T.E. 1996. Chimera: An extensible molecular modeling application constructed using standard components. Pacific Symposium on Biocomputing ’96. World Scientific Publishing Co. Inc., River Edge, NJ.
- Jorgensen, W.L. 1982. Revised TIPS for simulations of liquid water and aqueous solutions. J. Chem. Phys. 77 4156–4163. [Google Scholar]
- Kabsch, W. and Sander, C. 1983. Dictionary of protein secondary structure: Pattern recognition of hydrogen-bonded and geometrical features. Biopolymers 22 2577–2637. [DOI] [PubMed] [Google Scholar]
- Kanai, M., Raz, A., and Goodman, D.S. 1968. Retinol binding protein—The transport protein for vitamin A in human plasma. J. Clin. Invest. 47 2025–2044. [DOI] [PMC free article] [PubMed] [Google Scholar]
- Kelly, J.W. 1996. Alternative conformations of amyloidogenic proteins govern their behavior. Curr. Opin. Struct. Biol. 6 11–17. [DOI] [PubMed] [Google Scholar]
- ———. 1998. The alternative conformations of amyloideogenic proteins and their multi-step assembly pathways. Curr. Opin. Struct. Biol. 8 101–106. [DOI] [PubMed] [Google Scholar]
- Kelly, J.W. and Lansbury, P.T. 1994. A chemical approach to elucidate the mechanism of transthyretin and B protein amyloid fibril formation. Amyloid Int. J. Exp. Clin. Invest. 1 186–205. [Google Scholar]
- Klabunde, T., Petrassi, H.M., Oza, V.B., Raman, P., Kelly, J.W., and Sacchettini, J.C. 2000. Rational design of protein human transthyretin amyloid disease inhibitors. Nat. Struct. Biol. 7 312–321. [DOI] [PubMed] [Google Scholar]
- Lai, Z., Colon, W., and Kelly, J.W. 1996. The acid-mediated denaturation pathway of transthyretin yields a conformational intermediate that can self-assemble into amyloid. Biochemistry 35 6470–6482. [DOI] [PubMed] [Google Scholar]
- Lashuel, H.A., Lai, Z., and Kelly, J.W. 1998. Characterization of the transthyretin acid denaturation pathways by analytical ultracentrifugation: Implications for wild-type, V30M, and L55P amyloid fibril formation. Biochemistry 37 17851–17864. [DOI] [PubMed] [Google Scholar]
- Lashuel, H.A., Wurth, C., Woo, L., and Kelly, J.W. 1999. The most pathogenic transthyretin variant, L55P, forms amyloid fibrils under acidic conditions and protofilaments under physiological conditions. Biochemistry 38 13560–13573. [DOI] [PubMed] [Google Scholar]
- Liu, K., Cho, H.S., Lashuel, H.A., Kelly, J.W., and Wemmer, D.E. 2000. A glimpse of a possible amyloidogenic intermediate of transthyretin. Nat. Struct. Biol. 7 754–757. [DOI] [PubMed] [Google Scholar]
- McCutchen, S.L., Colon, W., and Kelly, J.W. 1993. Transthyretin mutation leu-55-pro significantly alters tetramer stability and increases amyloidogenicity. Biochemistry 32 12119–12127. [DOI] [PubMed] [Google Scholar]
- McCutchen, S.L., Lai, Z., Miroy, G.J., Kelly, J.W., and Colon, W. 1995. Comparison of lethal and nonlethal transthyretin variants and their relationship to amyloid disease. Biochemistry 34 13527–13536. [DOI] [PubMed] [Google Scholar]
- Nettleton, E.J., Sunde, M., Lai, Z., Kelly, J.W., Dobson, C.M., and Robinson, C.V. 1998. Protein subunit interactions and structural integrity of amyloidogenic transthyretins: Evidence from electrospray mass spectrometry. J. Mol. Biol. 281 553–564. [DOI] [PubMed] [Google Scholar]
- Nilsson, S.F., Rask, L., and Peterson, P.A. 1975. Studies on thyroid hormone-binding proteins. II. Binding of thyroid hormones, retinol-binding protein, and fluorescent probes to prealbumin and effects of thyroxine on prealbumin subunit self association. J. Biol. Chem. 250 8554–8563. [PubMed] [Google Scholar]
- Olofsson, A., Ippel, H.J., Baranov, V., Horstedt, P., Wijmenga, S., and Lundgren, E. 2001. Capture of a dimeric intermediate during transthyretin amyloid formation. J. Biol. Chem. 276 39592–39599. [DOI] [PubMed] [Google Scholar]
- Pearlman, D., Case, D.A., Caldwell, J.W., Ross, W.S., Cheatham, T.E., DeBolt, S., Ferguson, D., Seibel, G., and Kollman, P.A. 1995. Amber, a package of computer-programs for applying molecular mechanics, normal-mode analysis, molecular-dynamics and free energy calculations to simulate the structural and energetic properties of molecules. Comp. Phys. Commun. 91 1–41. [Google Scholar]
- Quintas, A., Saraiva, M.J., and Brito, R.M. 1999. The tetrameric protein transthyretin dissociates to a non-native monomer in solution. A novel model for amyloidogenesis. J. Biol. Chem. 274 32943–32949. [DOI] [PubMed] [Google Scholar]
- Quintas, A., Vaz, D.C., Cardoso, I., Saraiva, M.J., and Brito, R.M. 2001. Tetramer dissociation and monomer partial unfolding precedes protofibril formation in amyloidogenic transthyretin variants. J. Biol. Chem. 276 27207–27213. [DOI] [PubMed] [Google Scholar]
- Ryckaert, J.P., Ciccotti, G., and Berendsen, H.J.C. 1977. Numerical integration of the cartesian equations of motion for a system with constraints: Molecular dynamics of n-alkanes. J. Comp. Phys. 23 327–341. [Google Scholar]
- Sacchettini, J.C. and Kelly, J.W. 2002. Therapeutic strategies for human amyloid diseases. Nat. Rev. Drug. Discov. 1 267–275. [DOI] [PubMed] [Google Scholar]
- Saraiva, M.J., Costa, P.P., and Goodman, D.S. 1983. Studies on plasma transthyretin (prealbumin) in familial amyloidotic polyneuropathy, Portuguese type. J. Lab. Clin. Med. 102 590–603. [PubMed] [Google Scholar]
- Saraiva, M.J., Birken, S., Costa, P.P., and Goodman, D.S. 1984. Amyloid fibril protein in familial amyloidotic polyneuropathy, portuguese type. Definition of molecular abnormality in transthyretin (prealbumin). J. Clin. Invest. 74 104–119. [DOI] [PMC free article] [PubMed] [Google Scholar]
- Schreiber, G., Southwell, B.R., and Richardson, S.J. 1995. Hormone delivery systems to the brain-transthyretin. Exp. Clin. Endocrinol. Diabetes 103 75–80. [DOI] [PubMed] [Google Scholar]
- Sebastiao, M.P., Saraiva, M.J., and Damas, A.M. 1998. The crystal structure of amyloidogenic leu55 → pro transthyretin variant reveals a possible pathway for transthyretin polymerization into amyloid fibrils. J. Biol. Chem. 273 24715–24722. [DOI] [PubMed] [Google Scholar]
- Serpell, L., Goldstein, G., Dacklin, I., Lundgren, E., and Blake, C.C.F. 1996. The “edge strand” hypothesis: Prediction and test of a mutational “hot spot” on the transthyretin molecule associated with fap amyloidogenesis. Amyloid Int. J. Exp. Clin. Invest. 3 75–85. [Google Scholar]
- Still, W.C., Tempczyk, A., Hawley, R.C., and Hendrickson, T. 1990. Semianalytical treatment of solvation for molecular mechanics and dynamics. J. Am. Chem. Soc. 112 6127–6129. [Google Scholar]
- Wang, L., Duan, Y., Shortle, R., Imperiali, B., and Kollman, P.A. 1999. Study of the stability and unfolding mechanism of bba1 by molecular dynamics simulations at different temperatures. Protein Sci. 8 1292–1304. [DOI] [PMC free article] [PubMed] [Google Scholar]
- Westermark, P., Sletten, K., Johansson, B., and Cornwell, G.G. 1990. Fibril in senile systemic amyloidosis is derived from normal transthyretin. Proc. Natl. Acad. Sci. 87 2843–2845. [DOI] [PMC free article] [PubMed] [Google Scholar]