

Abstract
Understanding, and ultimately predicting, how a 1-D protein chain reaches its native 3-D fold has been one of the most challenging problems during the last few decades. Data increasingly indicate that protein folding is a hierarchical process. Hence, the question arises as to whether we can use the hierarchical concept to reduce the practically intractable computational times. For such a scheme to work, the first step is to cut the protein sequence into fragments that form local minima on the polypeptide chain. The conformations of such fragments in solution are likely to be similar to those when the fragments are embedded in the native fold, although alternate conformations may be favored during the mutual stabilization in the combinatorial assembly process. Two elements are needed for such cutting: (1) a library of (clustered) fragments derived from known protein structures and (2) an assignment algorithm that selects optimal combinations to "cover" the protein sequence. The next two steps in hierarchical folding schemes, not addressed here, are the combinatorial assembly of the fragments and finally, optimization of the obtained conformations. Here, we address the first step in a hierarchical protein-folding scheme. The input is a target protein sequence and a library of fragments created by clustering building blocks that were generated by cutting all protein structures. The output is a set of cutout fragments. We briefly outline a graph theoretic algorithm that automatically assigns building blocks to the target sequence, and we describe a sample of the results we have obtained.
Keywords: Protein folding, building blocks, protein structure prediction, hierarchical folding, folding complexity
How a 1-D polypeptide chain folds into a 3-D fold is a fascinating yet unsolved problem, despite the improvements made in the methodologies. All the information needed to specify the protein 3-D structure is contained within its amino acid sequence, and given suitable conditions, many proteins will spontaneously fold into their native states. Many others require the assistance of chaperones. Proteins that fold with the aid of chaperones will also fold spontaneously but not on biological timescales.
Several models have been proposed for protein folding, including (1) the framework model, (2) the nucleation and growth mechanism, (3) the diffusion-collision model, (4) the hydrophobic collapse model, and (5) the hierarchical model (Haspel et al. 2003). In recent years, a folding scheme (Rose 1979; Lesk and Rose 1981) proposed over two decades ago has been increasingly accepted: Protein folding is a hierarchical process (Baldwin and Rose 1999a,b) and the driving force is the hydrophobic effect (Dill 1985, Dill 1990; Dill and Chan 1997). This idea was further expanded by Srinivasan and Rose (1995, 1999). The main considerations are steric effects and conformational entropy, and the driving forces are hydrophobic interactions and hydrogen bond formation. Srinivasan and Rose start with folding small fragments of the protein, sampling random local conformations and scoring them according to how energetically favorable they are. The process repeats itself until the entire protein chain is folded. Limited proteolysis has illustrated that one can cut the protein structure into fragments and reassemble them through fragment complementation to yield the native fold (Taniuchi et al. 1986; Fisher and Taniuchi 1992; Fontana et al. 1997, 1999; Kuhlman et al. 1997; Yang et al. 1998; Polverino de Laureto et al. 1999, 2001). And, conversely, covalently ligating two protein molecules bound in a complex still leads to the same native complex (for review, see Tsai et al. 2001).
Computationally, there are several approaches to predict protein structures. If the target sequence is similar to sequences whose corresponding structures are available, homology modeling is the best approach to follow. If the similarity is lower, threading is often carried out. If no homologous sequences with corresponding structures are available in the Protein Data Bank (PDB; Bernstein et al. 1977), ab initio simulations are attempted, if the sequences are short. Otherwise, the sequence may be parsed into short, overlapping segments (say, ∼8–10 residues in length) and look-up tables for the potential structures of these are entered. These tables are generated through analysis of most available structures in the PDB. Combinations of these structures are evaluated and ranked (Bystroff and Baker 1998; Bystroff et al. 2000).
Here we adopt a strategy that is based on hierarchical protein-folding concepts (Crippen 1978; Rose 1979; Wodak and Janin 1981; Zehfus and Rose 1986; Zehfus 1993; Wu et al. 1995; Panchenko et al. 1996, 1997; Peng and Wu 2000). As previously, the sequence is cut into segments. However, the major difference between the strategy followed here and previous ones is that here the target sequence is cut into longer fragments, each of which is in principle able to fold independently and is assumed, based on a stability scoring function, to be a local minimum. That is, the fragments are not chosen arbitrarily, but are chosen on the basis of their stability properties. Although there are no direct experimental data indicating that these fragments are able to fold independently, there is a fairly good correspondence between the computationally generated fragments and those obtained from limited proteolysis, for proteins for which such experimental data exist (Tsai et al. 2002). The minimal fragment size is 15 residues. The maximum can be any value. The stabilities (and population times) of these fragments differ. Figure 1 ▶ describes our scheme. The first step involves cutting the target sequence into building blocks and assigning their conformations. In the second step, the building blocks are assembled combinatorially. In the third step, the structure is refined to finally yield the predicted conformation. A major advantage of such an approach is that, by cutting the target sequence into fragments and assembling them, we may be able to achieve a substantial reduction in computational times. The rationale behind such a scheme is that it follows hierarchical protein-folding pathways: Initially, local fragments fold on themselves, with subsequent stepwise assembly. To be able to adopt such a strategy, we need several elements:
Clusters of "known" building blocks in which each cluster contains a list of sequences, along with their experimentally determined structures.
An efficient algorithm to assign these building blocks to a target sequence on the basis of sequence similarity and a weighting function.
An efficient combinatorial assembly algorithm to find the optimal arrangements of the assigned building blocks in 3-D space.
An efficient docking algorithm that docks the building blocks, with an adequate weighting function to rank the obtained conformations.
A modeling/simulation protocol to fill in the gaps or small overlaps in the assignments (if any) between the assigned building blocks and optimize the structures.
Figure 1.

Folding by parts and part assembly: A hierarchy-based protein folding scheme. The overall folding scheme, composed of three steps: The first step involves cutting the target sequence into building blocks and assigning their conformations (this stage is described in this work). In the second step, the building blocks are assembled combinatorially. In the third step, the structure is refined to yield the predicted conformation.
In this work we address the first step in this scheme, the cutting of the target sequence into building block fragments:
We first describe the building block clusters obtained by clustering all the building blocks that were generated by cutting all proteins in the PDB. These are clustered first by their structures and subsequently by their sequences to generate a nonredundant sequence database. Examples of structural clusters are given in Figure 2 ▶.
We next proceed to describe the graph theoretic assignment algorithm (a flowchart and an outline are given in Figures 3 and 4 ▶ ▶). The algorithm automatically assigns building blocks to the target sequence.
Finally, we give some examples (Fig. 5A–F ▶).
Figure 2.

Two examples of clusters. The figures show multiple structural alignments using MUSTA (Leibowitz et al. 2001a,b) of the cluster members. The inserts give the file names and the range of residues. (A) (1bdc) Immunoglobulin-binding protein A modules from Staphylococcus aureus (domain B); (1grl) GroEL from Escherichia coli; (2pas) parvalbumin from pike; (1edi) immunoglobulin-binding protein A modules from S. aureus (domain E). (B) (1coy) Cholesterol oxidase from Brevibacterium sterolicum; (1gal) glucose oxidase from Aspergillus niger; (1gnd) guanine nucleotide dissociation inhibitor, GDI, from cow; (1ldm) lactate dehydrogenase from dogfish.
Figure 3.

A flowchart of the building block assignment algorithm.
Figure 4.

An illustration of the building block assignment algorithm. (A) The protein sequence is aligned against a building block sequence database using BLAST. (B) A weighted directed acyclic graph is built from the aligned building blocks, plus start and target vertices. (C) The "shortest" path is the "best" building block assignment to the target sequence.
Figure 5.


Examples of the building block assignment algorithm. (A) The target protein is chain A of glutathione S-transferase from human, class pi (PDB code 13gs). (B) The target protein is pseudoazurin from Alcaligenes faecalis (PDB code 1paz). (C) The target protein is immunoglobulin from human (PDB code 2imm). (D) The target protein is chain D of barstar (barnase inhibitor) from Bacillus amyloliquefaciens (PDB code 1brs). (E) The target protein is chain A of anti-sigma factor antagonist SpoIIaa from Bacillus sphaericus (PDB code 1h4x). (F) The target protein is Clp protease, ClpP subunit from Escherichia coli (PDB code 1tyf). The inserts shows the matched building block sequences. (See also Table 2.)
Two considerations are implicit in such a scheme: that the building block cutting is consistent with experiment, and that the cutout building blocks largely reflect fragments with prevailing similar conformations even when in different environments. We address these issues following.
The building block folding model (Tsai et al. 2000, 2001) enables visualizing the protein dynamical folding pathways. The model postulates that protein folding is a hierarchical process and that the basic unit from which a fold is constructed, the hydrophobic folding unit (HFU), is the outcome of a combinatorial assembly of a set of building blocks. The HFUs, in turn, associate to form intramolecular domains. The building block is defined as a highly populated, contiguous fragment in a given protein structure. According to this model, if one cuts out a building block from the protein chain, the most highly populated conformation of the resulting peptide in solution would very likely be similar to that of the building block when it is embedded in the native protein structure, even though it may happen that an alternative conformation is selected in the combinatorial assembly process. The algorithm creates an "anatomy tree" that depicts the organization of the 1-D polypeptide chain in 3-D space and describes the most likely folding pathway(s). Each node in the tree is a one-segment building block. Here, the level of a building block node in the tree will be referred to as the cutting level of that building block. This model can be used as a basis for protein modeling and prediction of local and global protein structures.
Results
Building block database creation and clustering
Table 1 gives some building block cluster statistics for each protein class and cutting level (Haspel et al. 2003). The parameters of the clustering lead to small clusters (many are one-membered). More flexible parameters would have led to fewer clusters, but with lesser member similarity. We preferred to have structurally similar cluster members. For each cluster, the sequences of the members were extracted and reclustered, such that we were able to represent each cluster by a minimum number of nonredundant, representative sequences. Sequence conservation within clusters changes considerably from cluster to cluster. There were many clusters in which the building blocks were nearly identical. These cases usually represent building blocks derived from the same protein family. Table 1 gives sequence information for each cluster, the number of sequences, and their average sequence length. Figure 2 ▶ shows two examples of clusters, using MUSTA, our multiple structural comparison algorithm (Leibowitz et al. 2001a,b). The figure shows the superposition of the cluster members and the sequence alignment. In these examples the cluster members do not all belong to the same sequence family. For clarity, not all cluster members are shown. Building blocks that are nearly identical, sequentially and structurally, to ones that are represented in the example are omitted. Here, one building block was taken from each sequence family. Despite the fact that the sequence identity and even similarity is not high, the structural similarity is high. In all examples the least conserved areas are, as expected, the ends of the building blocks and the irregular parts, the turns and loops, regardless of the sequence conservation at these areas. The building blocks vary from a nearly single secondary structure element (for example, an α-helix with a short loop attached to it) to an almost independent protein domain. The most frequent cases were of supersecondary structure elements, like two helices connected by a loop, or two strands and a loop.
Table 1.
Cluster statistics
| Protein classa | Cutting levelb | No. protein chainsc | No. building blocksd | No. clusterse | Average sequence lengthf | No. building block sequencesg |
| α/β | 1 | 1514 | 2121 | 515 | 154.08 | 464 |
| 2 | 1514 | 5257 | 1286 | 62.55 | 1804 | |
| 3 | 1514 | 8013 | 1899 | 38.75 | 3153 | |
| 4 | 1495 | 7813 | 1727 | 30.86 | 3137 | |
| 5 | 1174 | 9944 | 2124 | 29.37 | 3872 | |
| 6 | 595 | 5663 | 1402 | 28.94 | 2493 | |
| α + β | 1 | 1619 | 2491 | 379 | 108.58 | 457 |
| 2 | 1616 | 5445 | 828 | 49.45 | 1212 | |
| 3 | 1558 | 7454 | 1199 | 34.08 | 1929 | |
| 4 | 1339 | 7702 | 1285 | 28.98 | 2175 | |
| 5 | 520 | 4361 | 1089 | 28.38 | 1716 | |
| 6 | 153 | 1606 | 628 | 28.62 | 878 | |
| all-α | 1 | 870 | 1419 | 405 | 85.88 | 548 |
| 2 | 870 | 3181 | 751 | 41.81 | 1422 | |
| 3 | 794 | 3858 | 830 | 30.82 | 1921 | |
| 4 | 594 | 2971 | 727 | 28.62 | 1502 | |
| 5 | 263 | 2662 | 707 | 28.06 | 2131 | |
| 6 | 94 | 1299 | 466 | 29.28 | 722 | |
| all-β | 1 | 1313 | 1757 | 428 | 115.47 | 514 |
| 2 | 1311 | 3814 | 1049 | 53.58 | 1489 | |
| 3 | 1299 | 5815 | 1566 | 36.66 | 2449 | |
| 4 | 1132 | 4683 | 1456 | 32.23 | 2200 | |
| 5 | 523 | 4068 | 1283 | 30.46 | 1898 | |
| 6 | 167 | 1914 | 729 | 30.70 | 1018 |
a The protein class that created the specific database.
b The cutting level (1 to 6).
c The number of protein chains participating in that database.
d The total number of building blocks in that database.
e The number of clusters resulting from the clustering procedure of that database.
f The average sequence size at each nonredundant sequence database.
g The number of sequences in the nonredundant sequence database.
The data here was calculated only from the representatives of the clusters to avoid bias toward large families that contain nearly identical building blocks.
We analyzed the sequence conservation within clusters whose members were cut from proteins that belong to different structural classification of proteins (SCOP; Murzin et al. 1995) families. We found very little sequence conservation among building blocks from different families, both by means of amino acid identity and similarity (data not shown). Further, clustered building blocks may even belong to different folds. Thus, the fact that building blocks from different proteins with different sequences, different global structures, and different spatial environments still give building blocks that are similar provides support to the proposition that building blocks are stand-alone entities (Tsai et al. 2000, 2002). Combined, this illustrates that in building blocks, as in proteins, different sequences can share similar folds.
The distribution of the building block stability score in the cluster varies: For clusters consisting of building blocks derived from the same protein family, the distribution is narrow. This is expected, as they are very similar structurally and sequentially, and are surrounded by a very similar environment. However, clusters derived from dissimilar proteins have broad distributions of stability scores. The stability scores (described in Materials and Methods) are used in the weighting scheme of the assignment algorithm.
The building block assignment to a target sequence
Table 2 presents some results of the building block assignment to target sequences. Figure 5A–F ▶ illustrates several examples taken from Table 2 of the assigned building blocks superimposed on the target protein. The target proteins either do not appear in the original database, or were removed from it before the execution of the program, so that they will not bias the results. Further, the database used for the assignment contains mainly building blocks from more distant proteins. Improvements in both the algorithm and the weighting function still need to be carried out; nevertheless, in many cases the algorithm finds good building block assignments even when the sequence homology is rather weak. The percent sequence identity and similarity between the assigned building block and the target sequence are given in the table and in the figures. As Table 2 and Figure 5A–F ▶ show, the target protein classes and sizes vary. Furthermore, the assigned building blocks do not necessarily derive from the same protein class as the target protein. This is consistent with the building block being a stand-alone unit.
Table 2.
Results of the building block assignment algorithm
| Target protein | Matching sequences | |||||
| Protein name (class) | PDB code | Matched sequence positions | Protein name (class) | PDB code | Matched sequence positions | Percent sequence similarity (identity) |
| Squid glutathione S-transferase (α/β) | ||||||
| Human glutathione S-transferase, class pi, chain A (α/β) | 13gs | 1-32 | S. japonicum glutathione S-transferase (all-α) | 1gsq | 1-32 | 58 (40) |
| 38-72 | Methane monooxygenase hydrolase, β subunit (all-α) | 1gne | 154-184 | 53 (31) | ||
| 77-122 | Pyruvate phosphate dikinase (α/β) | 1mtyB | 345-384 | 57 (34) | ||
| 124-149 | S. japonicum glutathione S-transferase (all-α) | 1dik | 472-497 | 53 (42) | ||
| 153-185 | 1gne | 155-184 | 60 (42) | |||
| Pseudoazurin from Alcaligenes faecalis (all-β) | 1paz | 1-33 | Phosphoglycerate kinase (α/β) | 3pgk 1mn2 2cjn 1plb 1epaB | 118-147 | 45 (27) |
| 34-49 | Manganese peroxidase (all-α) | 1mn2 | 91-106 | 55 (37) | ||
| 50-70 | 2Fe-2S ferredoxin (α + β) | 2cjn | 10-30 | 51 (28) | ||
| 68-92 | Plastocyanin from parsley (all-β) | 1plb | 72-96 | 48 (36) | ||
| 93-112 | Retinoic acid-binding protein (all-β) | 1epaB | 70-90 | 52 (38) | ||
| Human immunoglobulin (all-β) | 2imm | 3-20 | Immunoglobulin Bence-Jones VL (λ) dimer RHE (all-β) | 2rhe | 3-20 | 78 (52) |
| 21-48 | 20-43 | 53 (39) | ||||
| 50-66 | Immunoglobulin Fab NC10 (all-β) | 1nmaH | 5-21 | 52 (35) | ||
| 67-84 | β2-Microglobulin from cow (all-β) | 1bmg | 85-112 | 46 (21) | ||
| 95-109 | Azurin from N. aeruginosa (all-β) | 1iluH | 81-101 | 60 (38) | ||
| Fumarase from E. coli (all-α) | 1fupA | |||||
| Barstar from B. amyloliquefaciens, chain D (α/β) | 1brs | 4-23 | Adenylate kinase from pig (α + β) | 3adk | 133-150 | 53 (33) |
| 23-37 | IU-NH from C. fasciculata (α/β) | 2masB | 294-308 | 66 (40) | ||
| 40-66 | Leu aminopeptidase from cow (α/β) | 1lap | 123-149 | 55 (33) | ||
| 66-83 | Parvalbumin from pike (all-α) | 1pvaA | 61-78 | 55 (33) | ||
| Anti-ψ factor antagonist SpoIIaa from B. sphaericus, chain A (α/β) | 1h4x | 5-21 | DNA polymerase β (α and β) | 1bpe | 154-170 | 58 (29) |
| 17-36 | Annexin XII from hydra (all-α) | 1aeiD | 249-271 | 50 (35) | ||
| 38-63 | Pepsin (ogen) from pig (all-β) | 5pep | 143-168 | 57 (34) | ||
| 65-89 | Human myeloperoxidase (all-β) | 1mhlC | 253-278 | 48 (28) | ||
| 91-108 | Histidine-binding protein (α/β) | 1hslB | 195-213 | 54 (27) | ||
| Clp protease, ClpP subunit from E. coli, chain A (α/β) | 1tyf | 6-35 | Restriction endonuclease Cfr10I (α/β) | 1cfr | 99-131 | 48 (33) |
| 41-70 | Glycogen phosphorylase (α/β) | 1noiA | 121-147 | 77 (55) | ||
| 67-94 | Leu-Ile-Val-binding protein (α/β) | 2liv | 252-279 | 45 (35) | ||
| 96-123 | Trp synthase, β-subunit (α/β) | 1ttpB | 135-165 | 57 (24) | ||
| 125-152 | Annexin IV from cow (all-α) | 1ann | 109-136 | 53 (39) | ||
| 154-171 | Chorismate mutase (α + β) | 2chtL | 12-29 | 55 (33) | ||
| Cytochrome c6 from D. vulgaris (all-α) | 1dvh | 3-39 | 3-Isopropylmalate dehydrogenase (α/β) | 1osiC | 255-291 | 40 (27) |
| 37-54 | Socitrate dehydrogenase (α/β) | 1iso | 45-62 | 55 (33) | ||
| 52-70 | Interleukin-5 from human (all-α) | 1hulB | 66-84 | 51 (36) | ||
| Phycocyanin from red alga, chain A (all-α) | 1phn | 5-26 | GreA transcript cleavage protein (all-α) | 1grj | 29-50 | 40 (40) |
| 27-53 | α-Trichosanthin (α + β) | 1tcs | 216-242 | 36 (25) | ||
| 52-88 | Phycoerythrin (all-α) | 1liaK | 52-86 | 54 (32) | ||
| 89-107 | Thioredoxin reductase (α/β) | 1vdc | 130-148 | 57 (31) | ||
| 110-128 | Adenovirus hexon (all-β) | 1dhx | 728-746 | 57 (42) | ||
| 129-145 | Plasmepsin ii (all-β) | 1smeB | 178-194 | 47 (47) | ||
| E. coli Rck domain from putative potassium channel Kch, chain B (α/β) | 1idl | 12-33 | Troponin C from chicken (all-α) | 1top | 76-97 | 58 (31) |
| 33-78 | CheY-binding domain of CheA (α + β) | 1fwp | 5-41 | 45 (28) | ||
| 80-102 | Lysozyme from chicken (α + β) | 1mlcF | 99-121 | 56 (30) | ||
| 101-132 | Lipase from B. cepacia (α/β) | 1oilA | 69-112 | 42 (27) | ||
| 130-151 | Phosducin from rat (α/β) | 2trcP | 181-205 | 60 (36) | ||
| C-terminal part of pyridoxine 5′-phosphate synthase from E. coli, chain A (α/β) | 1hol | 43-101 | Triacylglycerol lipase (α/β) | 1lgyC | 199-256 | 41 (23) |
| 106-127 | 6PGD from sheep (α/β) | 1pgq | 106-123 | 59 (50) | ||
| 124-148 | Methylamine dehydrogenase (all-β) | 2bbkJ | 322-346 | 48 (28) | ||
| 148-236 | Pyruvate phosphate dikinase (α/β) | 1dik | 664-733 | 38 (21) | ||
| Cytochrome c552 from Thermus thermophilus (all-α) | 1c52 | 6-28 | Adenovirus hexon from human adenovirus type 2 (all-β) | 1dhx | 827-849 | 39 (39) |
| 31-45 | 4dfrB | 86-100 | 53 (59) | |||
| 45-64 | DHFR from E. coli (α/β) | 1hiwA | 79-98 | 35 (60) | ||
| 73-99 | HIV-1 matrix protein (all-α) | 1pgn | 290-305 | 37 (48) | ||
| 97-112 | 6PGD from sheep (all-α) Cyclin H (mcs2) from human (all-α) | 1jkw | 259-274 | 43 (68) | ||
| YopH Tyr phosphatase N-terminal domain from Y. pestis (α + β) | 1huf | 6-20 | Staphylococcal nuclease (all-β) | 1syf | 7-21 | 33 (66) |
| 19-35 | Tyrosyl-tRNA synthetase (α/β) | 1tyaE | 77-93 | 41 (46) | ||
| 37-53 | p-Hydroxybenzoate hydroxylase (α/β) | 2phh | 161-177 | 41 (52) | ||
| 57-78 | 7-α-Hydroxysteroid dehydrogenase (α/β) | 1ahhA | 192-213 | 36 (54) | ||
| 78-94 | Methane monooxygenase hydrolase (all-α) | 1mhyD | 234-250 | 58 (35) | ||
| 94-114 | T4 endonuclease V from bacteriophage T4 (all-α) | 1enj | 4-23 | 35 (55) | ||
To see the results obtained by the assignment algorithm, in the figures the building blocks were matched to the target proteins using a flexible structural matching algorithm: FlexProt (Shatsky et al. 2002). This algorithm automatically finds the best flexible match between two protein structures without a predefinition of the hinge locations. In our cases here, the matching was done between the target protein and a dummy protein composed of the matching building blocks. FlexProt is particularly convenient for our purpose here because it enables us to disregard the structural connectivity between the building blocks in the dummy protein. It further allows us to overcome possible hinge bending within building blocks. FlexProt finds the best matching by means of the smallest RMSD. The matching shown in the figures does not necessarily include the entire matched building block, because Cα-atom pairs above the allowed matching threshold (here in the range of 3.5–4 Å) are not matched. As seen in Table 2 and Figure 5A–F ▶, in most cases the matching building blocks are from proteins from different families, and sometimes even different protein classes. Only in a few cases does the matching building block derive from the same protein family as the target protein. Even in this case it is a distant family member; therefore, the sequence similarity is rather weak. Our results yield many examples of building blocks that repeat across various protein families and folds. This shows that building blocks, which are relatively stable protein fragments, may be protein-context independent.
In the current implementation of the assignment algorithm, a shortest path is found between all the starting vertices (those connected to the "source" vertex) to the "target" vertex. This leads to more than one possible solution, that is, more than one possible building block assignment. Here we provide the "best" assignment result, that is, the result that visually looks best. We note, however, that in all cases, the weighting function ranked these results among the top three. We further note that our assignment algorithm is fully automated. The FlexProt algorithm is used only for testing and displaying the results graphically.
Discussion
In this work we have outlined the first stage of a potential way to reduce the computational complexity in protein folding. The building block folding model proposes to initiate the computational folding process by first identifying "building blocks," that is, fragments that form energetically local minima along the protein sequence. The model assumes that protein folding is a hierarchical process: Relatively stable fragments are assumed to fold first, with subsequent binding onto each other ("combinatorial assembly") to hierarchically create higher order building blocks, until the native protein fold is formed.
To be able to apply such a scheme, we need two components. The first is a sequentially nonredundant database of building blocks, each with its associated structure. The second is an efficient assignment algorithm with an appropriate weighting function. The sequentially nonredundant database of building blocks that we have created is based on our building block cutting algorithm.
Most structures in the PDB (Bernstein et al. 1977) have been cut, and the resulting building blocks have been clustered. Our sequence length-independent energy function does not account for electrostatics, and is based on the native structures; nevertheless, it is in fairly good agreement with experiment (Tsai et al. 2002). The comparisons have been carried out for all proteins for which there are available limited proteolysis data, using pepsin, subtilisin, trypsin, thermolysin, and proteinase K.
A detailed description of the clustering procedure and of the clusters is presented in Materials and Methods and also in Haspel et al. (2003). Inspection of the clusters illustrates that, although some clusters contain only building blocks from the same family, others consist of building blocks from dissimilar proteins. In such cases, although the structures of the building blocks are similar, they differ in their sequences and in their spatial interactions. This observation is consistent with the assumption that the building blocks are likely to be stand-alone units. This is particularly the case for larger fragments with a substantial hydrophobic core. Smaller building blocks also have a preferred conformation in solution, which is likely to resemble that observed in the native protein. Nevertheless, neighboring building blocks may lead to a selection of an alternate more favorable conformer.
The second component is a graph theoretic assignment algorithm that, given a protein sequence, finds the "optimal" building block assignment of that sequence. Here we have presented several examples for different proteins. The results achieved so far look promising, although considerable work is still needed to optimize and improve the performance of the algorithm. The next step in such a folding scheme is the combinatorial assembly of the assigned building blocks. Computationally this is the heaviest step. Work on this problem is already in progress in our laboratory (Inbar et al. 2003). Finally, because the target sequence is not completely covered by building blocks, the unassigned parts need to undergo modeling, with subsequent overall minimization.
The advantages inherent in "folding the protein in parts, and part assembly" have been recognized for a number of years (for review, see Hardin et al. 2002). There are two major differences between previous work (Oliva et al. 1997; Bystroff and Baker 1998; Bystroff et al. 2000) and the current work. First, previously the sequence has been cut into a large number of fragments by shifting a window across the sequence and testing a large number of sequence parts. Second, only very short sequence pieces were folded separately. However, fragments having a few (<10) residues usually do not have a prevailing 3-D conformation. Although short building block sequences usually do not have a conformation with a very high population time, nevertheless, these sequences were not chosen arbitrarily. They were selected owing to their being relatively stable with higher population times than other, arbitrarily chosen fragments. Our ability to cut the structures into building block fragments with high population times, consistent with experiment (Tsai et al. 2002) in principle enables us to cut the target sequence into building blocks. Furthermore, we have developed a procedure to identify building blocks that are critical for correct protein folding (Ma et al. 2000; Kumar et al. 2001). These building block fragments are largely buried in the protein core, inserted between sequentially adjacent building blocks. Assigning a critical building block to a given fragment in the target protein may indicate a likely spatial location, further reducing the computational folding complexity.
Conclusions
Binding and folding are similar processes, with similar underlying mechanisms. Experimentally, it has been shown that, in general, cutting the proteins and reassembling them yield similar conformations as when they are chain-connected. Similarly, linking a two-molecule complex yields a structure similar to a two-molecule association. These observations are consistent with a hierarchical protein-folding scheme. If we accept that protein folding is hierarchical, and that the driving force is the hydrophobic effect, we can devise approaches that make use of such a hierarchical concept. In such a scheme, a rational first step is to initially cut the target sequence into fragments that are likely to fold on themselves and subsequently to combinatorially assemble them.
Toward such an approach to reduce the computational complexity of protein folding, here we present two essential components: a library of nonredundant sequences of building blocks, clustered by their structures, and an algorithm assigning them to a target sequence. We further present some of the results we have obtained. These include proteins from different classes, with the building blocks that are not necessarily assigned from the same protein class. Our results are encouraging, indicating that folding by parts and part assembly may contribute to further progress in the protein-folding problem; nevertheless, it clearly needs further optimization, both on the algorithmic side, and in the scoring function. Furthermore, such schemes can combine with experiment, such as limited proteolysis (Fontana et al. 1997; Polverino de Laureto et al. 1999; Tsai et al. 2002) and spectroscopy to validate the target sequence cutting.
Materials and methods
The building blocks folding model and the cutting
The building block cutting algorithm (Tsai et al. 2000, 2001) uses a scoring function that measures the relative conformational stability of a candidate building block. The stability score for a given building block is defined as:
 |
where Z stands for compactness, H for hydrophobicity, and I for isolatedness. Each quantity is calculated as the deviation from the averaged value of known protein structures. The average and standard deviation of these quantities were calculated from a nonredundant dataset of 930 representative single chain proteins from the PDB. Terms with superscript 1 were determined with respect to fragment size and those with superscript 2 were determined as a function of the fraction of the fragment size to the whole protein.
The three components are as follows:
"Compactness" is defined as the solvent accessible surface area (ASA; Lee and Richards 1971; Shrake and Rupley 1973) of the fragment, divided by its minimum possible surface area, which is the area of a sphere with volume equal to that of the fragment.
 |
"Degree of isolation" is the ratio of the fragment’s nonpolar ASA that was originally buried in the interior of the protein but is exposed to the solvent after cutting, to the ASA of the isolated fragment. This component is a measurement of the extent to which the stand-alone fragment obeys the hydrophobicity rules when it is cut out of its context.
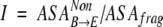 |
"Hydrophobicity" is the fraction of the buried nonpolar area out of the total nonpolar area of the fragment.
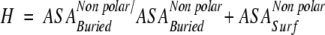 |
The scoring function is independent of the building block length, and reflects the population time of the building block in solution: the larger the stability, the higher the population time.
The cutting algorithm is iterative. The level of cutting is determined by counting the number of steps that are needed to trace back to the initial, uncut structure. This structure is considered the root node. The cutting stops when no new fragments can be generated.
The building block clusters
The building block database was created using the data collected by Tsai et al. (2000; available at http://protein3d.ncifcrf.gov/tsai/).
The clustering algorithm is as follows:
Each cluster has one or more representative member(s).
For each building block: Run over all existing clusters an algorithm that finds the best rigid matching between the candidate building block and the cluster representative building block, provided that the size of each of the two building blocks is at least 70% of the other building block. The rigid matching algorithm is geometric-hashing based (Fischer et al. 1992).
If the two building blocks match (within RMSD of 1.8 Å at most for cutting levels 1 and 2, 1.5 Å for levels 3 and 4, and 1.3 Å for levels 5 and 6, and the match size is at least 70% the size of the smallest protein), assign the building block to this cluster.
If, at the end of the procedure, the building block does not match any cluster representative, open a new cluster with this building block as the representative.
Clustering has two stages:
Classifying the building blocks according to their original SCOP (Murzin et al. 1995) protein family and clustering within the family.
Merging the initial clusters, with the representative of each initial cluster now representing all cluster members. In such cases, a cluster may have more than one representative.
We have created 24 different databases from four protein classes, all-α, α + β, α/β, and all-β proteins, for six cutting levels. The coordinates were taken from the PDB. Clustering was based on structural similarity. Each of the databases (from each class and level) was clustered separately. A more detailed description of the clustering procedure and analysis of the cluster statistics is given elsewhere (Haspel et al. 2003).
Figure 2 ▶ shows examples of multiply-aligned building blocks from two clusters. The multiple alignment has been carried out using MUSTA (Leibowitz et al. 2001a,b).
The nonredundant sequence database
At the end of the clustering procedure, we created a nonredundant sequence database that represents each clustered database. This is done as follows: For each cluster, the sequences of the cluster members are extracted to a FASTA format file (http://fasta.bioch.virginia.edu/fasta/). Within each cluster, the sequences are clustered using BLASTCLUST (http://www.ncbi.nlm.nih.gov/BLAST/). The sequence identity that determines whether two sequences belong to the same cluster is based on a statistical function developed by Abagyan and Batalov (1997). The function estimates the sequence identity and sequence similarity required to guarantee as much as possible structural similarity, depending on the lengths of the sequences. The function is described by a normal distribution with the following parameters:
 |
where L is the length of the shortest sequence. For example, if we wish to determine the percent sequence identity that guarantees a similar fold at 4σ level for two sequences, where the length of the shortest sequence is 25 amino acids, the threshold will be:
 |
We used this equation to cluster the sequences at 4σ levels, with over 99% confidence of having the same fold.
Therefore, each structural cluster can be associated with a nonredundant group of sequences with a local structural pattern. All nonredundant sequence groups of all structural clusters are gathered and reclustered using BLASTCLUST. Our goal at this stage is to eliminate all redundancies among clusters caused by similar sequences that fall into different structural clusters. The result of this procedure is a sequentially nonredundant database that represents the structural database by means of sequences. Each item in that database is associated with a specific structural cluster, such that a structural cluster can be represented by more than one sequence.
The building block assignment algorithm
The clusters of building blocks, grouped by their structures and by their sequences, constitute the input to a graph theoretic sequence assignment algorithm. The stages of the algorithm are the following:
Alignment of the target sequence against the building block sequence database.
Constructing a weighted, directed acyclic graph whose edges are the aligned building block sequences.
Adding fictitious start and end vertices to the graph.
Finding a building block assignment to the target sequence using a graph theoretic algorithm that finds the shortest path from the start to the end vertices.
Testing and displaying the results.
Following are the details of the assignment algorithm:
Sequence alignment
For a given target sequence whose building block composition we wish to assign, we carry out a sequence comparison with the database containing the representatives of all building block clusters, using BLAST (Altschul et al. 1990) with default parameters, allowing gaps (note that this is a one-against-all pairwise alignment, and a not multiple alignment).
Construction of the graph
If a sequence similarity above a given threshold is found (that is, a building block in the database is found to match an area of the target protein sequence), this building block is represented as a weighted graph vertex.
The weighting scheme.
The current weighting scheme contains two components: the BLAST match score and the building block stability score. A candidate building block is considered only if the match spans the entire building block (allowing a 10-residue gap at each side) and if the match length is at least 15 residue long. The building block’s score is: −(BLAST score + 3 * stability score). The factor of three is there because the stability score is usually smaller than the BLAST score by a factor of at least 3. This factor gives the two measurements a roughly equal weight in the scoring function. The minus sign leads to negative weights, so that the best path will be the "shortest," that is, with the smallest weight. Although the BLAST score is always positive, a larger stability score reflects a more stable building block. Using this scheme, the more negative the building block total score, the more "suitable" it is. The weighting function may also include secondary structure prediction. However, its effectiveness may depend on the implementation scheme. Substantial work is still needed in this direction, along with additional potential parameters and their relative weights.
The edges.
In the graph, a directed edge connects two vertices if they are sequentially adjacent, and if they adhere to the rules followed in the generation of the building blocks from the native structures (no more than a 7-residue overlap, and not over 15 residues apart). The edge connecting the vertices is assigned the average weight of the two vertices.
Finding the matches
The next step involves finding the shortest paths of consecutive edges. We add two fictive vertices to the graph. The first is the "source" (starting) and the last is the "target" (ending) vertex. A zero-weight edge connects each of these to a vertex that is up to a distance of 15 residues. These either follow (the starting source vertex) or are prior to (the ending target vertex). It is easy to see that the resulting graph is directed and acyclic. In such a graph, there exists an algorithm that finds the shortest path between any pair of known vertices in a short time. The shortest path algorithm (Cormen et al. 1990) is used for this purpose. A path is actually a consecutive set of vertices that leads from the starting source vertex to the ending target vertex. Because each of these vertices is a building block, the path represents a possible assignment of building blocks to the sequence. Among the obtained paths, the highest scoring ones are retained. These are assumed to have a higher probability of being a true possible building block assignment for the sequence.
Figure 3 ▶ presents a flowchart of the building block assignment algorithm and Figure 4 ▶ presents an illustration of the algorithm.
The advantage of using a graph algorithm instead of a simple assignment scheme is that the algorithm performs the assignment more efficiently. If we denote the number of vertices (candidate building blocks) by V and the number of edges connecting them by E, the algorithm finds the shortest path in time proportional to (V + E). E can be of the order of V2, but because this graph is usually sparse, the number of edges is smaller than that. The algorithm performs the sorting on graph vertices (enabled by the fact that the graph does not contain any cycles), and then finds the shortest paths on the sorted graph. Thus, not all possible candidate paths are tested, only those compatible with the sorting. A simple, straightforward assignment process would force us to go over all the possible assignments and therefore would take much longer. Actually, the number of possible valid graph paths is the number of possible combinations of consecutive vertices. The number of possible paths in a graph can be exponential in the number of vertices, but in these cases it can be estimated in Vk, where k is the number of building blocks that match each protein segment. k can be estimated as 3 or 4 in most cases. Thus, the Single Source Shortest Paths algorithm (Cormen et al. 1990) greatly reduces the computational time. Following the sequence assignment, the original conformation of the building block in the known native structure is assigned to the candidate building block. Currently, we focus on all paths with the starting vertex within the first 15 residues, consistent with the building block cutting algorithm (Tsai et al. 2000). There were a few cases, though, in which no building block cover was found for a part of the protein (see, for example, pyridoxine 5′-phosphate synthase in Table 2). In such a case only part of the protein was assigned, provided that it was large enough and contiguous (in this case it was the C-terminal domain, starting from residue 43). This implies allowing short gaps (up to 15 residues) and short overlaps. In the current version we allow an overlap of no more than two residues because the algorithm has a tendency toward creating large overlaps.
Acknowledgments
The research of R.N. and H.J.W. in Israel has been supported in part by the Ministry of Science grant and by the Center of Excellence in Geometric Computing and its Applications, funded by the Israel Science Foundation (administered by the Israel Academy of Sciences). The research of H.J.W. is partially supported by the Hermann Minkowski-Minerva Center for Geometry at Tel Aviv University. This project has been funded in whole or in part with federal funds from the National Cancer Institute, National Institutes of Health, under contract number NO1-CO-12400.
The content of this publication does not necessarily reflect the view or policies of the Department of Health and Human Services, nor does mention of trade names, commercial products, or organization imply endorsement by the U.S. Government. The publisher or recipient acknowledges right of the U.S. Government to retain a nonexclusive, royalty-free license in and to any copyright covering the article.
The publication costs of this article were defrayed in part by payment of page charges. This article must therefore be hereby marked "advertisement" in accordance with 18 USC section 1734 solely to indicate this fact.
Article and publication are at http://www.proteinscience.org/cgi/doi/10.1110/ps.0232903.
References
- Abagyan, R.A. and Batalov, S. 1997. Do aligned sequences share the same fold? J. Mol. Biol. 273 355–368. [DOI] [PubMed] [Google Scholar]
- Altschul, S.F., Gish, W., Miller, W., Myers, E.W., and Lipman, D.J. 1990. Basic local alignment search tool. J. Mol. Biol. 215 403–410. [DOI] [PubMed] [Google Scholar]
- Baldwin, R.L. and Rose, G.D. 1999a. Is protein folding hierarchic? I. Local structure and peptide folding. Trends Biochem. Sci. 24 26–33. [DOI] [PubMed] [Google Scholar]
- ———. 1999b. Is protein folding hierarchic? II. Folding intermediates and transition states. Trends Biochem. Sci. 24 77–84. [DOI] [PubMed] [Google Scholar]
- Bernstein, F.C., Koetzle, T.F., Williams, G.J.B., Meyer, E.F., Brice, M.D., Rodgers, J.R., Kennard, O., Shimanouchi, T., and Tasumi, M. 1977. The Protein Data Bank: A computer-based archival file for macromolecular structures. J. Mol. Biol. 112 535–542. [DOI] [PubMed] [Google Scholar]
- Bystroff, C. and Baker, D. 1998. Prediction of local structure in proteins using a library of sequence-structure motifs. J. Mol. Biol. 281 565–577. [DOI] [PubMed] [Google Scholar]
- Bystroff, C., Thorsson, V., and Baker, D. 2000. HMMSTR: A hidden Markov model for local sequence-structure correlations in proteins. J. Mol. Biol. 301 173–190. [DOI] [PubMed] [Google Scholar]
- Cormen, T., Leiserson, C., and Rivest, R. 1990. Introduction to algorithms. MIT Press, Cambridge, MA.
- Crippen, G.M. 1978. The tree structural organization of proteins. J. Mol. Biol. 126 315–332. [DOI] [PubMed] [Google Scholar]
- Dill, K.A. 1985. Theory for the folding and stability of globular proteins. Biochemistry 24 1501–1509. [DOI] [PubMed] [Google Scholar]
- ———. 1990. Dominant forces in protein folding. Biochemistry 31 7134–7155. [DOI] [PubMed] [Google Scholar]
- Dill, K.A. and Chan, H.S. 1997. From Levinthal to pathways to funnels. Nat. Struct. Biol. 4 10–19. [DOI] [PubMed] [Google Scholar]
- Fischer, D., Nussinov, R., and Wolfson, H.J. 1992. 3-D substructure matching in protein molecules. In Proceedings of the Third Symposium on Combinatorial Pattern Matching, Tucson, Arizona. Lecture Notes on Computer Science, vol. 644, pp. 133–147. Springer Verlag.
- Fisher, A. and Taniuchi, H. 1992. A study of core domains, and the core domain–domain interaction of cytochrome c fragment complex. Arch. Biochem. Biophys. 296 1–16. [DOI] [PubMed] [Google Scholar]
- Fontana, A., Polverino de Laureto, P., De Filippis, V., Scaramella, E., and Zambonin, M. 1997. Probing the partly folded states of proteins by limited proteolysis. Fold. Des. 2 R17–R26. [DOI] [PubMed] [Google Scholar]
- ———. 1999. Limited proteolysis in the study of protein conformation. In Proteolytic enzymes: Tools and targets (eds. E.E. Sterchi and W. Stocker), pp. 257–284. Springer Verlag, Heidelberg, Germany.
- Hardin, C., Pogorelov, T.V., and Luthey-Schulten, Z. 2002. Ab initio protein structure prediction. Curr. Opin. Struct. Biol. 12 176–181. [DOI] [PubMed] [Google Scholar]
- Haspel, N., Tsai, C.-J., Wolfson, H., and Nussinov, R. 2003. Hierarchical protein folding pathways: A computational study of protein fragments. Proteins 51 203–215. [DOI] [PubMed] [Google Scholar]
- Inbar, Y., Benyamini, H., Nussinov, R., and Wolfson, H. 2003. Protein structure prediction via combinatorial assembly of substructural motifs. Intelligent Systems in Molecular Biology (ISMB). Bioinformatics 1 1–10. [DOI] [PubMed] [Google Scholar]
- Kuhlman, B., Boice, J.A., Wu, W.J., Fairman, R., and Raleigh, D.P. 1997. Calcium binding peptides from α-lactalbumin: Implications for protein folding and stability. Biochemistry 36 4607–4615. [DOI] [PubMed] [Google Scholar]
- Kumar, S., Sham, Y.Y., Tsai, C.J., and Nussinov, R. 2001. Protein folding and function: The N-terminal fragment in adenylate kinase. Biophys. J. 80 2439–2454. [DOI] [PMC free article] [PubMed] [Google Scholar]
- Lee, B. and Richards, F. 1971. The interpretation of protein structures: Estimation of static accessibility. J. Mol. Biol. 55 379–400. [DOI] [PubMed] [Google Scholar]
- Leibowitz, N., Fligelman, Z., Nussinov, R., and Wolfson, H. 2001a. Automated multiple structure alignment and detection of a common structural motif. Proteins 43 235–245. [DOI] [PubMed] [Google Scholar]
- Leibowitz, N., Nussinov, R., and Wolfson, H. 2001b. MUSTA—A general, efficient, automated method for multiple structure alignment and detection of a common motif: Application to proteins. J. Comput. Biol. 8 93–121. [DOI] [PubMed] [Google Scholar]
- Lesk, A.M. and Rose, G.D. 1981. Folding unit in globular proteins. Proc. Natl. Acad. Sci. 78 4304–4308. [DOI] [PMC free article] [PubMed] [Google Scholar]
- Ma, B., Tsai, C.J., and Nussinov, R. 2000. Binding and folding: In search of intramolecular chaperone-like building block fragments. Protein Eng. 13 617–627. [DOI] [PubMed] [Google Scholar]
- Murzin, A.G., Brenner, S.E., Hubbard, T., and Chothia, C. 1995. SCOP: A structural classification of proteins database for the investigation of sequences and structures. J. Mol. Biol. 247 536–540. [DOI] [PubMed] [Google Scholar]
- Oliva, B., Bates, P., Quero, E., Aviles, F., and Sternberg, M.J. 1997. An automated classification of the structure of protein loops. J. Mol. Biol. 266 814–830. [DOI] [PubMed] [Google Scholar]
- Panchenko, A.R., Luthey-Schulten, Z., and Wolynes, P.G. 1996. Foldons, protein structural modules, and exons. Proc. Natl. Acad. Sci. 93 2008–2013. [DOI] [PMC free article] [PubMed] [Google Scholar]
- Panchenko, A.R., Luthey-Schulten, Z., Cole, R., and Wolynes, P.G. 1997. The foldon universe: A survey of structural similarity and self-recognition of independently folding units. J. Mol. Biol. 272 95–105. [DOI] [PubMed] [Google Scholar]
- Peng, Z.-Y. and Wu, L.C. 2000. Autonomous protein folding units. Adv. Protein Chem. 531–47. [DOI] [PubMed] [Google Scholar]
- Polverino de Laureto, P., Scaramella, E., Frigo, M., Wonderich, F.G., De Filippis, V., Zambonin, M., and Fontana A. 1999. Limited proteolysis of bovine α-lactalbumin: Isolation and characterization of protein domains. Protein Sci. 8 2290–2303. [DOI] [PMC free article] [PubMed] [Google Scholar]
- Polverino de Laureto, P., Vinante, D., Scaramella, E., Frare, E., and Fontana, A. 2001. Stepwise proteolytic removal of the β subdomain in α-lactalbumin. The protein remains folded and can form the molten globule in acid solution. Eur. J. Biochem. 268 4324–4333. [DOI] [PubMed] [Google Scholar]
- Rose, G.D. 1979. Hierarchic organization of domains in proteins. J. Mol. Biol. 134 447–470. [DOI] [PubMed] [Google Scholar]
- Shatsky, M., Wolfson, H.J., and Nussinov, R. 2002. Flexible protein alignment and hinge detection. Proteins 48 242–256. [DOI] [PubMed] [Google Scholar]
- Shrake, A. and Rupley, J. 1973. Environment and exposure to solvent of protein atoms. Lysozyme and insulin. J. Mol. Biol. 79 351–371. [DOI] [PubMed] [Google Scholar]
- Srinivasan R. and Rose G.D. 1995. LINUS—A simple algorithm to predict the fold of a protein. Proteins 22 81–99. [DOI] [PubMed] [Google Scholar]
- ———. 1999. A physical basis for protein secondary structure. Proc. Natl. Acad. Sci 96 14258–14263. [DOI] [PMC free article] [PubMed] [Google Scholar]
- Taniuchi, H., Parr, G.R., and Juillerat, M.A. 1986. Complementation in folding and fragment exchange. Methods Enzymol. 131 185–217. [DOI] [PubMed] [Google Scholar]
- Tsai, C., Maizel, J., and Nussinov, R. 2000. Anatomy of protein structure: Visualizing how a 1d protein chain folds into a 3d shape. Proc. Natl. Acad. Sci. 97 12038–12043. [DOI] [PMC free article] [PubMed] [Google Scholar]
- Tsai, C., Ma, B., Sham, Y., Kumar, S., Wolfson, H., and Nussinov, R. 2001. Hierarchical, building block based computational method for protein structure prediction. IBM Journal of Research and Development 45 513–523. [Google Scholar]
- Tsai, C.J., Polverino de Laureto, P., Fontana, A., and Nussinov R. 2002. Comparison of protein fragments identified by limited proteolysis and computational cutting of proteins. Protein Sci. 11 1753–1770. [DOI] [PMC free article] [PubMed] [Google Scholar]
- Wodak, S.J. and Janin, J. 1981. Location of structural domains in proteins. Biochemistry 20 6544–6552. [DOI] [PubMed] [Google Scholar]
- Wu, L.C., Peng, Z.Y., and Kim, P.S. 1995. Bipartite structure of the α-lactalbumin molten globule. Nat. Struct. Biol. 2 281–286. [DOI] [PubMed] [Google Scholar]
- Yang, X.M., Yu, W.F., Li, J.H., Fuchs, J., Rizo, J., and Tasayco, M.L. 1998. NMR evidence for the reassembly of an α/β domain after cleavage of an α-helix: Implications for protein design. J. Am. Chem. Soc. 120 7985–7986. [Google Scholar]
- Zehfus, M.H. 1993. Improved calculations of compactness and a reevaluation of continuous compact units. Proteins 16 293–300. [DOI] [PubMed] [Google Scholar]
- Zehfus, M.H. and Rose, G.D. 1986. Compact units in proteins. Biochemistry 25 5759–5765. [DOI] [PubMed] [Google Scholar]